Yum! Brands Inc. YUM Stock Analysis

Yum! Brands Inc. stock trades under the ticker YUM & has shown recent bullishness that traders & investors should research further into.

YUM stock closed at $116.32/share on 9/8/2022.

Yum! Brands Inc. YUM Stock’s Technical Performance Broken Down

Yum! Brands Inc. YUM Stock's Technical Performance Over The Last Year

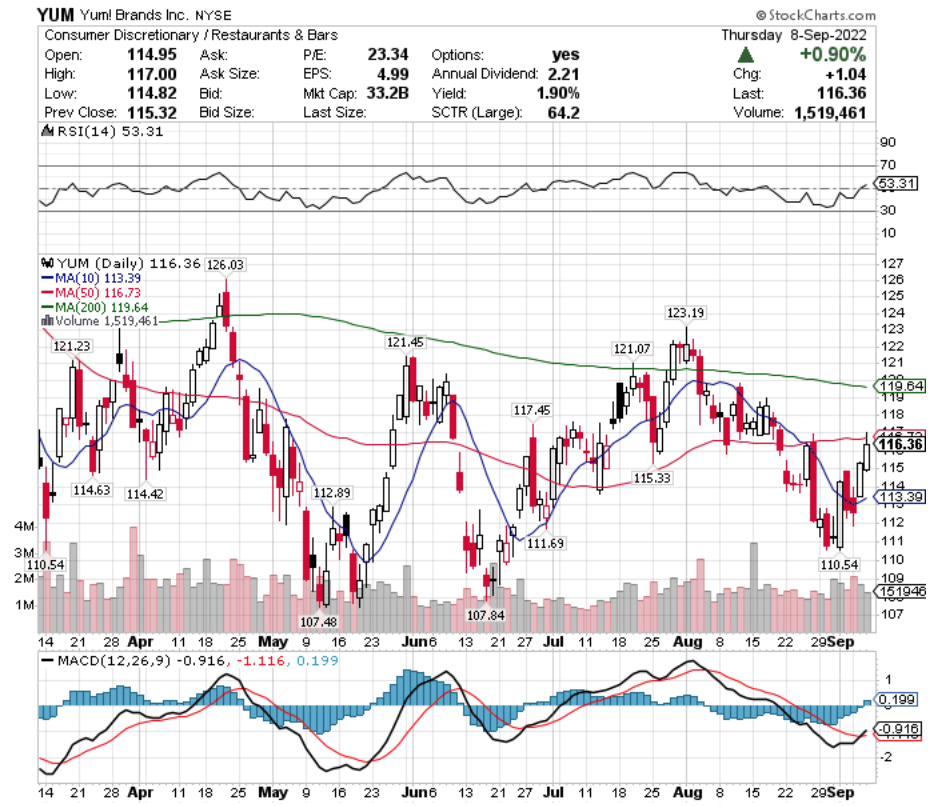
YUM Stock Price: $116.36

10 Day Moving Average: $113.39

50 Day Moving Average: $116.73

200 Day Moving Average: $119.64

RSI: 53.31

MACD: -0.916

Yesterday, YUM stock completed a bullish MACD crossover, settling just below its 50 day moving average.

Recent trading volumes have been about average for the year prior, and their RSI is neutral, signaling that there may be more momentum to come in the near-term.

They have support at the $115.33 & $114.63/share price levels, while they try to break above the $117.45 & $121.07 resistance levels.

Yum! Brands Inc. YUM Stock As A Long-Term Investment

Investors who are focused on the long-term will like YUM stock’s P/E (ttm) of 22.59, however they do not have a positive P/B (mrq).

Investors will want to look closer into their recently reported 2.1% Quarterly Revenue Growth Y-o-Y, with -42.7% Quarterly Earnings Growth Y-o-Y.

Their balance sheet also will warrant a closer review, with $412M of Total Cash (mrq) & $12.37B of Total Debt (mrq).

YUM stock pays a 0.93% dividend, which appears to be stable in the long-run, with a 42.89% payout ratio.

79% of YUM stock’s outstanding share float is owned by institutional investors.

Yum! Brands Inc. YUM Stock As A Short-Term Trade Using Options

Short-term oriented traders can use options to hedge against market volatility, while profiting from movements in YUM stock’s price.

I am looking at the contracts with the 9/16 expiration date.

The $115, $110 & $105 call options are all in-the-money, listed from highest to lowest level of open interest.

The $120, $135 & $125 puts are also all in-the-money, with the former being more liquid than the latter.

Tying It All Together

YUM stock has many interesting attributes that traders & investors are sure to like.

Investors will like their modest dividend, but will need to review their balance sheet, as well as their recent growth struggles before investing.

Traders will like their recent technical performance, as well as the liquidity of their options.

Overall, it is worth taking a closer look at YUM stock to see how it fits into your portfolio strategy.

*** I DO NOT OWN SHARES OF YUM STOCK AT THE TIME OF PUBLISHING THIS ARTICLE ***

Baxter Intl Inc. BAX Stock Analysis

Baxter Intl. Inc. stock trades under the ticker BAX & has shown recent bullishness that traders & investors should take a closer look into.

BAX stock closed at $58.73/share on 9/7/2022.

Baxter Intl Inc. BAX Stock’s Technical Performance Broken Down

Baxter Intl Inc. BAX Stock's Technical Performance Over The Last Year

BAX Stock Price: $58.73

10 Day Moving Average: $57.13

50 Day Moving Average: $61.28

200 Day Moving Average: $73.98

RSI: 48.89

MACD: -1.408

Yesterday, BAX stock completed a bullish MACD crossover, breaking out & settling above its 10 day moving average.

Recent trading volumes have been about average compared to the year prior & their RSI is neutral, signaling that there may be more momentum in the near-term to come.

They have support at the $57.20 & $54.45/share price levels, as they try to break above the $61.93 & $62.38/share resistance levels.

Baxter Intl Inc. BAX Stock As A Long-Term Investment

Long-term oriented investors will like BAX stock’s P/E (ttm) of 27.33, but may find their 3.11 P/B (mrq) to be a bit too rich.

They recently reported 20.9% Quarterly Revenue Growth Y-o-Y, despite -15.4% Quarterly Earnings Growth Y-o-Y, which investors may want to dig a bit deeper into.

Their balance sheet will also require a closer examination before investment, with a reported $1.85B of Total Cash (mrq) & $17.16B of Total Debt (mrq).

BAX stock pays a 2.07% dividend, which appears stable in the mid-term with a 56.5% payout ratio, but investors would also be prudent to see how their balance sheet health may impact this in the long-term.

89.5% of BAX stock’s outstanding share float is owned by institutional investors.

Baxter Intl Inc. BAX Stock As A Short-Term Trade Using Options

Short-term focused traders can use options to hedge against market volatility, while profiting from BAX stock’s price movements.

I am looking at the contracts with the 9/16 expiration date.

The $58, $57 & $57.50 calls are all in-the-money, listed from highest to lowest level of open interest.

The $60 & $59 puts are also in-the-money, with the former being more liquid than the latter.

Tying It All Together

BAX stock has many interesting attributes that traders & investors are sure to find appealing.

Investors will like their dividend & P/E (ttm), but may want to look deeper into their balance sheet, as well as recent earnings performance.

Traders will like their recent technical performance, as well as the liquidity of their options.

All-in-all, it is worth taking a closer look into how BAX stock fits into your portfolio strategy.

*** I DO NOT OWN SHARES OF BAX STOCK AT THE TIME OF PUBLISHING THIS ARTICLE ***

ConocoPhillips COP Stock Analysis

ConocoPhillips stock trades under the ticker COP & has recently cooled off a bit after a bullish summer, making it worth examining for an entry point for traders & investors.

COP stock closed at $108.63/share on 9/6/2022.

ConocoPhillips COP Stock’s Technical Performance Broken Down

ConocoPhillips COP Stock's Technical Performance Over The Last Year

COP Stock Price: $108.63

10 Day Moving Average: $110.30

50 Day Moving Average: $95.70

200 Day Moving Average: $91.97

Yesterday, COP stock completed a bearish MACD crossover, settling just below its 10 day moving average.

Recent volumes have been about average, and their RSI is still overbought, signaling that there may be a near-term entry-point for investors & traders to take advantage of into weakness.

COP has support at the $106.99 & $105.75/share levels, as they look to break above the $112 & $115.47 resistance levels.

ConocoPhillips COP Stock As A Long-Term Investment

Long-term focused investors will like COP stock’s 9.1 P/E (ttm), but may find that their 2.8 P/B (mrq) is a bit rich for their liking.

They recently reported 123.7% Quarterly Revenue Growth Y-o-Y, with 146.1% Quarterly Earnings Growth Y-o-Y.

Their balance sheet will require a more thorough review, with $8.18B of Total Cash (mrq) & $16.97B of Total Debt (mrq).

COP stock pays a 2.1% dividend, which appears stable in the long-term, as their payout ratio is 24.83%.

81.81% of COP stock’s outstanding share float is owned by institutional investors.

ConocoPhillips COP Stock As A Short-Term Trade Using Options

Short-term focused traders can use options to profit from price movements in COP stock, while protecting their portfolio from broader market volatility.

I am looking at the contracts with the 9/16 expiration.

The $105, $108 & $104 call options are all in-the-money, listed from highest to lowest level of open interest.

The $112, $110 & $109 puts are also all in-the-money, listed from most to least liquid strike.

Tying It All Together

COP stock has many interesting characteristics that traders & investors are sure to find appealing.

Investors will like their dividend & valuation metrics, but may want to look closer into their balance sheet before investing.

Traders will like their current technical performance & the liquidity of their options.

All-in-all, it is worth taking a closer look into COP stock to see how it fits into your portfolio strategy.

*** I DO NOT OWN SHARES OF COP STOCK AT THE TIME OF PUBLISHING THIS ARTICLE ***

Evertec, Inc. EVTC Stock Analysis

Evertec, Inc. stock trades under the ticker EVTC & has shown recent bullishness that traders & investors should research further into.

EVTC stock closed at $33.48/share on 9/6/2022.

Evertec, Inc. EVTC Stock’s Technical Performance Broken Down

Evertec, Inc. EVTC Stock's Technical Performance Over The Last Year

EVTC Stock Price: $33.48

10 Day Moving Average: $33.62

50 Day Moving Average: $36.02

200 Day Moving Average: $40.37

RSI: 38.19

MACD: -0.832

Yesterday, EVTC stock completed a bullish MACD crossover, but was unable to settle above its 10 day moving average.

Recent trading volumes have been above average, and their RSI is oversold, signaling that there may be some near-term upward momentum to come.

They have support at the $33.01 & $32.57/share price levels, as they attempt to break out above the $33.53 & $34.75/share resistance levels.

Evertec, Inc. EVTC Stock As A Long-Term Investment

Long-term oriented investors will like EVTC’s 16.28 P/E (ttm), but will find their 4.33 P/B (mrq) to be a bit too rich.

They recently reported 7.7% Quarterly Revenue Growth Y-o-Y, despite -31.7% Quarterly Earnings Growth Y-o-Y, which is something investors will need to check out.

Their balance sheet will also require a review before investing, with $288.1M of Total Cash (mrq) & $476.1M of Total Debt (mrq).

EVTC stock pays a modest 0.6% dividend, which appears to be stable in the long-run, as their payout ratio is 9.76%.

90.95% of EVTC stock’s outstanding share float is owned by institutional investors.

Evertec, Inc. EVTC Stock As A Short-Term Trade Using Options

Short-term oriented traders can use options to profit from price movements in EVTC stock, while also protecting their portfolios against broader market volatility.

I am looking at the contracts with the 9/16 expiration date.

There are no call options currently in-the-money, with the $35 strike being the closest liquid strike.

The $35 puts are in-the-money & have modest open interest levels.

Tying It All Together

EVTC stock has many interesting characteristics that traders & investors should find appealing.

Investors will like their P/E & stable dividend yield, but may want to look into their balance sheet a bit deeper.

Traders will like their recent technical resilience in a volatile market, but may be disappointed by how illiquid their options are.

Overall, it is worth taking a closer look at EVTC stock to see how it fits into your portfolio strategy.

*** I DO NOT OWN SHARES OF EVTC STOCK AT THE TIME OF PUBLISHING THIS ARTICLE ***

Smith and Nephew PLC SNN Stock Analysis

Smith and Nephew PLC stock trades under the ticker SNN & has shown recent bullishness that traders & investors should research further into.

SNN stock closed at $24.80/share on 9/2/2022.

Smith and Nephew PLC SNN Stock’s Technical Performance Broken Down

Smith and Nephew PLC SNN Stock's Technical Performance Over The Last Year

SNN Stock Price: $24.80

10 Day Moving Average: $24.24

50 Day Moving Average: $26.48

200 Day Moving Average: $30.92

RSI: 43.65

MACD: -0.72

On Friday, SNN stock completed a bullish MACD crossover, breaking out & settling above its 10 day moving average.

Recent trading volumes have been above average compared to the year prior, and their RSI is on the oversold end of neutral, signaling that there may be more momentum to come in the near-term.

They have support at $23.48 & $24.80, as they try to break above the $26.54 & $26.56/share resistance levels.

Smith and Nephew PLC SNN Stock As A Long-Term Investment

Long-term oriented investors will find SNN stock’s P/E (ttm) of 21.91 to be appealing, although they may find their P/B (mrq) of 2 to be a little bit higher than they’d like.

Before investing, research should be done into their recently reported growth, with 0% Quarterly Revenue Growth Y-o-Y & -13.7% Quarterly Earnings Growth Y-o-Y.

Their balance sheet will also require some further investigating, with $516M of Total Cash (mrq) & $2.89B of Total Debt (mrq).

SNN stock pays a 1.52% dividend, which may not be sustainable in the long-run, as their payout ratio is 66.3%.

8.94% of SNN stock’s outstanding share float is owned by institutional investors.

Smith and Nephew PLC SNN Stock As A Short-Term Trade Using Options

Short-term oriented traders can use options to profit from price movements in SNN stock, while hedging against broader market volatility.

I am looking at the contracts with the 9/16 expiration date.

The $22.50 calls are currently in-the-money, with the $25 calls approaching being at the money.

The $25, $30 & $35 puts are also all in-the-money, listed from highest to lowest levels of open interest.

Tying It All Together

SNN stock has many interesting characteristics that traders & investors are sure to find appealing.

Investors will like their valuation metrics, as well as their dividend yield, but may want to research their recent growth & balance sheet more before investing.

Traders will like their current technical momentum, but may wish that their options were more liquid.

Overall, it is worth taking a closer look into SNN stock to see how it fits into your portfolio strategy.

*** I DO NOT OWN SHARES OF SNN STOCK AT THE TIME OF PUBLISHING THIS ARTICLE ***

SKTelecom Co. Ltd. SKM Stock Analysis

SKTelecom Co. Ltd. stock trades under the ticker SKM & has shown recent bullishness in a volatile market that traders & investors should research further into.

SKM stock closed at $21.54/share on 9/1/2022.

SKTelecom Co. Ltd. SKM Stock’s Technical Performance Broken Down

SKTelecom Co. Ltd. SKM Stock's Technical Performance Over The Last Year

SKM Stock Price: $21.54

10 Day Moving Average: $21.25

50 Day Moving Average: $22.34

200 Day Moving Average: $24.69

RSI: 44.94

MACD: -0.358

Yesterday, SKM stock completed a bullish MACD crossover, settling above its 10 day moving average.

Recent volumes have been above average & their RSI is neutral, signaling that there may be more momentum in the near-term for them to continue climbing higher.

They have support at the $20.95/share level, as they attempt to break out above the $21.61 & $21.88/share resistance levels.

SKTelecom Co. Ltd. SKM Stock As A Long-Term Investment

Long-term oriented investors will like SKM stock’s valuation metrics, with a 14.24 P/E (ttm) & a 0.97 P/B (mrq).

They recently reported 4% Quarterly Revenue Growth Y-o-Y, but -66.8% Quarterly Earnings Growth Y-o-Y, which investors should research before buying.

Their balance sheet will need a further review before investing as well, with $114B of Total Cash (mrq) & a Total Debt/Equity (ttm) of 69.4.

SKM stock pays a 3.33% dividend yield & 5.12% of their outstanding share float is owned by institutional investors.

SKTelecom Co. Ltd. SKM Stock As A Short-Term Trade Using Options

Short-term oriented traders can use options to profit from SKM stock’s price movements, while hedging off market volatility.

I am looking at the contracts with the 9/16 expiration date.

The $15 & $20 call options are in-the-money, listed from most to least liquid.

The $22.50 & $25 puts are also in-the-money, with the former having more open interest than the latter.

Tying It All Together

SKM stock has many characteristics that traders & investors are sure to find appealing.

Investors will like their valuation metrics & dividend yield, but may want to review their balance sheet more thoroughly before investing.

Traders will like their current technicals amid a volatile market, but may be disappointed by the liquidity of their options.

All-in-all, it is worth taking a closer look into SKM stock to see how it fits into your portfolio strategy.

*** I DO NOT OWN SHARES OF SKM STOCK AT THE TIME OF PUBLISHING THIS ARTICLE ***

Sibanye Stillwater Ltd SBSW Stock Analysis

Sibanye Stillwater Ltd stock trades under the ticker SBSW & has shown recent bullishness that traders & investors should take a closer look into.

SBSW stock closed at $9.95/share on 8/26/2022.

Sibanye Stillwater Ltd SBSW Stock’s Technical Performance Broken Down

Sibanye Stillwater Ltd SBSW Stock's Technical Performance Over The Last Year

SBSW Stock Price: $9.95

10 Day Moving Average: $9.65

50 Day Moving Average: $9.93

200 Day Moving Average: $13.15

RSI: 51.4

MACD: -0.104

On Friday, SBSW stock completed a bullish MACD crossover, settling just above its 50 day moving average, despite falling 0.4%.

Recent trading volumes have been lighter than average compared to the year prior, and their RSI is neutral, signaling that market participants lack confidence in how to value SBSW stock.

They have support at the $9.57 & $9.35/share price levels, as they try to break above the $10.12 & $10.56/share resistance levels.

Sibanye Stillwater Ltd SBSW Stock As A Long-Term Investment

Long-term oriented investors will like SBSW stock’s valuation metrics, with a 3.53 P/E (ttm) & a 1.41 P/B (mrq).

They recently reported 13.6% Quarterly Revenue Growth Y-o-Y, which investors may want to investigate as it came with -58.8% Quarterly Earnings Growth Y-o-Y.

Their balance sheet looks appealing, with $30.29B of Total Cash (mrq) & $20.58B of Total Debt (mrq).

SBSW stock pays a 12.97% dividend yield, which appears to be stable in the long-run, as their payout ratio is 55.65%.

7.92% of SBSW stock’s outstanding share float is owned by institutional investors.

Sibanye Stillwater Ltd SBSW Stock As A Short-Term Trade Using Options

Short-term focused traders can use options to profit from price movements in SBSW stock, while protecting their portfolio from broader market volatility.

I am looking at the contracts with the 9/16 expiration date.

The $7.50 & $5 calls are in-the-money, with the former being more liquid than the latter strike price.

The $10, $12.50 & $15 puts are also all in-the-money, listed from highest to lowest level of open interest.

Tying It All Together

SBSW stock has many unique characteristics that traders & investors are sure to find appealing.

Investors will like their balance sheet & valuation metrics, as well as their dividend yield, should it remain sustainable.

Traders will like their recent technical performance, but may be disappointed by how liquid their options are.

Overall, it is worth taking a closer look into SBSW stock to see how it fits into your portfolio strategy.

*** I DO NOT OWN SHARES OF SBSW STOCK AT THE TIME OF PUBLISHING THIS ARTICLE ***

McKesson Corp. MCK Stock Analysis

McKesson Corp. stock trades under the ticker MCK & has shown recent bullishness in a volatile broader market that traders & investors should take a closer look into.

MCK stock closed at $363.22/share on 8/24/2022.

McKesson Corp. MCK Stock’s Technical Performance Broken Down

McKesson Corp. MCK Stock's Technical Performance Over The Last Year

MCK Stock Price: $363.22

10 Day Moving Average: $367.15

50 Day Moving Average: $335.99

200 Day Moving Average: $291.60

RSI: 61.02

MACD: 9.584

Yesterday, MCK stock completed a bearish MACD crossover, after climbing for two consecutive months since mid-June.

Recent volumes have been lighter than average for the year prior, and their MACD is still on the overbought side of neutral, showing signs of near-term cooling, which may offer buying opportunities for investors & traders.

They have support at the $346.30/share price level, as they try to break out above the $375.23/share resistance level.

McKesson Corp. MCK Stock As A Long-Term Investment

Long-term oriented investors may find MCK stock’s valuation metrics to be a bit rich, with a 38.64 P/E (ttm) & a 5.04 P/B (mrq).

They recently reported 7.1% Quarterly Revenue Growth Y-o-Y, with 58% Quarterly Earnings Growth Y-o-Y.

Their balance sheet may require a closer examination before investing, with $2.23B of Total Cash (mrq) & $7.43B of Total Debt (mrq).

MCK stock pays a 0.52% dividend yield, which appears sustainable in the long-run, as their payout ratio is 19.96%.

89.86% of MCK stock’s outstanding share float is owned by institutional investors.

McKesson Corp. MCK Stock As A Short-Term Trade Using Options

Short-term oriented traders can use options to protect their portfolios from volatility, while also profiting from price movements in MCK stock.

I am looking at the contracts with the 9/16 expiration date.

The $360 calls are in-the-money.

The $370, $365 & $367.50 puts are also all in-the-money, listed from most to least liquid strike price.

Tying It All Together

MCK stock has many interesting attributes that traders & investors are sure to find appealing.

Investors will like their modest dividend yield & recent growth, but may want to do more research into the structure of their balance sheet before investing.

Traders will like their recent technical performance over the summer, but may be disappointed by how liquid their options are.

Overall, it is worth taking a closer look into MCK stock to see how it fits into your portfolio strategy.

*** I DO NOT OWN SHARES OF MCK STOCK AT THE TIME OF PUBLISHING THIS ARTICLE ***

Novo Nordisk A S NVO Stock Analysis

Novo Nordisk A S stock trades under the ticker NVO & has shown recent bullishness that traders & investors should take a closer look into.

NVO stock closed at $106.57/share on 8/23/2022.

Novo Nordisk A S NVO Stock’s Technical Performance Broken Down

Novo Nordisk A S NVO Stock's Technical Performance Over The Last Year

NVO Stock Price: $106.57

10 Day Moving Average: $106.06

50 Day Moving Average: $109.02

200 Day Moving Average: $107.21

RSI: 47.74

MACD: -1.361

Yesterday, NVO stock completed a bullish MACD crossover, while dropping -0.91% to settle in between its 10 & 200 Day Moving Averages.

Their recent trading volumes are above average compared to the year prior & their RSI is neutral, but that may not be enough to power them higher amid all of the broader market volatility in the coming week.

They have support at the $105.74 & $105.58-price levels, while they try to break out above the $106.89 & $107.34/share resistance levels.

Novo Nordisk A S NVO Stock As A Long-Term Investment

Long-term oriented investors may find NVO stock’s valuation metrics to be a bit higher than they’d like, with a 36.06 P/E (ttm) & a 24.2 P/B (mrq).

They recently reported 24.9% Quarterly Revenue Growth Y-o-Y, with 9.9% Quarterly Earnings Growth Y-o-Y.

Their balance sheet looks strong, with $31.04B in Total Cash (mrq) & $25.43B of Total Debt (mrq).

NVO stock pays a 1.49% dividend yield, which appears to be sustainable in the long-run, with a 46.51% payout ratio.

Only 8.68% of NVO stock’s outstanding share float is owned by institutional investors.

Novo Nordisk A S NVO Stock As A Short-Term Trade Using Options

Short-term focused traders can use options to profit from NVO stock’s price movements, while hedging against broader market volatility.

I am looking at the contracts with the 9/16 expiration date.

The $105, $92.50 & $100 call options are all in-the-money, listed from highest to lowest level of open interest.

The $95, $97.50 & $100 puts are also in-the-money, with the former being more liquid than the latter two strike prices.

Tying It All Together

NOV stock offers many interesting characteristics for traders & investors.

Investors will like their balance sheet & dividend yield, but may find their valuation metrics to be a bit too high.

Traders will like their current technical set up, as well as the liquidity of their options.

Overall, it is worth taking a closer look into NOV stock to see how it fits into your portfolio strategy.

*** I DO NOT OWN SHARES OF NVO STOCK AT THE TIME OF PUBLISHING THIS ARTICLE ***

Johnson & Johnson JNJ Stock Analysis

Johnson & Johnson stock trades under the ticker JNJ & has shown recent bullishness amid volatile market conditions that traders & investors should research further into.

JNJ stock closed at $167.59/share on 8/22/2022.

(**The author has a long puts & long shares position in JNJ stock**)

Johnson & Johnson JNJ Stock’s Technical Performance Broken Down

Johnson & Johnson JNJ Stock's Technical Performance Over The Last Year

JNJ Stock Price: $167.59

10 Day Moving Average: $166.81

50 Day Moving Average: $172.12

200 Day Moving Average: $169.68

RSI: 43.57

MACD: -1.82

Yesterday, JNJ stock completed a bullish MACD crossover, settling ~1% above its closest support level, and short of its 200 day moving average.

Their RSI is on the oversold side of neutral, and recent trading volumes have been about average compared to the year prior, signaling that there is still uncertainty among market participants about their value.

JNJ stock has support at the $166.14 & $164.02 price levels, as they try to break out above the $168.63 & $170.44/share resistance levels.

Johnson & Johnson JNJ Stock As A Long-Term Investment

Long-term oriented investors will like JNJ stock’s 24.64 P/E (ttm), but may find their 5.83 P/B (mrq) to be a bit rich.

Investors will also want to look further into their recently reported 3% Quarterly Revenue Growth Y-0-Y & -23.3% Quarterly Earnings Growth Y-o-Y.

Their balance sheet looks appealing, with $32.57B of Total Cash (mrq) & $32.6B of Total Debt (mrq).

JNJ stock pays a 2.56% dividend yield, which may not be sustainable in the long-run, as their payout ratio is 62.74%.

70.64% of JNJ stock’s outstanding share float is owned by institutional investors.

Johnson & Johnson JNJ Stock As A Short-Term Trade Using Options

Short-term focused traders can use options to profit from price movements in JNJ stock, while protecting their portfolio from external market volatility.

I am looking at the contracts with the 9/16 expiration date.

The $165, $162.50 & $160 call options are all in-the-money, listed from most to least open interest.

The $170, $175 & $180 puts are also all in-the-money, listed from the most to least liquid strike price.

Tying It All Together

JNJ stock has many interesting characteristics that traders & investors will find appealing.

Investors will like their healthy balance sheet, as well as their dividend yield, but may want to check how sustainable the yield is in the long-run.

Traders will like their current momentum amid a volatile market, as well as the liquidity of their options.

All-in-all, JNJ stock is worth taking a closer look into to see how it fits into your portfolio strategy.

*** I HAVE A LONG SHARES & PUTS POSITION IN JNJ STOCK AT THE TIME OF PUBLISHING THIS ARTICLE ***