Northwest Pipe Co. NWPX Stock Analysis

Northwest Pipe Co. stock trades under the ticker NWPX & has shown recent bullishness that traders & investors should research further.

NWPX stock closed at $26.26/share on 4/6/2022.

Northwest Pipe Co. NWPX Stock’s Technicals Broken Down

Northwest Pipe Co. NWPX Stock's Technical Performance Over The Last Year

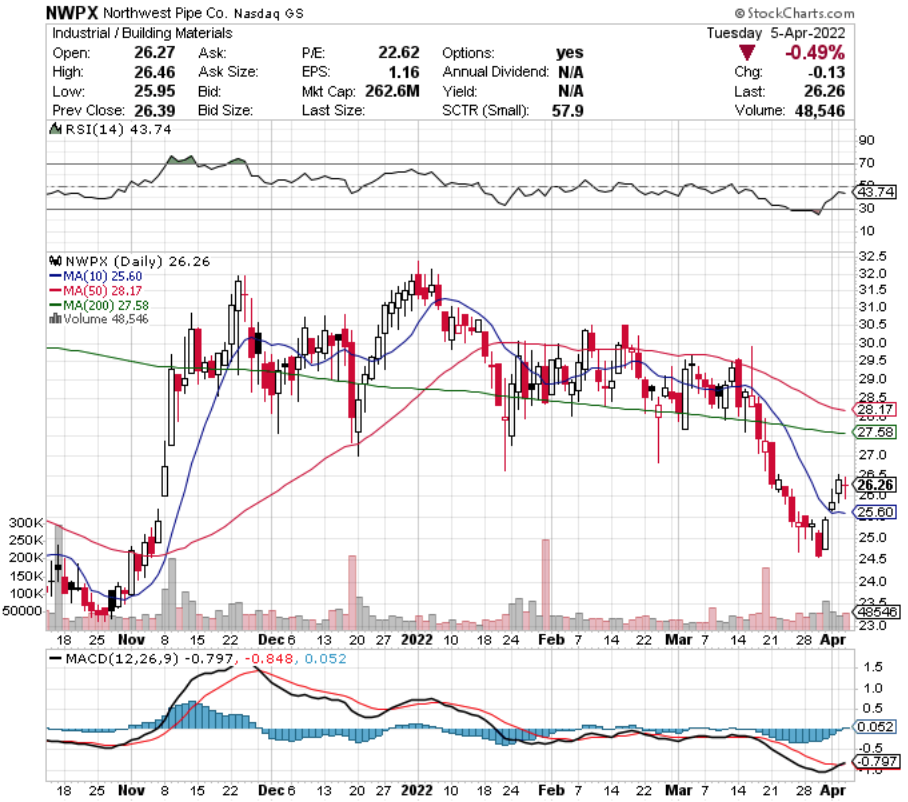
NWPX Stock Price: $26.26

10 Day Moving Average: $25.60

50 Day Moving Average: $28.17

200 Day Moving Average: $27.58

RSI: 43.7

MACD: -0.797

Yesterday, NWPX completed a bullish MACD crossover, after breaking out above its 10 day moving average last week.

Their recent trading volume has been about average compared to the year prior.

With an RSI that is still veering towards oversold territory, they look to have more momentum to come in the near-term to push their share price higher.

They need to test & break above the $26.39, $26.52 & $26.62/share resistance levels.

Northwest Pipe Corp. NWPX Stock As A Long-Term Investment

Long-term oriented investors will like NWPX stock’s valuation metrics, with a P/E (ttm) of 22.64 & a P/B (mrq) of 0.92.

They recently reported 47.8% Quarterly Revenue Growth Y-o-Y.

NWPX stock’s balance sheet may require a closer review before an investment, as they have $3M in Total Cash (mrq) & $187.4M in Total Debt (mrq).

Despite not offering a dividend yield, 86.6% of NWPX stock’s outstanding share float is held by institutional investors.

Northwest Pipe Corp. NWPX Stock As A Short-Term Trade Using Options

Short-term oriented traders can use options to harness gains from movements in NWPX stock in any direction.

I am looking at the contracts with the 4/14 expiration date.

The $30 calls are the only ones with open interest, which is also true for May, but in June there is liquidity in the $12.50, $22.50 & $25 strike price contracts.

The further out options will cost a premium to nearer dated ones though.

The $25 puts are the only strike price with liquidity at this level as well, although they may not be able to get into the money in a week & two days of trading.

Tying It All Together

All-in-all NWPX has many unique characteristics that traders & investors may like.

Investors will like their valuation metrics, but may be disappointed by their lack of a dividend yield.

Traders will like their momentum, but be disappointed by their lack of liquidity in their near-term options.

Overall, NWPX stock is worth taking a closer look into, regardless of your trading style.

*** I DO NOT OWN SHARES OF NWPX STOCK ***

Lancaster Colony Corp. LANC Stock

Lancaster Colony Corp. stock trades under the ticker LANC & has recently shown bullish signals that traders & investors should take a closer look at.

LANC stock closed at $152.22/share on 4/4/2022.

Lancaster Colony Corp. LANC Stock’s Technicals Broken Down

Lancaster Colony Corp. LANC Stock's Technical Performance Over The Last Year

LANC Stock Price: $152.22

10 Day Moving Average: $152.21

50 Day Moving Average: $157.11

200 Day Moving Average: $168.84

RSI: 44.94

MACD: -1.891

Yesterday, LANC stock completed a bullish MACD crossover, one day after breaking out above its 10 day moving average.

Their recent trading volume is about average for the last year.

With an RSI that is still below neutral & 3% between their 10 & 50 day moving averages, they look to have additional momentum in the near-term future.

They need to break out above the $154.72, $154.86 & $155.41-resistance levels.

Lancaster Colony Corp. LANC Stock As A Long-Term Investment

Long-term oriented investors may find LANC stock’s P/E (ttm) appealing at 33.49, but may think their 4.86 P/B (mrq) is a bit rich.

They recently reported 14.2% Quarterly Revenue Growth Y-o-Y.

Their balance sheet looks very attractive, with $114.01M in Total Cash (mrq) & Total Debt (mrq) of $16.25M.

LANC stock pays a 1.97% dividend yield, which appears to be stable, despite their 66.8% payout ratio, which is above average.

59.8% of LANC stock’s outstanding share float is held by institutional investors.

Lancaster Colony Corp. LANC Stock As A Short-Term Trade Using Options

Short-term focused traders can profit from movements in LANC stock’s price by trading options.

I am looking at the contracts with the 4/14 expiration date.

The $150, $155 & $160 call options look appealing, although they have very low levels of open interest.

The $155 & $160 puts also look interesting, but suffer from the same lack of liquidity, which traders may not like.

Tying It All Together

Overall, LANC stock deserves a closer look, regardless of your trading style.

Long-term focused investors will like their balance sheet & dividend yield, despite their high P/B (mrq).

Short-term focused traders will like their momentum, but may have qualms with the liquidity of their near-term options contracts.

*** I DO NOT OWN SHARES OF LANC STOCK ***

AZZ, Inc. AZZ Stock Analysis

AZZ, Inc. stock trades under the ticker AZZ & has shown recent bullish signals that traders & investors may want to take a closer look into.

AZZ stock closed at $49.37/share on 4/4/2022.

AZZ, Inc. AZZ Stock’s Technicals Broken Down

AZZ, Inc. AZZ Stock's Technical Performance Over The Last Year

AZZ Stock Price: $49.37

10 Day Moving Average: $49.05

50 Day Moving Average: $48.70

200 Day Moving Average: $51.89

RSI: 51.7

MACD: -0.018

Yesterday, AZZ stock completed a bullish MACD crossover, one day after breaking out above its 10 & 50 day moving averages.

Their recent trading volumes have been about average compared to the year prior.

With a neutral RSI, and 5% between their 10 & 200 day moving averages, there looks to be more momentum for AZZ stock in the near-term.

They need to break through the $49.96,$50.01 & $50.73-resistance levels.

AZZ, Inc. AZZ Stock As A Long-Term Investment

Long-term oriented investors may find AZZ stock’s valuation metrics appealing, with a P/E (ttm) of 15.8 & a P/B (mrq) of 1.87.

They recently reported 2.3% Quarterly Revenue Growth Y-o-Y, with 7% Quarterly Earnings Growth Y-o-Y.

Investors may want to take a closer look into their balance sheet, with $20.36M in Total Cash (mrq) & Total Debt (mrq) of $236.14M.

They offer a 1.37% dividend yield, which appears very stable as their payout ratio is 21.94%.

As a result, 91.7% of all AZZ stock’s outstanding share float is held by institutional investors.

AZZ, Inc. AZZ Stock As A Short-Term Trade Using Options

Traders who are focused on the near-term can trade options in order to profit from movements in AZZ stock’s price.

I am looking at the contracts with the 4/14 expiration date.

The $50 calls look appealing, and while there is open interest on the $55 calls, I’m not certain that they can reach that strike price by expiration.

The $50 puts also look interesting, but both expiration prices have low levels of open interest.

Tying It All Together

All-in-all, there looks to be many opportunities for traders & investors to profit from AZZ stock.

Investors will like their valuation metrics & dividend, but may want to take a closer look into their balance sheet.

Traders will like their momentum, but be disappointed by their levels of open interest.

AZZ stock is worth taking a closer look into, regardless of your trading style.

*** I DO NOT OWN SHARES OF AZZ STOCK ***

CBOE Global Markets Inc. CBOE Stock

CBOE Global Markets Inc. stock trades under the ticker CBOE & has shown recent bullishness that traders & investors should take a closer look into.

CBOE stock closed at $116.85/share on 4/1/2022.

CBOE Global Markets Inc. CBOE Stock’s Technicals Broken Down

CBOE Global Markets Inc. CBOE Stock's Technical Performance Over The Last Year

CBOE Stock Price: $116.85

10 Day Moving Average: $115.29

50 Day Moving Average: $116.93

200 Day Moving Average: $122.19

RSI: 52.04

MACD: -0.673

On Friday, CBOE stock completed a bullish MACD crossover, breaking out above its 10 day moving average, but falling just short of closing above their 50 day MA.

CBOE stock has traded on about average volume in 2022 compared to the year prior.

With a neutral RSI, they look to still have near-term bullish momentum to power them through the 50 day moving average.

Their next resistance levels to test are the $117.04, $118 & $118.98/share price levels.

CBOE Global Markets Inc. CBOE Stock As A Long-Term Investment

Long-term focused investors will like CBOE stock’s P/E (ttm) of 23.33, but may find their P/B (mrq) of 3.39 to be a bit high.

They recently reported 2.6% Quarterly Revenue Growth Y-o-Y, with 90% Quarterly Earnings Growth Y-o-Y.

CBOE stock’s balance sheet will require a closer examination, with Total Cash (mrq) of $379M & Total Debt (mrq) of $1.44B.

CBOE stock pays a 1.57% dividend yield, which appears to be safe in the future as their payout ratio is 36.6%.

83.4% of CBOE stock’s outstanding share float is owned by institutional investors.

CBOE Global Markets Inc. CBOE Stock As A Short-Term Trade Using Options

Short-term oriented traders can use options to profit from CBOE stock’s price movements, while hedging against broader market volatility.

I am looking at the contracts with the 4/14 expiration date.

The $115, $116 & $117 call options all look appealing, although their open interest levels are a bit lacking.

The $118, $119 & $120 puts are also worth taking a closer look at, but similarly are not as liquid as traders may want them to be.

However, with this Friday having an expiration date, more contracts may be written in the coming days for later expiration dates.

Tying It All Together

Overall, CBOE stock has many interesting characteristics that traders & investors will find appealing.

Investors will like their dividend yield, as well as their P/E (ttm), but may want to do a closer review of their balance sheet before making an investment.

Traders will like their current momentum, but may be disappointed by their levels of open interest on their options contracts.

CBOE stock is worth taking a closer look into, regardless of your trading style.

*** I DO NOT OWN SHARES OF CBOE STOCK ***

Verizon Communications VZ Stock Analysis

Verizon Communications stock trades under the ticker VZ & has shown recent bullishness that traders & investors should take a closer look at.

VZ stock closed at $52.12/share on 4/1/2022.

Verizon Communications VZ Stock’s Technicals Broken Down

Verizon Communications VZ Stock's Technical Performance Over The Last Year

VZ Stock Price: $52.12

10 Day Moving Average: $51.24

50 Day Moving Average: $52.81

200 Day Moving Average: $52.87

RSI: 49.8

MACD: -0.502

On Friday, VZ stock completed a bullish MACD crossover, breaking back out above its 10 day moving average, on slightly above average volume compared to the previous year.

Their RSI is still neutral, showing strength for their current momentum to continue on in the near-term.

Their next resistance tests are $52.29, $52.36 & $52.49/share price levels.

Verizon Communications VZ Stock As A Long-Term Investment

Long-term oriented investors will like VZ stock’s P/E (ttm) of 9.63, but may find their P/B (mrq) of 2.63 to be a bit rich.

They recently reported -1.8% Quarterly Revenue Growth Y-o-Y, with 0.5% Quarterly Earnings Growth Y-o-Y.

VZ stock’s balance sheet will require a more thorough review, as they have $2.92B in Total Cash (mrq), with $178.94B in Total Debt (mrq).

Moody’s most recent debt rating for VZ is Baa1, which is considered lower medium grade.

VZ stock pays a 4.98% dividend yield, which appears to be stable as their payout ratio is 47.7%.

65.33% of VZ stock’s outstanding share float is held by institutional investors.

Verizon Communications VZ Stock As A Short-Term Trade Using Options

Short-term focused traders can use options to profit from VZ stock’s price movements, while hedging against market volatility.

I am looking at the contracts with the 4/14 expiration date.

The $51, $52 & $52.50 call options all look appealing, and very liquid with solid levels of open interest.

The $53, $53.50 & $54 puts also look interesting, although they are much less liquid than the calls, signaling more broad bullish sentiment in the near-term.

Tying It All Together

All-in-all, traders & investors should take a closer look into VZ stock.

Investors will like their dividend yield & P/E (ttm), while traders will like their current momentum & the liquidity of their options contracts.

VZ stock is worth taking a closer look at, regardless of your trading style.

*** I DO NOT OWN SHARES OF VZ STOCK ***

J&J Snack Foods Corp. JJSF Stock

J&J Snack Foods Corp. stock trades under the ticker JJSF & has shown recent bullishness that traders & investors should take a closer look into.

JJSF stock closed at $158.55/share on Friday 4/1/2022.

J&J Snack Foods Corp. JJSF Stock’s Technicals Broken Down

J&J Snack Foods Corp. JJSF Stock's Technical Performance Over The Last Year

JJSF Stock Price: $158.55

10 Day Moving Average: $154.50

50 Day Moving Average: $154.85

200 Day Moving Average: $155.76

RSI: 56.4

MACD: -0.268

On Friday, JJSF stock completed a bullish MACD crossover, while breaking out above all of its major moving averages.

Their trading volume in 2022 has been about average compared to the prior year.

Given their RSI is still in the 50’s, there looks to be more short-term momentum to come in the next few weeks.

JJSF stock needs to test & pass through the $158.94, $159.23 & $159.42/share resistance levels.

J&J Snack Foods JJSF Stock As A Long-Term Investment

Long-term oriented investors may find JJSF stock’s valuation metrics to be a tad rich, with a P/E (ttm) of 45.3 & a P/B (mrq) of 3.48.

They recent reported Quarterly Earnings Growth Y-o-Y of 523.8%, with Quarterly Revenue Growth Y-o-Y of 32.2%.

JJSF stock’s balance sheet looks appealing, with Total Cash (mrq) of $273.97M & Total Debt (mrq) of $59.98M.

They offer a 1.6% dividend yield, but their payout ratio is 72.8% which signals that their yield may be unsustainable in the long-term.

77.5% of JJSF stock’s outstanding share float is held by institutional investors.

J&J Snack Foods Corp. JJSF Stock As A Short-Term Trade Using Options

Traders interested in the short-term can use options to profit from JJSF stock’s movement in any direction, while also hedging against broader market volatility.

I am looking at the contracts with the 5/20/2022 expiration date.

The $150 & $155 calls look interesting, although they are very illiquid.

There is currently no open interest on the contracts that are at or in-the-money for JJSF stock, although they could become more liquid in the coming weeks after the 4/14 expiration date passes.

Tying It All Together

Overall, JJSF stock is worth taking a closer look at for traders & investors.

Investors will like their balance sheet, but will want to research their dividend’s sustainability further.

Traders will like their current momentum, but will be disappointed in the liquidity of their options contracts.

*** I DO NOT OWN SHARES OF JJSF STOCK ***

RCM Technologies, Inc. RCMT Stock

RCM Technologies stock trades under the ticker RCMT & has shown recent bullishness that traders & investors should take a closer look into.

RCMT stock closed at $9.86/share on 3/31/2022.

RCM Technologies, Inc. RCMT Stock’s Technicals Broken Down

RCM Technologies RCMT Stock's Technical Performance Over The Last Year

RCMT Stock Price: $9.86

10 Day Moving Average: $8.50

50 Day Moving Average: $7.24

200 Day Moving Average: $6.20

RSI: 72.83

Yesterday, RCMT stock gapped up 14.92%, breaking above its 10 day moving average.

Their trading volume was far above average compared to the year prior.

RCMT stock’s RSI is approaching overbought, and their MACD line is beginning to curl over a bit, signaling that there may be some temporary dips in price as they establish a new trading range.

RCM Technologies RCMT Stock As A Long-Term Investment

Investors focused on holding their positions for the long-term will find RCMT stock’s P/E (ttm) of 30.64 to be appealing, but may balk at their P/B (mrq) of 3.66.

RCM Technologies recently reported 44.1% Quarterly Revenue Growth Y-o-Y.

Their balance sheet may require a deeper review, as they have $2.82M in Total Cash (mrq) & $12.29M in Total Debt (mrq).

RCMT stock does not offer a dividend yield.

This is likely part of why they only have 35% of their outstanding share float held by institutional investors.

RCM Technologies RCMT Stock As A Short-Term Trade Using Options

Short-term focused traders can use options to profit from RCMT stock’s price movements, while hedging against broader market volatility.

I am looking at the contracts with the 4/14 expiration date.

The $7.50 & $10 calls look interesting, although illiquid, as they have open interest levels of <100.

The $10 puts are the only ones at a strike price that is in-the-money, but they are also very illiquid.

Tying It All Together

All-in-all, RCMT stock is worth taking a closer look into for traders & investors.

Investors will find their valuation metrics appealing, but may be disappointed by their lack of a dividend yield.

Traders will like their current momentum, but be disappointed by the lack of liquidity in their options contracts.

RCMT stock is worth conducting further research on, regardless of your trading style.

*** I DO NOT OWN SHARES OF RCMT STOCK ***

Alpine Income Property Trust Inc. PINE Stock

Alpine Income Property Trust Inc. stock trades under the ticker PINE & has shown recent bullishness that traders & investors should look closer into.

PINE stock closed at $19.06/share on 3/31/2022.

Alpine Income Property Trust Inc. PINE Stock’s Technicals Broken Down

Alpine Income Property Trust Inc. PINE Stock's Technical Performance Over The Last Year

PINE Stock Price: $19.06

10 Day Moving Average: $18.74

50 Day Moving Average: $18.88

200 Day Moving Average: $18.49

RSI: 55.89

MACD: -0.034

Yesterday, PINE stock completed a bullish MACD crossover, while also breaking out over their 50 day moving average.

They have traded on average volume this past week, compared to the year prior, and their RSI is slightly overbought at 55.89.

PINE stock needs to cross through the $19.09, $19.23 & $19.42/share resistance levels.

Alpine Income Property Trust, Inc. PINE Stock As A Long-Term Investment

Investors will find PINE stock’s valuation metrics appealing, with a P/E(ttm) of 21.11 & a P/B (mrq) of 1.12.

They recently reported 75.9% Quarterly Revenue Growth Y-o-Y, with 4,363.4% Quarterly Earnings Growth Y-o-Y.

PINE stock’s balance sheet will require a closer examination, with Total Cash (mrq) of $10.95M & Total Debt (mrq) of $267.91M.

PINE stock pays a 5.4% dividend yield, which appears fairly safe as their payout ratio is 42%.

60.4% of PINE stock’s outstanding share float is owned by institutional investors.

Alpine Income Property Trust, Inc. PINE Stock As A Short-Term Trade Using Options

Traders can use options to hedge against volatility, while profiting from price movements in any direction for PINE stock.

I am looking at the contracts with the 4/14 expiration date.

The $17.50 & $20 call options look appealing, but extremely illiquid with almost no open interest.

The $20 puts are much more liquid, but still suffer from low levels of open interest.

Tying It All Together

Overall, PINE stock has many interesting characteristics that traders & investors will find appealing.

Investors will like their valuation metrics, as well as their dividend yield, but may want to do a bit of digging in their balance sheet.

Traders will like their current momentum, but will be disappointed by their low levels of open interest on their options contracts.

PINE stock is worth taking a closer look at, regardless of your trading style.

*** I DO NOT OWN SHARES OF PINE STOCK ***

Grifols, SA GRFS Stock Analysis

Grifols, SA stock trades under the ticker GRFS & has shown recent bullishness amid market volatility that traders & investors should take a closer look into.

GRFS stock closed at $11.81/share on 3/31/2022.

Grifols, SA GRFS Stock’s Technicals Broken Down

Grifols, SA GRFS Stock's Technical Performance Over The Last Year

GRFS Stock Price: $11.81

10 Day Moving Average: $10.88

50 Day Moving Average: $11.42

200 Day Moving Average: $13.25

RSI: 58.43

MACD: -0.148

Yesterday, GRFS stock completed a bullish MACD crossover, breaking out above both its 10 & 50 day moving averages.

Their RSI is 58, and yesterday’s trading volume was much higher than average compared to the last year, signaling more short-term momentum to come.

They must now test the $12.39, $12.50 & $12.83/share resistance levels.

Grifols, SA GRFS Stock As A Long-Term Investment

Long-term oriented investors will find GRFS stock’s valuation metrics appealing, with a P/E (ttm) of 36.3 & a P/B (mrq) of 1.09.

They recently reported -8.5% Quarterly Revenue Growth Y-o-Y, which may pose an issue for some investors.

GRFS stock’s balance sheet may require a closer look, with Total Cash (mrq) of $2.69B & Total Debt (mrq) of $9.32B.

They pay a 6.12% dividend yield, which may be unsustainable due to their high payout ratio.

42.8% of GRFS stock’s outstanding share float is owned by institutional investors.

Grifols, SA GRFS Stock As A Short-Term Trade Using Options

Short-term oriented traders can use options to profit from movements in GRFS stock’s price movements, while hedging against broader market volatility.

I am looking at the contracts with the 4/14 expiration date.

The $10 & $12.50 call options look appealing, although the former is relatively illiquid.

The $12.50 puts also look interesting, but have very low levels of open interest.

Tying It All Together

Overall, GRFS stock has many interesting attributes that traders & investors may like.

Investors will like their valuation metrics, but be skeptical about the strength of their dividend moving forward.

Traders will like their current momentum, but be disappointed by the lack of liquidity in their options contracts.

GRFS stock is worth taking a closer look into, regardless of your trading style.

*** I DO NOT OWN SHARES OF GRFS STOCK ***

Integra LifeSciences Holdings Corp. IART Stock

Integra LifeSciences Holdings Corp. stock trades under the ticker IART & has shown recent bullishness that traders & investors should take a closer look at.

IART closed at $66.77/share on 3/29/2022.

Integra LifeSciences Holdoings Corp. IART Stock’s Technicals Broken Down

Integra LifeSciences Holdings Corp. IART Stock's Technical Performance Over The Last Year

IART Stock Price: $66.77

10 Day Moving Average: $64.38

50 Day Moving Average: $65.54

200 Day Moving Average: $68.17

RSI: 57.6

MACD: -0.45

Yesterday, IART stock completed a bullish MACD crossover, while breaking out above its 10 day moving average.

Their trading volume was above average compared to the year prior’s volumes & their RSI is only slightly overbought, signaling more bullish momentum to come in the near-term.

They will need to break through the $67.02, $67.55 & $67.82/share resistance levels.

Integra LifeSciences Holdings Corp. IART Stock As A Long-Term Investment

Long-term oriented investors may find IART stock’s valuation metrics to be a bit rich, with a P/E (ttm) of 31.75 & a P/B (mrq) of 3.11.

They recently reported Quarterly Revenue Growth Y-o-Y of 4.3%.

IART stock’s balance sheet will require a more thorough examination, with $513.5M in Total Cash (mrq) & Total Debt (mrq) of $1.7B.

They do not offer a dividend yield.

Despite this, 95% of their outstanding share float is held by institutional investors.

Integra LifeSciences Holdings Corp. IART Stock As A Short-Term Trade Using Options

Traders can use options to profit from short-term price movements in any direction for IART stock.

I am looking at the contracts with the 4/14 expiration date.

The $65 & $70 call options look interesting, with the latter having more open interest than the former.

There is currently no open interest for any of the in or at-the-money puts, but if there were, the $70 & $75 strike prices would be areas of interest.

Tying It All Together

All-in-all, IART stock looks to have many advantages that traders & investors will be pleased with.

Their current momentum will be interesting to traders in the near-term, although they may wish for more liquid options.

Investors may think that their valuation metrics are fair given their industry, but will be disappointed by their lack of a dividend.

IART stock is worth taking a closer look into, regardless of your trading style.

*** I DO NOT OWN SHARES OF IART STOCK ***