Spectrum Brands Inc. SPB Stock Analysis

Spectrum Brands, Inc. stock trades under the ticker SPB & has recently shown bullishness that traders & investors should take a closer look at.

SPB stock closed at $90.62/share on 4/13/2022.

Spectrum Brands, Inc. SPB Stock’s Technicals Broken Down

Spectrum Brands Inc. SPB Stock's Technical Performance Over The Last Year

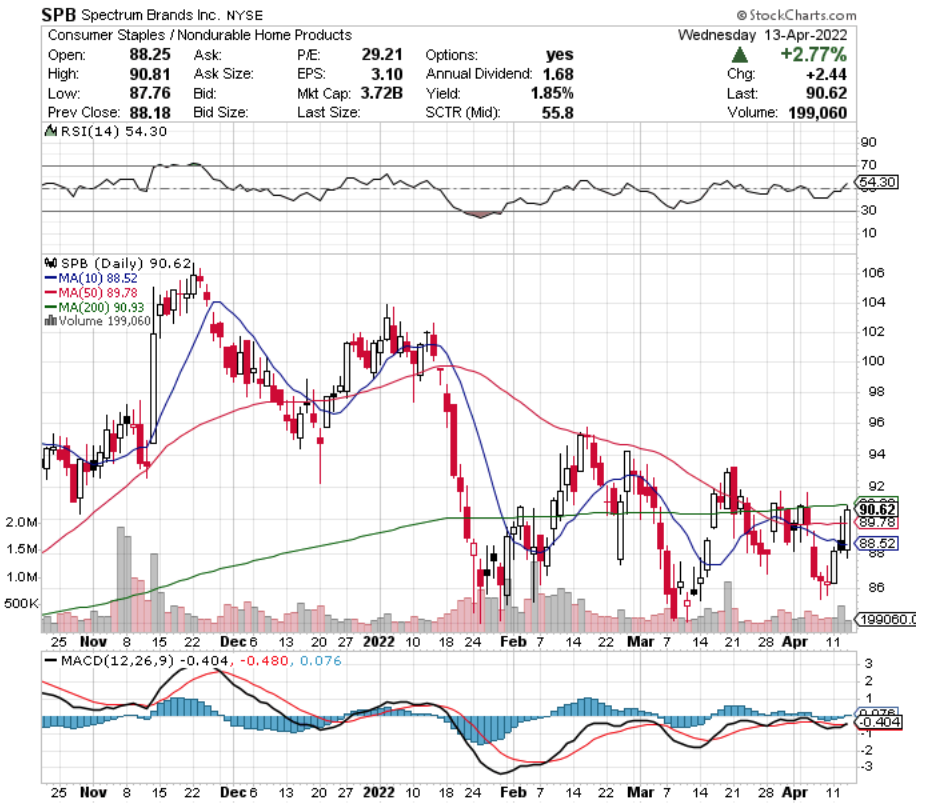
SPB Stock Price: $90.62

10 Day Moving Average: $88.52

50 Day Moving Average: $89.78

200 Day Moving Average: $90.93

RSI: 54.3

MACD: -0.404

Yesterday, SPB stock completed a bullish MACD crossover, gapping up above its 10 & 50 day moving averages, closing 1 penny shy of their 200 day MA.

Their volume in the last week has been a little bit less than average compared to the year prior.

They will need to rise above the $90.81, $91.63 & $91.74/share resistance levels.

Spectrum Brands Inc. SPB Stock As A Long-Term Investment

Long-term oriented investors will like SPB stock’s 31.55 P/E(ttm), but may find their 2.68 P/B (mrq) to be a bit higher than they like.

SPB stock reported Quarterly Revenue Growth Y-o-Y of 2.9%.

Their balance sheet will require a closer examination, with Total Cash (mrq) $204.9M & Total Debt (mrq) of $3.02B.

SPB stock pays a 1.91% dividend, and enjoys 97% of its outstanding share float being owned by institutional investors.

Spectrum Brands Inc. SPB Stock As A Short-Term Trade Using Options

Short-term oriented traders can use options to profit from price movements in SPB stock.

I am looking at the contracts with the 5/20 expiration date, which may gain open interest in the coming days, as the April contracts expire at the end of today’s trading session.

There is no open interest on the $90 calls, but there is for the $95 & $100 strike prices.

There is no open interest yet for the puts above $90 strike, but I see that changing in the coming days.

Tying It All Together

Overall, SPB stock may be appealing to investors & traders alike.

Investors will like their valuation metrics & dividend, while traders will like their current momentum.

SPB stock is worth taking a closer look at, regardless of your portfolio’s style.

*** I DO NOT OWN SHARES OF SPB STOCK AT THE TIME OF WRITING THIS ***

CVS Health Corp. CVS Stock Analysis

CVS Health Corp. stock trades under the ticker CVS & has shown recent bullish activity that traders & investors should take a closer look at.

CVS stock closed at $104.64/share on 4/12/2022.

CVS Health Corp. CVS Stock’s Technicals Broken Down

CVS Health Corp. CVS Stock's Technical Performance Over The Last Year

CVS Stock Price: $104.64

10 Day Moving Average: $102.67

50 Day Moving Average: $104.79

200 Day Moving Average: $93.32

RSI: 51.01

MACD: -0.33

Yesterday, CVS stock completed a bullish MACD crossover, although they dipped just below their 50 day moving average.

Their recent trading volume has been about average compared to the year prior, and their RSI is neutral at 51.

CVS stock must break above the $106.36, $107.52 & $107.73 resistance levels.

CVS Health Corp. CVS Stock As A Long-Term Investment

Long-term focused investors will like CVS stock’s valuation metrics, with a 17.55 P/E (ttm) & a P/B (mrq) of 1.83.

CVS stock’s balance sheet may require a closer examination by investors, as they reported $12.52B Total Cash (mrq), with $76B in Total Debt (mrq).

CVS stock pays a 1.91% dividend, which appears to be stable in the long-term as their payout ratio is 33.6%.

80% of CVS stock’s outstanding share float is held by institutional investors.

CVS Health Corp. CVS Stock As A Short-Term Trade Using Options

Short-term oriented traders can use options to profit from CVS stock’s price movements, while hedging against volatility.

I am looking at the contracts with the 5/20 expiration date.

The $100, $105 & $110 call options all look appealing, and have solid levels of open interest.

The $120, $115 & $110 puts also look good, and are liquid as well.

Tying It All Together

All-in-all CVS stock has many appealing characteristics that traders & investors will like.

Investors will like their valuation & dividend, but may want to look closer at their balance sheet structure before investing.

Traders will like their current momentum, as well as the liquidity of their options contracts.

CVS stock is worth taking a closer look at, regardless of your trading style.

*** I DO NOT OWN SHARES OF CVS STOCK AT THE TIME OF WRITING THIS ***

Ramaco Resources, Inc. METC Stock

Ramaco Resources, Inc. stock trades under the ticker METC & has shown recent bullish behavior that traders & investors should take a closer look into.

METC stock closed at $17.50/share on 4/12/2022.

Ramaco Resources, Inc. METC Stock’s Technicals Broken Down

Ramaco Resources, Inc. METC Stock's Technical Performance Over The Last Year

METC Stock Price: $17.50

10 Day Moving Average: $15.69

50 Day Moving Average: $15.97

200 Day Moving Average: $12.32

RSI: 58.3

MACD: -0.038

Yesterday, METC stock completed a bullish MACD crossover, while breaking out above its 10 & 50 day moving averages.

Their trading volume was much higher than average compared to the past year, and their RSI is still in the 50’s, signaling that there is more momentum to come in the near-term.

METC will need to break above the $18.15, $18.79 & $19.05 resistance levels.

Ramaco Resources, Inc. METC Stock As A Long-Term Investment

Investors focused on long-term positions will like METC stock’s P/E (ttm) at 28.21, but will find their P/B (mrq) of 38.59 to be a bit lofty.

METC stock recently reported 11.2% Quarterly Revenue Growth Y-o-Y, with 20.4% Quarterly Earnings Growth Y-o-Y.

Their balance sheet may warrant a closer examination, as they report $63.91B in Total Cash (mrq), but have $122.8B in Total Debt (mrq).

METC stock pays a 0.53% dividend, which appears to be very stable as their payout ratio is 14%.

59.4% of METC stock’s outstanding share float is held by institutional investors.

Ramaco Resources, Inc. METC Stock As A Short-Term Trade Using Options

Short-term oriented traders can use options to profit from METC stock’s price movements while hedging against broader market volatility.

I am looking at the contracts with the 5/20 expiration date.

The $15, $17.50 & $20 calls all look appealing, although they are not the most liquid.

The $17.50 & $20 puts also look appealing, as there is nothing else currently in or at-the-money with open interest.

Tying It All Together

Overall, METC stock has many characteristics that traders & investors will be sure to like.

Investors will like their recent growth, as well as their small, but safe dividend yield.

Traders will like their current momentum setup.

METC stock is worth taking a closer look into, regardless of your trading style.

*** I DO NOT OWN SHARES OF METC STOCK AT THE TIME OF WRITING THIS ***

RH RH Stock Analysis

RH stock trades under the ticker RH & has shown recent bullish behavior that traders & investors should take note of.

RH stock closed at $340.89/share on 4/11/2022.

RH RH Stock’s Technical Performance Broken Down

RH RH Stock's Technical Performance Over The Last Year

RH Stock Price: $340.89

10 Day Moving Average: $339.13

50 Day Moving Average: $372.87

200 Day Moving Average: $563.15

RSI: 45.99

MACD: -11.172

Yesterday, RH stock completed a bullish MACD crossover, while breaking out above its 10 day moving average.

Their trading volume has been elevated above average the last couple of weeks, when compared to the year prior.

MLR stock will need to cross through the $346.99, $358.98 & $360.10 resistance levels as it climbs higher in the near-term.

RH RH Stock As A Long-Term Investment

Long-term focused investors will like RH stock’s P/E (ttm) of 16.01, although their P/B (mrq) of 7.44 is a bit high.

They recently reported 11.1% Quarterly Revenue Growth Y-o-Y, with 12.9% Quarterly Earnings Growth Y-o-Y.

Investors may want to take a closer look into their balance sheet, with $2.18B in Total Cash (mrq) & Total Debt (mrq) of $3.43B.

RH stock does not offer a dividend yield, which may turn off some investors.

96% of RH stock’s outstanding share float is held by institutional investors.

RH RH Stock As A Short-Term Trade Using Options

RH stock has options that traders can use to profit off of their price movements in the near-term, while hedging against broader market volatility.

I am looking at the contracts with the 5/20 expiration date.

The $330, $340 & $350 calls all look appealing, and are all liquid with open interest levels of 1,587, 761 & 569.

The $360, $370 & $380 puts also look appealing, although they have much lower levels of open interest.

Tying It All Together

All-in-all, RH stock is worth taking a closer look into, regardless of your trading style.

Investors will like their valuation metrics & balance sheet, but may be disappointed by their lack of paying a dividend.

Traders will like their current momentum, as well as their open interest levels & variety of expiration dates (weekly contracts).

*** I DO NOT OWN SHARES OF RH STOCK ***

Miller Industries Inc. Stock Analysis

Miller Industries Inc. stock trades under the ticker MLR & has recently shown bullish behavior that traders & investors should take a closer look into.

MLR stock closed at $27.80/share on 4/11/2022 & has been featured in our long-term stock review section in January 2022.

Miller Industries Inc. MLR Stock’s Technicals Broken Down

Miller Industries Inc. MLR Stock's Technical Performance Over The Last Year

MLR Stock Price: $27.80

10 Day Moving Average: $27.62

50 Day Moving Average: $29.19

200 Day Moving Average: $33.43

RSI: 45.23

MACD: -0.611

Yesterday, MLR stock completed a bullish MACD crossover, while also breaking out above its 10 day moving average on above average trading volume.

With an RSI still in the 40’s, there looks to be more momentum to come in the near-term to push the share price higher.

MLR will need to break through the $28.15, $28.40 & $28.64 resistance levels.

Miller Industries Inc. MLR Stock As A Long-Term Investment

Investors will like MLR stock’s valuation metrics, with a P/E (ttm) of 18.98 & a P/B (mrq) of 1.07.

They recently reported 13.1% Quarterly Revenue Growth.

MLR stock’s balance sheet also looks appealing, with Total Cash (mrq) of $54.33M & Total Debt (mrq) of $1.25M.

Miller Industries Inc.’s stock pays a 2.67% dividend yield, which appears stable in the long-run as their payout ratio is 50%.

84% of MLR stock’s outstanding share float is held by institutional investors.

Miller Industries Inc. MLR Stock As A Short-Term Trade Using Options

Miller Industries Inc. stock has options that traders can use to profit from their price movements in the near-term.

However, their open interest levels are quite low for the next 3 month’s expiration dates.

The 6/17 expiration dated calls have the most liquidity (although still not much), with the $22.50 & $25 strike prices looking appealing.

The 5/20 dated $30 calls also look appealing, but as with the others, has very low open interest.

The 6/17 $25 puts are the only contracts that look interesting in the next few months from a puts perspective, but also are very illiquid currently.

Tying It All Together

Overall, Miller Industries Inc.’s stock has many characteristics that traders & investors will like.

Investors will say that MLR stock is a great value opportunity, with nice valuation metrics, a strong dividend & good balance sheet.

Traders will like their current technical momentum, but may be disappointed in the lack of liquidity in their options contracts.

MLR stock is worth taking a closer look into, regardless of your trading style.

*** I DO NOT OWN SHARES OF MLR STOCK AT THE TIME OF WRITING THIS ***

La Z Boy Inc. LZB Stock Analysis

La Z Boy stock trades under the ticker LZB, and has shown recent bullishness that traders & investors should take a closer look into.

LZB stock closed at $26.62/share on 4/8/2022.

La Z Boy LZB Stock’s Technicals Broken Down

La Z Boy, Inc. LZB Stock's Technical Performance Over The Last Year
La Z Boy, Inc. LZB Stock

LZB Stock Price: $26.62

10 Day Moving Average: $26.64

50 Day Moving Average: $30.11

200 Day Moving Average: $33.36

RSI: 39.99

MACD: -1.029

Yesterday, LZB stock completed a bullish MACD crossover, closing just beneath its 10 day moving average.

Their trading volume this past week has been above average, compared with the prior year’s performance, which when paired with an RSI in the high 30’s looks set to continue climbing higher in the near-term.

LZB stock will need to break through the $26.78, $26.84, $26.97 & $27.30 resistance levels as it continues climbing higher.

La Z Boy LZB Stock As A Long-Term Investment

Long-term oriented investors will like LZB stock’s valuation metrics, with a P/E (ttm) of 9.27 & a P/B (mrq) of 1.49.

They recently reported 21.6% Quarterly Revenue Growth Y-o-Y.

LZB stock’s balance sheet may require an additional detailed dive before investing, as they have reported $252.94M in Total Cash (mrq), with $411.7M Total Debt (mrq).

LZB stock pays a 2.36% dividend yield, which appears sustainable in the long run as their payout ratio is 21.4%.

La Z Boy LZB Stock As A Short-Term Trade Using Options

Short-term oriented traders can use options to profit from price movements in LZB stock, while hedging against broader market volatility.

I am looking at the contracts with the 5/20 expiration date.

The $25 & $30 calls look interesting, although rather illiquid.

The $30 puts also look appealing, but also have low levels of open interest.

Given that there is an expiration date this coming week, there should be more contracts written in the next 2 weeks, which may fix this problem & provide a wider range of strike prices to take advantage of.

Tying It All Together

All-in-all, LZB stock has many characteristics that traders & investors will both like.

Investors will like their dividend yield & valuation metrics, but may want to research their balance sheet a bit further before investing.

Traders will like their current momentum, but may be disappointed in the current liquidity of their options, until this week passes & April’s expiration date has gone by.

Overall, LZB stock is worth taking a closer look into, regardless of your trading style.

*** I DO NOT OWN SHARES OF LZB STOCK ***

Thor Industries Inc. THO Stock Analysis

Thor Industries, Inc. stock trades under the ticker THO & shown recent bullishness that traders & investors may want to further research.

THO stock closed at $81.47/share on 4/8/2022.

Thor Industries, Inc. THO Stock’s Technicals Broken Down

Thor Industries, Inc. THO Stock's Technical Performance Over The Last Year
Thor Industries, Inc. THO Stock

THO Stock Price: $81.47

10 Day Moving Average: $80.89

50 Day Moving Average: $87.59

200 Day Moving Average: $103.36

RSI: 46.33

MACD: -2.19

Yesterday, THO stock completed a bullish MACD crossover, while gapping up above its 10 day moving average.

It has traded on above average volume in the last week, compared to the year prior’s volumes, which paired with an RSI below 50 signals more strength to come in the near-term.

THO stock will have to break through the $82.24, $83.88 & $84.70 resistance points as it marches higher.

Thor Industries, Inc. THO Stock As A Long-Term Investment

Long-term oriented investors will like THO stock’s valuation metrics, with a P/E (ttm) of 4.87 & a P/B (mrq) of 1.37.

THO stock recently reported 42.1% Quarterly Revenue Growth Y-o-Y, with 101.1% Quarterly Earnings Growth Y-o-Y.

Investors may want to do a thorough review of their balance sheet before making an investment, as they have $305.24M in Total Cash (mrq), with Total Debt (mrq) of $2.23B.

THO stock pays a 2.12% dividend yield, which appears to be sustainable in the long-term with a 10.15% payout ratio.

98.5% of THO stock’s outstanding share float is owned by institutional investors.

Thor Industries, Inc. THO Stock As A Short-Term Trade Using Options

Short-term focused traders can use options to profit from movements in THO stock’s price, while also protecting themselves from broader market volatility.

I am looking at the contracts with the 4/14 expiration date.

The $75, $80 & $85 call options all look appealing, although slightly illiquid, as there’s only 574 outstanding contracts between all 3 of the strike prices.

The $85, $90 & $95 puts also look interesting, although the $85 strike price is the most liquid of the three, with 1,056 open contracts.

Tying It All Together

Overall, THO stock is worth taking a closer look into to see if it fits with your portfolio management style.

Investors will find their dividend & valuation metrics appealing, but may want to look deeper into their debt structure.

Traders will like their current momentum, but may be disappointed at the liquidity of their options.

THO stock is worth taking a closer look into, regardless of your trading style.

*** I DO NOT OWN SHARES OF THO STOCK ***

Consumer Portfolio Services, Inc. CPSS Stock

Consumer Portfolio Services, Inc. stock trades under the ticker CPSS & has shown recent bullishness that traders & investors should research further into.

CPSS stock closed at $11.68/share on 4/8/2022.

Consumer Portfolio Services, Inc. CPSS Stock’s Technicals Broken Down

Consumer Portfolio Services, Inc. CPSS Stock's Technical Performance Over The Last Year
Consumer Portfolio Services, Inc. – CPSS Stock

CPSS Stock Price: $11.68

10 Day Moving Average: $11.03

50 Day Moving Average: $11.31

200 Day Moving Average: $8.06

RSI: 56.4

MACD: -0.024

Yesterday, CPSS stock completed a bullish MACD crossover, while bullishly breaking out above its 10 day moving average.

With an RSI of 56, there looks to be more momentum in the near-term for CPSS stock’s price to continue climbing, despite recent trading volumes being about average for the last year.

CPSS will need to test & break above the $11.84, $11.99 & $12.25-resistance levels as it continues to rise.

Consumer Portfolio Services Inc. CPSS Stock As A Long-Term Investment

Long-term oriented investors will find CPSS stock’s valuation metrics appealing, as their P/E (ttm) is 5.75 & their P/B (mrq) is 1.32.

CPSS stock recently reported 42.4% Quarterly Revenue Growth Y-o-Y, with 357.5% Quarterly Earnings Growth Y-o-Y.

Their balance sheet may be worth reviewing a bit more thoroughly before investing, as they’ve reported having Total Cash (mrq) of $29.93M & Total Debt (mrq) of $1.96B.

CPSS stock does not pay a dividend, which may be a part of why only 46.3% of their outstanding share float is held by institutional investors.

Consumer Portfolio Services, Inc. CPSS Stock As A Short-Term Trade Using Options

Short-term focused traders can use options to profit from CPSS stock’s price movements, while hedging against broader market volatility.

For the April 14th expiration date, the $5, $7.50 & $10 call options look appealing, while the $12.50 & $15 put contracts also look interesting.

The next expiration date is May 20th, which I anticipate will have more open interest after this Friday’s expiration date passes.

Tying It All Together

All-in-all, CPSS stock is worth taking a closer look into to see if it fits into your trading strategy.

Long-term focused investors will like their valuation, but may be disappointed by their lack of a dividend yield.

Short-term traders will like their current momentum, but may be disappointed by the current open interest levels on the May 20th expiration dated contracts.

CPSS stock is worth taking a closer review into, regardless of your trading style.

*** I DO NOT OWN SHARES OF CPSS STOCK ***

Evergy, Inc. EVRG Stock Analysis

Evergy, Inc. stock trades under the ticker EVRG & has shown recent bullishness that traders & investors should take a closer look into.

EVRG stock closed at $70.61/share on 4/6/2022.

Evergy, Inc. EVRG Stock’s Technicals Broken Down

Evergy, Inc. EVRG Stock's Technical Performance Over The Last Year

EVRG Stock Price: $70.61

10 Day Moving Average: $68.08

50 Day Moving Average: $64.13

200 Day Moving Average: $64.09

RSI: 79.6

Yesterday, EVRG stock continued a month & a half bullish climb from the 2022 lows of February, climbing an additional 2.21%.

Their recent trading volume has been about average compared to the prior year’s.

Their MACD is still signaling more room to climb, although their overbought RSI shows that there may be some steam blown off in the near-term, as they begin to establish a new price range.

Evergy, Inc. EVRG Stock As A Long-Term Investment

Long-term focused investors will like EVRG stock’s valuation metrics, with a P/E (ttm) of 17.86 & a P/B (mrq) of 1.7.

They recently reports Quarterly Revenue Growth Y-o-Y of 2.5%, with Quarterly Earnings Growth Y-o-Y of 4.7%.

EVRG stock’s balance sheet will require a closer examination before investing, with $26.2M in Total Cash (mrq) & $11.3B in Total Debt (mrq).

ERVG stock pays a 3.15% dividend, which appears to be stable as their payout ratio is 56%.

As a result, 93.7% of EVRG stock’s outstanding share float is held by institutional investors.

Evergy, Inc. EVRG Stock As A Short-Term Trade Using Options

Short-term oriented traders can use options to profit from movements in EVRG stock’s share price.

I am looking at the contracts with the 4/14 expiration date.

The $65 & $70 calls look appealing, although they have combined open interest of ~600 between both strike prices.

The $70 puts are the only strike price with liquidity that are near-the-money.

Tying It All Together

Overall, EVRG stock has many interesting characteristics that traders & investors will like.

Investors will be fond of their dividend & valuation metrics, but may be weary of their balance sheet structure.

Traders will like their current momentum, but will be disappointed in how illiquid their options contracts are compared to other names.

EVRG stock is worth taking a closer look at, regardless of your trading style.

*** I DO NOT OWN SHARES OF EVRG STOCK ***

Asure Software ASUR Stock Analysis

Asure Software stock trades under the ticker ASUR & has shown recent bullishness that traders & investors should take note of.

ASUR stock closed at $6.74/share on 4/5/2022.

Asure Software ASUR Stock’s Technicals Broken Down

Asure Software ASUR Stock's Technical Performance Over The Last Year

ASUR Stock Price: $6.74

10 Day Moving Average: $6.13

50 Day Moving Average: $6.80

200 Day Moving Average: $8.17

RSI: 56.3

MACD: -.201

Yesterday, ASUR stock completed a bullish MACD crossover, while gapping up 8.53%.

In the process, they broke above their 10 day moving average, closing just beneath their 50 day moving average.

With an RSI that is still relatively neutral, and greater than average trading volume compared to the year prior, there looks to be more momentum to be pushing their share price higher in the near-term.

They need to break out above the $7.15, $7.18 & $7.27/share resistance levels.

Asure Software ASUR Stock As A Long-Term Investment

Long-term oriented investors will like ASUR stock’s valuation metrics, with a P/E (ttm) of 38.81 & a P/B (mrq) of 0.79.

They recently reported 28.5% Quarterly Revenue Growth Y-o-Y.

ASUR stock’s balance sheet warrants a closer examination, with Total Cash (mrq) of $13.43M & $41.3M in Total Debt (mrq).

Despite not offering a dividend yield, 67% of ASUR stock’s outstanding share float is held by institutional investors.

Asure Software ASUR Stock As A Short-Term Trade Using Options

Short-term focused traders can trade options to profit from movements in ASUR stock.

I am looking at the contracts with the 4/14 expiration date.

The $5 & $7.50 calls look interesting, although very illiquid.

There are no puts that are close to being at the money at this time for the next three expiration dates.

Tying It All Together

Overall, traders & investors may want to take a closer look at ASUR stock.

Investors will like theri valuation metrics, but will be disappointed by their lack of a dividend yield.

Traders will like their current momentum, but will be disappointed by their lack of liquidity in their contracts.

ASUR stock is worth taking a closer look at, regardless of your trading style.

*** I DO NOT OWN SHARES OF ASUR STOCK ***