Tyson Foods Inc. TSN Stock Analysis

Tyson Foods Inc. stock trades under the ticker TSN & has shown recent bullishness that traders & investors should take a closer look into.

TSN stock closed at $88.82/share on 3/29/2022.

Tyson Foods Inc. TSN Stock’s Technicals Broken Down

Tyson Foods Inc. TSN Stock's Technical Performance Over The Last Year

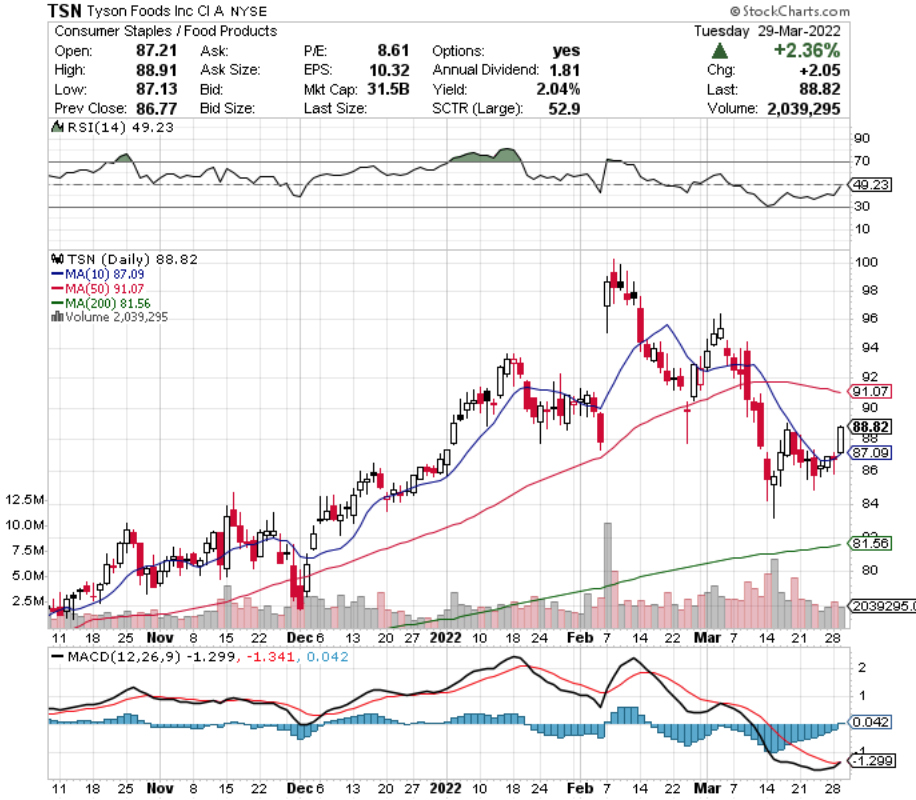
TSN Stock Price: $88.82

10 Day Moving Average: $87.09

50 Day Moving Average: $91.07

200 Day Moving Average: $81.56

RSI: 49.23

MACD: -1.299

Yesterday, TSN stock completed a bullish MACD crossover, while also breaking out above its 10 day moving average.

Their RSI is neutral at 49, and their average volume in 2022 has been greater than their average for the year prior.

TSN stock will need to test the $89.09, $89.15 & $89.50/share resistance levels.

Tyson Foods Inc. TSN Stock As A Long-Term Investment

Long-term oriented investors will find TSN stock’s valuation metrics appealing, with a P/E (ttm) of 8.46 & a P/B (mrq) of 1.69.

TSN stock recent reported Quarterly Revenue Growth Y-o-Y of 23.6%, with 140% Quarterly Earnings Growth Y-o-Y.

Their balance sheet will require a deeper inspection, with Total Cash (mrq) of $2.96B & Total Debt (mrq) of $9.36B.

TSN stock pays a 2.1% dividend yield, which appears to be stable with a low 17.7% payout ratio.

85% of TSN stock’s outstanding share float is held by institutional investors.

Tyson Foods Inc. TSN Stock As A Short-Term Trade Using Options

Short-term focused traders can use options to profit from TSN stock’s price movement, while hedging against broader market volatility.

I am looking at the contracts with the 4/14 expiration date.

The $85, $87.50 & $90 call options all look appealing, and have sufficient levels of open interest for trading.

The $90, $92.50 & $95 puts also look interesting, with the former having the most liquidity.

Tying It All Together

Overall, there are many appealing characteristics to TSN stock.

Investors will be pleased with their dividend yield & valuation metrics, but may want to do more digging into the structure of their balance sheet.

Traders will like their momentum, as well as the liquidity of their at-the-money options contracts.

TSN stock is worth taking a closer look into, regardless of your trading style.

*** I DO NOT OWN SHARES OF TSN STOCK ***

Fox Corporation FOXA Stock Analysis

Fox Corporation stock trades under the ticker FOXA & has shown recent bullishness that traders & investors should take a closer look into.

FOXA stock opened down 2.33% to $40.26/share when I wrote this on 3/28/2022.

Fox Corporation FOXA Stock’s Technicals Broken Down

Fox Corporation FOXA Stock's Technical Performance Over The Last Year

FOXA Stock Price: $40.26

10 Day Moving Average: $40.65

50 Day Moving Average: $40.80

200 Day Moving Average: $38.55

RSI: 46.3

MACD: -0.053

On Friday, FOXA stock completed a bullish MACD crossover, while breaking out above its 50 day moving average.

FOXA stock has traded on above average volume in 2022 compared to the calendar year prior.

With an RSI that is still slightly oversold & <4% between their 10 & 50 day moving averages, there looks to be more upward momentum in the near-term.

FOXA will need to retest & break through the $41.22, $41.67 & $41.73 price levels.

Fox Corporation FOXA Stock As A Long-Term Investment

Long-term oriented investors may like FOXA stock’s valuation metrics, with a P/E (ttm) of 16.42 & a P/B (mrq) of 2.02.

They recently reported Quarterly Revenue Growth Y-o-Y of 8.7%.

FOXA stock’s balance sheet may require a closer look, as their Total Cash (mrq) is $4.26B & their Total Debt (mrq) is $8.46B.

Moody’s rating for FOXA stock’s debt is Baa2, which is considered lower medium grade.

FOXA stock pays a 1.14% dividend yield, which appears very stable as their payout ratio is 19%.

95% of FOXA stock’s share float is owned by institutional investors.

Fox Corporation FOXA Stock As A Short-Term Trade Using Options

Short-term oriented traders can use options to profit from FOXA stock’s price movements, while also hedging against broader market volatility.

I am looking at the contracts with the 4/14 expiration date.

The $39, $40 & $41 call options all look appealing, although relatively illiquid with low levels of open interest.

The $42 & $43 puts are very illiquid, but could be useful for downside protection.

Tying It All Together

All-in-all, FOXA stock looks worth taking a closer look into for both long & short-term focused market participants.

Long-term focused investors will like their valuation metrics & dividend yield, but may want to take a closer look into their balance sheet.

Short-term oriented traders will like their current momentum, but be disappointed by the lack of liquidity of their options contracts.

FOXA stock is worth doing more research on, regardless of your trading style.

*** I DO NOT OWN SHARES OF FOXA STOCK ***

Petrochina Co. PTR Stock Analysis

Petrochina Co. stock trades under the ticker PTR & has shown recent bullishness that traders & investors should take a closer look at.

PTR stock opened down 1.39% on the morning 3/28/2022 while writing this.

Petrochina Co. PTR Stock’s Technicals Broken Down

Petrochina Co. PTR Stock's Technical Performance Over The Last Year

PTR Stock Price: $51.81

10 Day Moving Average: $49.63

50 Day Moving Average: $51.48

200 Day Moving Average: $46.64

RSI:52.6

MACD: -0.309

On Friday, PTR stock completed a bullish MACD crossover, while breaking out above its 50 day moving average.

In 2022, PTR stock has been trading on higher than average volume compared to the year prior.

With ~4% between their 10 & 50 day moving averages, there looks to be additional upwards momentum for Petrochina Co. stock in the near-term.

PTR will need to break above the $52.54, $52.98 & $53.45 price levels of resistance to continue climbing higher.

Petrochina Co. PTR Stock As Long-Term Investment

Long-term oriented investors will find PTR stock’s valuation metrics appealing, as their P/E (ttm) is 7.23 & their P/B (mrq) is 0.48.

PTR stock recent reported Quarterly Revenue Growth Y-o-Y of 37.5%.

Their balance sheet may require a closer examination, as their Total Cash (mrq) is $205.01B, while their Total Debt (mrq) is $507.01B.

PTR stock’s dividend yield is 6.69%, which appears relatively stable with a 48% payout ratio.

Only 2% of PTR stock’s outstanding share float is owned by institutional investors.

Petrochina Co. PTR Stock As A Short-Term Trade Using Options

PTR stock has options that traders can use in the short-term to capitalize on their price movements in any direction.

I am looking at the contracts with the 4/14 expiration date.

The $50 & $55 calls look appealing, although somewhat illiquid with only 300-400 contracts between the two strike prices combined.

The $55 & $60 puts also look interesting, with the latter being the most liquid of the two.

Tying It All Together

Overall, PTR stock has many interesting characteristics that traders & investors may like.

Investors will find their valuation metrics & dividend yield appealing, but may want to do more research into the structure of their balance sheet & debt.

Traders will like their current momentum, but may be disappointed by the liquidity of their options contracts.

PTR stock is worth taking a closer look into, regardless of your trading style.

*** I DO NOT OWN SHARES OF PTR STOCK ***

British American Tobacco PLC BTI Stock

British American Tobacco PLC stock trades under the ticker BTI & has shown recent bullishness that traders & investors should take a closer look at.

BTI stock closed at $42.41/share on 3/22/2022.

British American Tobacco PLC BTI Stock’s Technicals Broken Down

British American Tobacco PLC BTI Stock's Technical Performance Over The Last Year

BTI Stock Price: $42.41

10 Day Moving Average: $40.98

50 Day Moving Average: $43.01

200 Day Moving Average: $37.58

RSI: 51.66

MACD: -0.533

BTI stock completed a bullish MACD crossover today, while approaching its 50 day moving average.

With a neutral RSI & ~2.5% separating BTI’s 10 & 50 day moving averages, there looks to be more positive momentum in the near-term.

They will need to test & break above the $42.85, $43.55 & $43.67 price levels in the meantime.

British American Tobacco PLC BTI Stock As A Long-Term Investment

Long-term oriented investors will find BTI stock’s valuation metrics appealing, with a P/E (ttm) of 10.23 & a P/B (mrq) of 1.03.

They recently reported Quarterly Earnings Growth Y-o-Y of 20.7%.

BTI stock’s balance sheet will require a closer review though, with Total Cash (mrq) of $3.26B & Total Debt (mrq) of $39.66B.

Moody’s most recent credit rating for BTI stock is Baa2, which is considered lower medium grade.

BTI stock pays a 5.15% dividend yield, which has a high payout ratio of 73.62%, which may indicate that it will not be sustainable in the long-run.

Only 6.52% of BTI stock’s outstanding share float is held by institutional investors.

British America Tobacco PLC BTI Stock As A Short-Term Trade Using Options

Short-term oriented traders can use options to profit from BTI stock’s price movements, while hedging against broader market volatility.

I am looking at the contracts with the 4/14 expiration date.

The $35, $40 & $45 call options all look appealing, although the $35’s are very illiquid & the $45’s only have 650 open contracts.

The $45 & $50 puts also look interesting, but are also highly illiquid, signaling that in the near-term the market sentiment for BTI stock is bullish.

Tying It All Together

Overall, BTI stock has many interesting characteristics that traders & investors will like.

Investors will like their valuation metrics & dividend, but will need to keep an eye out on how sustainable their yield is in the long-run.

Traders will like their current momentum, but may wish that there was more open interest at many of their strike prices.

BTI stock is worth taking a closer look at, regardless of your trading style.

*** I DO NOT OWN SHARES OF BTI STOCK ***

BP Amoco PLC BP Stock Analysis

BP Amoco PLC stock trades under the ticker BP & has shown recent bullishness that traders & investors should take a closer look into.

BP closed at $29.80/share on 3/21/2022.

BP Amoco PLC BP Stock’s Technicals Broken Down

BP Amoco PLC BP Stock's Technical Performance Over The Last Year

BP Stock Price: $29.80

10 Day Moving Average: $28.82

50 Day Moving Average: $30.54

200 Day Moving Average: $27.10

RSI: 51.65

MACD: -0.478

BP stock completed a bullish MACD crossover today, rising above its 10 Day Moving Average.

With 6% separating their 10 & 50 Day Moving Averages & the price in between, there looks to be more momentum in the near-term.

Their just above neutral RSI & higher than average trading volumes in 2022 vs. the year prior will also help.

They will need to break above the $29.95, $30.33 & $30.75 resistance levels.

BP Amoco PLC BP Stock As A Long-Term Investment

Long-term oriented investors will find BP stock’s valuation metrics appealing, with a P/E (ttm) of 6.16 & a P/B (mrq) of 1.22.

They recently reports Quarterly Revenue Growth Y-o-Y of 83%, with Quarterly Earnings Growth Y-o-Y of 71.3%.

Their balance sheet may require a closer review though, with $30.96B in Total Cash (mrq) & $69.79B in Total Debt (mrq).

BP stock pays a 4.55% dividend yield, which appears safe with a payout ratio of 46.3%.

Only 9.8% of BP stock’s outstanding share float is held by institutional investors.

Their most recent debt rating from Moody’s was A2, which is considered to be upper medium grade.

BP Amoco PLC BP Stock As A Short-Term Trade Using Options

BP stock has options that you can trade to profit from price movements in any direction.

I am looking at the contracts with the 4/14 expiration date.

The $29 & $30 calls look interesting, and very liquid.

The $33 & $32 puts also look interesting, and are also fairly liquid as well.

Tying It All Together

Overall, BP stock is worth taking a closer look at, regardless of your trading style.

Investors will find their fundamentals appealing, but may want to look closer into their balance sheet.

Traders will like their current momentum, as well as the liquidity of their options.

*** I DO NOT OWN SHARES OF BP STOCK ***

Popular, Inc. BPOP Stock Analysis

Popular, Inc. stock trades under the ticker BPOP & has shown recent bullishness that traders & investors should take a closer look into.

BPOP closed at $84.17/share on 3/21/22.

Popular, Inc. BPOP Stock’s Technicals Broken Down

Popular, Inc. BPOP Stock's Technical Performance Over The Last Year

BPOP Stock Price: $84.17

10 Day Moving Average: $82.19

50 Day Moving Average: $88.76

200 Day Moving Average: $79.81

RSI: 47.18

MACD: -1.638

BPOP stock completed a bullish MACD crossover today, and has been trading on above average volume in 2022, compared with the year prior.

There is ~8% difference between their 10 Day Moving Average & their 50 Day Moving Average, with their share price falling midway between.

With an RSI that is still below neutral, there looks to be more momentum to come.

They will need to test & break above $86.76, $87.86 & $89.48 price levels.

Popular, Inc. BPOP Stock As A Long-Term Investment

Long-term oriented investors will find BPOP stock’s valuation metrics appealing, with a P/E (ttm) of 7.08 & a P/B (mrq) of 1.09.

They reported Quarterly Revenue Growth Y-o-Y of 17.4%, with 16.9% Quarterly Earnings Growth Y-o-Y.

BPOP stock’s balance sheet also looks appealing, with Total Cash (mrq) of $18B & Total Debt (mrq) of $1.34B.

Their most recent credit rating from Moody’s was A3, before being withdrawn.

BPOP stock pays a 2.07% dividend, with a safe payout ratio of 15.3%.

88.2% of BPOP stock’s outstanding share float is held by institutional investors.

Popular, Inc. BPOP Stock As A Short-Term Trade Using Options

Popular, Inc. stock has options that can be traded to hedge off broader market volatility.

I am looking at the contracts with the 4/14 expiration date.

The $80 & $85 calls look appealing, but relatively illiquid, with low levels of open interest.

The $100 & $95 puts also look interesting, but are less liquid.

Tying It All Together

Overall, BPOP stock has many appealing attributes for traders & investors alike.

Investors will like their fundamentals, while traders will be pleased with their current momentum, but may be disappointed by the liquidity of their options contracts.

BPOP stock is worth taking a closer look into, regardless of your trading style.

*** I DO NOT OWN SHARES OF BPOP STOCK ***

Apple Inc. AAPL Stock Analysis

Apple Inc. stock trades under the ticker AAPL & has shown recent bullishness that traders & investors should take a closer look into.

AAPL stock closed at $163.98/share on Friday 3/18/2022.

Apple Inc. AAPL Stock’s Technicals Broken Down

Apple Inc. AAPL Stock's Technical Performance Over The Last Year

AAPL Stock Price: $163.98

10 Day Moving Average: $158.28

50 Day Moving Average: $166.50

200 Day Moving Average: $154.12

RSI: 51.62

MACD: -2.476

On Friday, AAPL stock completed a bullish MACD crossover, coming within 1.5% of breaking out above its 50 Day Moving Average.

They have been trading at above average volume in the last month compared to the year prior.

With a neutral RSI, there looks to be more momentum to the upside to come in the near-term for AAPL stock.

The $165.02, $165.55 & $168.91 price levels are areas to watch for resistance as they continue climbing.

Apple Inc. AAPL Stock As A Long-Term Investment

Long-term oriented investors may find AAPL stock’s P/E (ttm) of 25.66 appealing, but will find their P/B (mrq) of 35.1 to be a bit too rich.

Their most recent reporting showed 11.2% Quarterly Revenue Growth Y-o-Y, with 20.4% Quarterly Earnings Growth Y-o-Y.

AAPL stock’s balance sheet will warrant a closer review, with $63.91B in Total Cash (mrq) & Total Debt (mrq) f $122.81B.

AAPL stock offers a modest, but safe dividend yield of 0.54%, with a 14% payout ratio.

Only 59% of AAPL stock’s outstanding share float is held by institutional investors.

Apple Inc. AAPL Stock As A Short-Term Trade Using Options

Short-term oriented traders can use options to profit from AAPL stock’s price movement in any direction.

I am looking at the contracts with the 4/14 expiration date.

The $160 & $165 call options both look appealing, and very liquid.

The $170 & $175 puts also look appealing & have high levels of open interest.

Tying It All Together

Overall, AAPL stock has many characteristics that traders & investors alike will find appealing.

Investors will find their P/E (ttm) appealing, and will appreciate their modest dividend yield.

Traders will like the liquidity of their options contracts, as well as their current path of momentum.

AAPL stock is worth taking a closer look into, regardless of your trading style.

*** I DO NOT OWN SHARES OF AAPL STOCK ***

Polo Ralph Lauren Corp. RL Stock Analysis

Polo Ralph Lauren Corp. stock trades under the ticker RL & has shown recent bullishness that traders & investors should take a closer look into.

RL stock closed at $121.40/share on Friday 3/18/2022.

Polo Ralph Lauren Corp. RL Stock’s Technicals Broken Down

Polo Ralph Lauren Corp. RL Stock's Technical Performance Over The Last Year

RL Stock Price: $121.40

10 Day Moving Average: $109.84

50 Day Moving Average: $117.52

200 Day Moving Average: $117.15

RSI: 55.05

MACD: -1.866

On Friday, RL stock completed a bullish MACD crossover, on a fourth consecutive day of gains.

RL stock has traded on above average volume in the last month compared to the rest of the prior year.

With a neutral RSI, there looks to be more momentum in the near-term for RL stock.

The next resistance levels I am watching are $122.82, $123.26 & $128.88.

Ralph Lauren Corp. RL Stock As A Long-Term Investment

Long-term oriented investors may find RL stock’s valuation metrics appealing, with a P/E (ttm) of 16.12 & a P/B (mrq) of 2.81.

Their most recent reports show 26.7% Quarterly Revenue Growth Y-o-Y, with 81.7% Quarterly Earnings Growth Y-o-Y.

RL stock’s balance sheet looks healthy but should be reviewed before investing, with Total Cash (mrq) of $2.99B & $3.44B in Total Debt (mrq).

RL stock offers a 1.73% dividend yield, which appears safe in the long-term with a 30.92% payout ratio.

Ralph Lauren Corp. RL Stock As A Short-Term Trade Using Options

Short-term oriented traders can use options to capture profits from RL stock’s movement in any directions amid broader market volatility.

I am looking at the contracts with the 4/14 expiration date.

The $120 & $125 call options look interesting, although their open interest levels are a bit low.

The $130 & $135 puts also look appealing, but they are even less liquid.

Tying It All Together

Overall, RL stock offers many unique attributes that traders & investors are sure to like.

Investors will like their valuation, dividend & balance sheet, while traders will like their current momentum rates.

RL stock is worth taking a closer look into, regardless of your trading style.

*** I DO NOT OWN SHARES OF RL STOCK ***

Blackstone Group Inc. BX Stock Analysis

Blackstone Group Inc. stock trades under the ticker BX & has shown recent bullishness that traders & investors should research further.

BX stock closed at $122.85/share on 3/18/2022.

Blackstone Group Inc. BX Stock’s Technicals Broken Down

Blackstone Group Inc. BX Stock's Technical Performance Over The Last Year

BX Stock Price: $122.85

10 Day Moving Average: $114.40

50 Day Moving Average: $120.45

200 Day Moving Average: $118.65

RSI: 53.23

MACD: -1.921

On Friday, BX stock completed a bullish MACD crossover, while breaking out above their 50 Day Moving Average.

With a neutral RSI & less than 2% between their 10 & 50 day moving averages, there looks to be more upwards momentum in the near-term for BX.

Their next resistance levels will be $123.84 & $124.99/share.

Blackstone Group Inc. BX Stock As A Long-Term Investment

Long-term oriented investors will find BX stock’s P/E (ttm) of 14.27 to be appealing, but may find their P/B (mrq) of 8.63 to be a bit rich.

Their most recent reporting showed 51.7% Quarterly Revenue Growth Y-o-Y, with 86.7% Quarterly Earnings Growth Y-o-Y.

BX stock’s balance sheet may require a closer examination, with Total Cash (mrq) of $2.27B & Total Debt (mrq) of $8.86B.

They offer a 3.39% dividend yield, which looks safe in the long-run given their 43.19% payout ratio.

~64% of BX stock’s outstanding share float is held by institutional investors.

Blackstone Group Inc. BX Stock As A Short-Term Trade Using Options

Short-term oriented traders can use options to profit from BX stock’s price movements in any direction.

I am looking at the contracts with the 4/14 expiration date.

The $123 & $124 calls look appealing, but are not particularly liquid; however this may change as Friday was March’s expiration date.

The $125 & $126 puts also look appealing, but have similar limited levels of open interest.

Tying It All Together

All-in-all, investors & traders will find lots of things to like about BX stock.

Investors will find their dividend appealing, as well as their P/E; however they may want to look deeper into their balance sheet before investing.

Traders will like their current momentum path, but may be disappointed by their options’ open interest levels.

BX stock is worth taking a closer look at, regardless of your trading style.

*** I DO NOT OWN SHARES OF BX STOCK ***

Sealed Air Corp. SEE Stock Analysis

Sealed Air Corp. stock trades under the ticker SEE & has shown recent bullishness that traders & investors should take a closer look into.

SEE stock closed at $66.70/share on 3/15/2022.

Sealed Air Corp. SEE Stock’s Technicals Broken Down

SEE Stock Price: $66.70

10 Day Moving Average: $64.71

50 Day Moving Average: $66.00

200 Day Moving Average: $61.06

RSI: 53.8

MACD: -0.26

Yesterday, SEE stock completed a bullish MACD crossover, while breaking out above its 50 day moving average, trading at about average volume compared to the year prior.

With a neutral RSI & 2% between their 10 & 50 Day Moving Averages, SEE stock looks to have more momentum to come to the upside in the near-term.

Their next tests will be at the $67.25, $67.42 & $67.72.

Sealed Air Corp. SEE Stock As A Long-Term Investment

Long-term oriented investors may like SEE stock’s P/E (ttm) of 21.26, but will likely find their P/B (mrq) of 40.78 to be very high.

SEE stock’s most recent reporting showed 14.2% Quarterly Revenue Growth Y-o-Y, with 27.2% Quarterly Earnings Growth Y-o-Y.

Their balance sheet will require a closer inspection, with $561M in Total Cash (mrq) & Total Debt (mrq) of $3.77B.

Moody’s rates SEE stock’s credit at Ba1, which is the top grade of speculative/junk ratings.

SEE stock offers a 1.15% dividend yield, which appears to be safe in the long-run, with their 24% payout ratio.

92.5% of SEE stock’s outstanding share float is held by institutional investors.

Sealed Air Corp. SEE Stock As A Short-Term Trade Using Options

Traders who are focused on the near-term can use options to profit from SEE stock’s price movements in any direction, while hedging against market volatility.

I am looking at the contracts with the 4/14 expiration date.

The $65 & $70 call options look appealing, with the former having more liquidity.

The $70 & $75 puts also look interesting, but are much less liquid, with very low levels of open interest.

More contracts should be written in the coming days, as Friday of this week is March’s expiration date.

Tying It All Together

All-in-all, SEE stock has many opportunities that investors & traders will both like.

Investors will like their dividend yield, as well as their recent growth reported in earnings.

Traders will like their current momentum, as well as the liquidity of their options once Friday’s expiration date passes.

SEE stock is worth taking a closer look into, regardless of your trading style.

*** I DO NOT OWN SHARES OF SEE STOCK ***