Mitsubishi UFJ Financial Group MUFG Stock

Mitsubishi UFJ Financial Group stock trades under the ticker MUFG & has shown recent bullishness that traders & investors should take a closer look into.

MUFG stock closed at $6.26/share on 3/15/2022.

Mitsubishi UFJ Financial Group MUFG Stock’s Technicals Broken Down

Mitsubishi UFJ Financial Group MUFG Stock's Technical Performance Over The Last Year

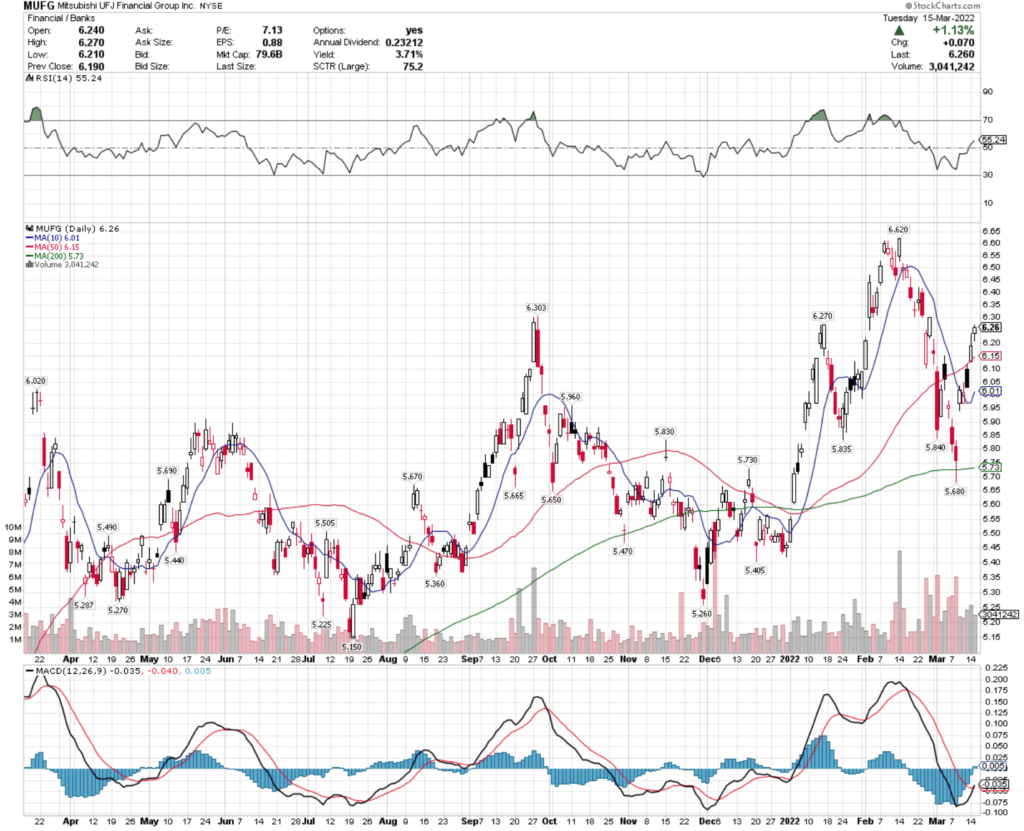
MUFG Stock Price: $6.26

10 Day Moving Average: $6.01

50 Day Moving Average: $6.15

200 Day Moving Average: $5.73

RSI: 55.24

MACD: -0.035

Yesterday, MUFG stock completed a bullish MACD crossover, as it continued a 3 day rally higher.

MUFG stock has traded on above average volume this past month, when compared to the rest of the last year.

With a neutral RSI, and 2% between the 10 & 50 day moving averages, MUFG stock looks to have more bullish momentum to come in the near-term.

I’ll be watching it at the $6.30 & $6.42 resistance levels.

Mitsubish UFJ Financial Group MUFG Stock As A Long-Term Investment

Long-term oriented investors will like MUFG stock’s valuation metrics, with a P/E (ttm) of 7.52 & a P/B (mrq) of 0.52.

Their most recent reporting showed 51.4% increase in Quarterly Revenue Growth Y-o-Y.

Their balance sheet will require a closer examination, but appears to be in good shape, with $144T in Total Cash (mrq) & Total Debt (mrq) of $91.62T.

Moody’s rates MUFG’s credit rating an A1, which is considered upper medium grade.

MUFG stock offers a 3.71% dividend yield, which appears safe given their payout ratio is 26.8%.

Despite this, only 1.8% of MUFG stock’s outstanding share float is held by institutional investors.

Mitsubishi UFJ Financial Group MUFG Stock As A Short-Term Trade Using Options

Short-term oriented traders can trade MUFG stock options to hedge against volatility, while profiting off of price movements in any direction.

I am looking at the contracts with the 4/14 expiration date.

As there is an upcoming expiration date on Friday, there is limited open interest for MUFG options on this expiration date.

However, pending their open interest levels, the $5 calls & $7.50 could be interesting, if they become liquid.

The $7.50 & $10 puts would also be appealing, if they were liquid.

Tying It All Together

Overall, MUFG stock has many attributes that traders & investors alike will find appealing.

Their valuation metrics & dividend yield will be appealing to long-term focused investors.

Short-term oriented traders will like their current momentum, but will need to watch their April dated options contracts in the coming week to see if they become more liquid.

MUFG stock is worth taking a closer look into, regardless of your trading style.

*** I DO NOT OWN SHARES OF MUFG STOCK ***

Murphy USA, Inc. MUSA Stock Analysis

Murphy USA, Inc. stock trades under the ticker MUSA & has shown recent bullishness that traders & investors should take a closer look into.

MUSA stock closed at $182.96/share on 3/14/2022.

Murphy USA, Inc. MUSA Stock’s Technicals Broken Down

Murphy USA, Inc. MUSA Stock's Technical Performance Over The Last Year

MUSA Stock Price: $182.96

10 Day Moving Average: $177.54

50 Day Moving Average: $186.15

200 Day Moving Average: $165.99

RSI: 52.91

MACD: -2.275

Yesterday, MUSA stock completed a bullish MACD crossover, while breaking out above its 10 day moving average.

Their RSI is neutral, showing that they have much more room to move to the upside before the market considers their shares to be overbought.

In 2022, MUSA stock has traded on higher than average volume compared to the year prior.

The next price levels I am watching them at are $184.47, $184.96, before the $186.22 resistance level.

Murphy USA, Inc. MUSA Stock As A Long-Term Investment

Long-term oriented investors will like MUSA stock’s P/E (ttm) at 12.15, but may find their P/B (mrq) a bit rich at 5.58.

Their most recent reporting showed 76.6% Quarterly Revenue Growth Y-o-Y, with 78.4% Quarterly Earnings Growth Y-o-Y reported.

Their balance sheet will require a closer examination though, with Total Cash (mrq) of $256.4M & Total Debt (mrq) of $2.24B.

MUSA stock pays a modest 0.59% dividend, which looks very safe as their payout ratio is only 6.97%.

85.2% of MUSA stock’s outstanding share float is held by institutional investors.

Murphy USA, Inc. MUSA Stock As A Short-Term Trade Using Options

Short-term oriented traders can use options to hedge against volatility while also capturing gains from MUSA stock’s momentum.

I am looking at the contracts with the 4/14 expiration date.

The $185 calls look appealing, although relatively illiquid, and the $180 calls would look interesting if they had open interest.

I expect there to be more contracts written in the coming days, as this Friday is an expiration date for their March options contracts.

The $195 puts have open interest, but very limited.

Tying It All Together

All-in-all, MUSA stock has many appealing characteristics that traders & investors should research further.

Investors will like their safe, yet modest dividend, as well as their valuation, but may want to do more research into the structure of their balance sheet.

Short-term traders will like their current momentum, but will want to see more liquidity in next month’s options contracts.

MUSA stock is worth taking a closer look at, regardless of your trading style.

*** I DO NOT OWN SHARES OF MUSA STOCK ***

Northwest Bancshares, Inc. NWBI Stock

Northwest Bancshares, Inc. stock trades under the ticker NWBI & has shown recent bullishness that traders & investors should take a closer look into.

NWBI stock closed at $14.23/share on 3/14/2022.

Northwest Bancshares, Inc. NWBI Stock’s Technicals Broken Down

Northwest Bancshares, Inc. NWBI Stock's Technical Performance Over The Last Year

NWBI Stock Price: $14.23

10 Day Moving Average: $13.88

50 Day Moving Average: $14.11

200 Day Moving Average: $13.43

RSI: 55.8

MACD: -0.025

Yesterday, NWBI stock completed a bullish MACD crossover, gapping up 1.57% above its 50 Day Moving Average.

NWBI shares have been trading on above average volume in 2022 compared to the previous year.

Their RSI is still neutral, showing room for more upward momentum.

The next price levels I am watching are the $14.35 & $14.52 resistance levels.

Northwest Bancshares, Inc. NWBI Stock As A Long-Term Investment

Investors focused on the long-term will find NWBI stock’s valuation metrics appealing, with a P/E (ttm) of 11.6 & a P/B (mrq) of 1.12.

Their most recent Quarterly Revenue Growth Y-o-Y was disappointing at -8.5%.

NWBI stock’s balance sheet looks appealing, with Total Cash (mrq) of $1.31B & Total Debt (mrq) of $428.21M.

Northwest Bancshares, Inc. pays a healthy 5.64% dividend, which looks fairly safe in the long-run with a payout ratio of 65.3%.

Despite this, only ~63% of their outstanding share float is held by institutional investors.

Northwest Bancshares, Inc. NWBI Stock As A Short-Term Trade Using Options

Short-term oriented traders can use options to take advantage of NWBI stock’s movement in either direction.

I am looking at the contracts with the 4/14 expiration date.

The $15 call options look appealing, and after this week’s expiration date, I expect more liquidity to be in the $12.50 strike priced contracts.

The puts that are in-the-money all have no open interest yet, but I expect that to change after this Friday & would be looking at the $17.50 & $15 contracts.

Tying It All Together

Overall, NWBI stock has many appealing attributes.

Investors will like their valuation metrics & balance sheet, but may be cautious about their dividend staying so high for a long-period of time due to their high payout ratio.

Traders will like their current momentum, but will want to see more liquidity for next month’s contracts.

NWBI stock is worth taking a closer look into, regardless of your trading style.

*** I DO NOT OWN SHARES OF NWBI STOCK ***

NetScout Systems, Inc. NTCT Stock

NetScout Systems, Inc. stock trades under the ticker NTCT, and has shown recent bullishness amid broader market volatility that traders & investors should take a closer look at.

NTCT stock closed at $31.49/share on 3/11/2022.

NetScout Systems, Inc. NTCT Stock’s Technicals Broken Down

NetScout Systems, Inc. NTCT Stock's Technical Performance Over The Last Year

NTCT Stock Price: $31.49

10 Day Moving Average: $31.08

50 Day Moving Average: $31.32

200 Day Moving Average: $29.64

RSI: 52.6

MACD: -0.065

On Friday, NTCT stock completed a bullish MACD crossover, while also breaking out bullishly above both its 10 & 50 Day Moving Averages.

Their RSI is still neutral, signaling that there is more room to move to the upside before the market thinks that they are overbought.

NTCT will need to pass through the $31.82/share mark, before testing out the $32.08 resistance level.

NetScout Systems Inc. NTCT Stock As A Long-Term Investment

Long-term oriented investors will find NTCT stock’s valuation metrics to be fair, with a P/E (ttm) of 42.4 & a P/B (mrq) of 1.13.

Their most recent filings show 14.6% Quarterly Revenue Growth Y-o-Y, with 64% Quarterly Earnings Growth Y-o-Y.

Their balance sheet looks appealing, with Total Cash (mrq) of $553.5M & Total Debt (mrq) of $417.11M.

Unfortunately, NTCT stock does not offer a dividend.

Still though, they enjoy 95.4% institutional ownership of their outstanding share float.

NetScout Systems, Inc. NTCT Stock As A Short-Term Trade Using Options

Short-term oriented traders can use options to profit from NTCT stock’s movement in either direction.

I am looking at the contracts with the 3/18 expiration date.

The $30 calls look interesting, but very illiquid, and although the $35 calls are more liquid, they require an 11% jump over the course of this week to be at-the-money.

The $35 puts also look illiquid, but look to remain in-the-money before Friday’s expiration.

Tying It All Together

Overall, NTCT stock has many attributes that traders & investors will find interesting.

Investors will like their balance sheet & valuation metrics, but will be dissuaded by their lack of a dividend yield.

Traders will like their current pace of momentum, but may be disappointed by their lack of liquidity in their near-dated contracts.

NTCT stock is worth taking a closer look into, regardless of your trading style.

*** I DO NOT OWN SHARES OF NTCT STOCK ***

Atlas Corp. ATCO Stock Analysis

Atlas Corp. stock trades under the ticker ATCO & has shown recent bullishness that traders & investors should take a closer look into during this volatile market period.

ATCO stock closed at $15.17/share on 3/10/2022.

Atlas Corp. ATCO Stock’s Technicals Broken Down

ATCO Stock Price: $15.17

10 Day Moving Average: $14.53

50 Day Moving Average: $14.63

200 Day Moving Average: $14.09

RSI: 56.6

MACD: -0.036

Yesterday, ATCO stock completed a bullish MACD crossover, a day after breaking out bullishly above its 10 & 50 day moving averages.

They have traded on above average volume the last few days compared to the year prior.

With 0.6% difference between their 10 & 50 Day Moving Averages, they look to have more momentum to come in the near-term.

I’ll be watching them around the $15.40-level, as if they break through that their next level of resistance is $15.60 & $15.80.

Atlas Corp. ATCO Stock As A Long-Term Investment

Long-term oriented investors will find ATCO stock’s valuation metrics appealing, with a P/E (ttm) of 24.23 & a P/B (mrq) of 1.05.

Their most recent reports had 18.1% Quarterly Earnings Growth Y-o-Y.

ATCO stock’s balance sheet may require a closer examination, with $288.6M in Total Cash (mrq) & Total Debt (mrq) of $6.37B.

They offer a dividend yield of 3.38%, which may not be sustainable in the long-run, as their payout ratio is currently 83.33%.

Despite this, 58% of ATCO’s total outstanding share float is held by institutional investors.

Atlas Corp. ATCO Stock As A Short-Term Trade Using Options

Short-term oriented traders can use options to profit from ATCO stock’s movements in either direction, which is especially beneficial in a volatile market.

I am looking at the contracts that expire next Friday, 3/18.

The $12.50 & $15 call options look appealing, with the latter being more liquid than the former.

The $17.50 calls have solid open interest levels, but require a 15% price increase in the next week to be at-the-money.

From the puts perspective, the $17.50 strike price contracts look appealing, although the out-pf-the-money $15 puts have more open interest.

Tying It All Together

Atlas Corp. stock is worth taking a closer look into, whether you trade for the short-term or are focused on a longer-term investment.

Investors will like their valuation metrics & their dividend yield, but may not be fond of their payout ratio & balance sheet.

Short-term traders will like their current momentum, but may find their open interest levels disappointing.

Overall, it is worth taking a closer look into ATCO stock.

*** I DO NOT OWN SHARES OF ATCO STOCK ***

Kimco Realty Corp. KIM Stock Analysis

Kimco Realty Corp. stock trades under the ticker KIM & has shown bullishness in a recently volatile market, warranting a closer look at it.

KIM stock closed at $23.93/share on 3/9/2022.

Kimco Realty Corp. KIM Stock’s Technicals Broken Down

Kimco Realty Corp. KIM Stock's Technical Performance Over The Last Year

KIM Stock Price: $23.93

10 Day Moving Average: $23.51

50 Day Moving Average: $23.96

200 Day Moving Average: $22.21

RSI: 52.7

MACD: -0.089

Yesterday, KIM stock completed a bullish MACD crossover, breaking out above both its 10 & 50 Day Moving Averages.

Their RSI is neutral, although they traded on below average volume yesterday compared to the year prior.

Despite this, I am watching them at the $24.25 resistance level, before $24.50.

Kimco Realty Corp. KIM Stock As A Long-Term Investment

Long-term oriented investors will find KIM stock’s valuation metrics appealing, with a P/E (ttm) of 15.26 & a P/B (mrq) of 1.52.

KIM stock’s most recent Quarterly Revenue Growth Y-o-Y was 57.6%.

Their balance sheet will require a closer examination, as their Total Cash (mrq) is $334.66M & their Total Debt (mrq) is $7.62B.

Moody’s rates Kimco Realty Corp.’s debt Baa1, which is considered medium grade.

KIM stock pays a 2.89% dividend yield, which appears safe as their payout ratio is 42.5%.

95.5% of KIM stock’s outstanding share float is held by institutional investors.

Kimco Realty Corp. KIM Stock As A Short-Term Trade Using Options

Traders focused on the short-term can use options to take advantage of Kimco Realty stock’s price movement in either direction.

I am looking at the contracts with the 3/18 expiration date.

The $22.50 & $25 call options look appealing, with the latter having more open interest, despite being out-of-the-money.

The $25 puts are the highest price level with liquidity, as there is no open interest at the $30 or $35 strike prices.

Tying It All Together

Kimco Realty Corp. stock is worth taking a closer look into regardless of your trading style.

Investors will like their valuation metrics & dividend yield, but would be wise to take a closer look into their balance sheet.

Traders will like their momentum in a volatile market, but may be disappointed by the liquidity of their options contracts for the nearest expiration date.

Overall, it is worth digging deeper into KIM stock.

*** I DO NOT OWN SHARES OF KIM STOCK ***

CPS Technologies Corp. CPSH Stock

CPS Technologies Corp. stock trades under the ticker CPSH & has shown recent bullishness despite broader market volatility.

CPSH closed at $4.28/share on 3/9/2022.

CPS Technologies Corp. CPSH Stock’s Technicals Broken Down

CPS Technologies Corp. CPSH Stock's Technical Performance Over The Last Year

CPSH Stock Price: $4.28

10 Day Moving Average: $3.15

50 Day Moving Average: $3.34

200 Day Moving Average: $5.12

RSI: 67.1

MACD: -0.009

Yesterday, CPSH stock completed a bullish MACD crossover, while bullishly breaking out above its 50 Day Moving Average.

Their RSI has gone through the roof over the last couple of trading days, as they have been on a bullish run, up 73%.

Due to the recent bullish run up, I do expect them to shed some price strength in the near-term as they establish a new price range.

The $4.53 price level will be where I am watching for the next large breakout to take place at.

CPS Technologies Corp. CPSH Stock As A Long-Term Investment

Long-term oriented investors will find CPSH stock’s P/E (ttm) appealing at 16.53, but they may find their P/B (mrq) of 3.48 to be a bit rich.

CPSH stock’s most recent Quarterly Revenue Growth Y-o-Y was 49.5%.

Their balance sheet looks appealing, with $5.05M in Total Cash (mrq) & only $740.6K in Total Debt (mrq).

CPSH stock does not pay a dividend, which may be off-putting to investors.

Due to this & their small cap status, only 10.9% of CPSH’s outstanding share float is held by institutional investors.

CPS Technologies Corp. CPSH Stock As A Short-Term Trade Using Options

Traders focused on the near-term can use CPSH options to take advantage of their current price movements in either direction.

I am looking at the contracts with the 3/18 expiration date.

The $2.50 calls look appealing, as the $5 contracts will need an additional 20% price gain to be at-the-money.

The $5 puts look appealing, although all of the strike prices mentioned here are low in open interest, which may be viewed unfavorably by some traders.

Tying It All Together

CPSH stock has many appealing attributes, regardless of your trading & investing style.

Long-term oriented money managers will like their valuation & balance sheet, but may be disappointed in their lack of a dividend yield.

Short-term traders will be disappointed in their low liquidity in their options contracts, but like their current path of momentum

CPSH stock is worth taking a closer look at for traders & investors of all styles.

*** I DO NOT OWN SHARES OF CPSH STOCK ***

Dynex Capital Inc. DX Stock Analysis

Dynex Capital Inc. stock trades under the ticker DX & has shown recent bullishness that traders & investors should take a closer look into.

DX stock is trading at $16.09/share as I write this on 3/9/2022.

Dynex Capital Inc. DX Stock’s Technicals Broken Down

Dynex Capital Inc. DX Stock's Technical Performance Over The Last Year

DX Stock Price: $16.09

10 Day Moving Average: $15.55

50 Day Moving Average: $16.09

200 Day Moving Average: $16.86

RSI: 55.5

MACD: -0.159

Yesterday, DX stock completed a bullish MACD crossover, and today broke out above its 50 Day Moving Average.

With a relatively neutral RSI & above average trading volumes recently, they look set to continue climbing higher in the near-term.

I will be watching them at the $16.27 & $16.53 resistance levels.

Dynex Capital Inc. DX Stock As A Long-Term Investment

Long-term oriented investors will find DX stock’s valuation metrics appealing, with a P/E (ttm) of 5.58 & a P/B (mrq) of 0.86.

DX stock’s most recent Quarterly Revenue Growth Y-o-Y was disappointing at -56.4%, and their Quarterly Earnings Growth Y-o-Y was -65.2%.

Their balance sheet will require a closer examination, with Total Cash (mrq) of $373.99M & Total Debt (mrq) of $2.85B.

Their last debt ratings from Moody’s are over a decade old, and were all in the speculative/junk range.

DX stock pays a 9.77% dividend, which appears to be relatively safe, as their payout ratio is 56%.

~42% of DX’s total outstanding share float is held by institutional investors.

Dynex Capital Inc. DX Stock As A Short-Term Trade Using Options

Short-term oriented traders can trade DX options to hedge against volatility & profit from price movements in any direction.

I am looking at the contracts with the 3/18 expiration date.

The $15 calls look appealing, as the $12.50 strike price has no open interest.

The $17.50 calls have healthy liquidity, but require a ~9% jump in 9 days to be at-the-money.

The $20 & $17.50 puts also look appealing, as the $22.50’s have no open interest.

Tying It All Together

Overall, DX stock has many interesting characteristics that traders & investors should research further.

Long-term investors will like their dividend yield & valuation metrics, but may be weary of their balance sheet.

Short-term traders will like their current momentum, but be disappointed by their open interest levels on many of the strike price levels of their options contracts.

DX stock is worth taking a closer look into, regardless of your trading style.

*** I DO NOT OWN SHARES OF DX STOCK ***

NRG Energy Inc. NRG Stock Analysis

NRG Energy Inc. stock trades under the ticker NRG & has shown recent bullishness that traders & investors may be interested in a taking a closer look at.

NRG stock is currently $37.69 as I write this on 3/9/2022.

NRG Energy Inc. NRG Stock’s Technicals Broken Down

NRG Energy Inc. NRG Stock's Technical Performance Over The Last Year

NRG Stock Price: $37.69

10 Day Moving Average: $37.64

50 Day Moving Average: $39.47

200 Day Moving Average: $39.38

RSI: 45.48

MACD: -0.524

Yesterday, NRG stock completed a bullish MACD crossover, while breaking out above its 10 Day Moving Average bullishly today.

They have traded on slightly above average volume in 2022 compared to the year prior, but will have to pass a test of their 50 Day Moving Average bearishly approaching their 200 Day MA (should happen in the next day or two).

How that impacts their near term prices will dictate their near-term price movement, but with an RSI that is already below neutral, there looks to be opportunity for their price to continue higher.

I will be watching their price as it approaches $38.50, as it has only traded above that level twice in the last month or so.

NRG Energy Inc. NRG Stock As A Long-Term Investment

Investors focused on the long-term will like NRG stock’s P/E (ttm) at 4.23, but may find their P/B (mrq) of 2.54 to be a bit rich.

Their recent Quarterly Revenue Growth Y-o-Y was 247.6%.

NRG stock’s balance sheet will need a closer review, with Total Cash (mrq) of $250M, with Total Debt (mrq) of $8.29B.

Moody’s rates NRG Energy Inc.’s debt Ba1, which is the top rating given to speculative, or “junk” debt.

NRG stock’s dividend is 3.54%, which looks fairly safe as their payout ratio is 14.6%.

Despite their speculative debt rating, NRG stock is primarily held by institutional investors.

NRG Energy Inc. NRG Stock As A Short-Term Trade Using Options

Traders interested in the short-term horizon can trade options to take advantage of NRG stock’s price movements.

I am looking at the contracts with the 3/18 expiration date.

The $36 & $37 call options look appealing, but have low open interest.

The $39 & $40 puts also look appealing, and are more liquid than the calls I mentioned above, showing that in the near-term traders see this stock staying below $39.

Tying It All Together

NRG stock has many appealing characteristics to investors, such as their dividend, their valuation metrics & their institutional ownership.

However, their debt will require a closer examination.

Traders will like their current momentum, although they may not like how liquid their options are.

While their open interest levels suggest that most traders see the stock staying below $39 for the next 9 days, NRG stock still has bullish momentum in the near-term.

Overall, it is worth taking a closer look into NRG stock.

*** I DO NOT OWN SHARES OF NRG STOCK ***

Capital Product Partners LP CPLP Stock

Capital Product Partners L.P. stock trades under the ticker CPLP & has shown recent bullishness that traders & investors may want to take a closer look into during this volatile time.

CPLP is trading at $15.57/share at the time of writing this on 3/9/2022.

Capital Product Partners L.P. CPLP Stock’s Technicals Broken Down

Capital Product Partners L.P. CPLP Stock's Technical Performance Over The Last Year

CPLP Stock Price: $15.57

10 Day Moving Average: $15.13

50 Day Moving Average: $15.56

200 Day Moving Average: $13.66

RSI: 53.6

MACD: -0.137

Yesterday, CPLP stock completed a bullish MACD crossover, and today has broken out bullishly above its 50 Day Moving Average.

With 3% between their 10 & 50 Day Moving Averages, there looks to be more bullish momentum behind their price movement in the coming days.

CPLP’s RSI is also neutral, which signals that there is more room to climb in the near-term, and their recent trading volumes have been relatively average when compared to the year prior.

They will have to test the $15.72 level before the $15.97/share resistance level in the coming days.

Capital Product Partners L.P. CPLP Stock As A Long-Term Investment

Long-term oriented investors will find CPLP’s valuation metrics appealing, with a P/E (ttm) of 2.99 & a P/B (mrq) of 0.57.

CPLP stock has 81% Quarterly Revenue Growth Y-o-Y, with 450.9% Quarterly Earnings Growth Y-o-Y based on their last earnings report.

Their balance sheet is concerning though, with Total Cash (mrq) of $20.37M & Total Debt (mrq) of $1.31B, and their most recently withdrawn credit ratings from Moody’s were Highly Speculative, although improving.

CPLP stock pays a 2.94% dividend, which looks very safe given their 7.8% payout ratio.

Despite their yield, only 21.9% of their outstanding share float is held by institutional investors, likely because of their debt situation noted above.

Capital Product Partners L.P. CPLP Stock As A Short-Term Trade Using Options

Short-term oriented traders can trade options to take advantage of CPLP stock’s current momentum, while fending off broader market volatility.

I am looking at the contracts with the 3/18 expiration date.

The $12.50 & $15 calls look appealing, although both have open interest <1,000 contracts, which some traders may consider too illiquid.

The $17.50 & $20 puts also look interesting, but are even less liquid than the calls, signaling market sentiment is bullish on CPLP in the near-term.

Tying It All Together

Overall, CPLP stock has many interesting characteristics that traders & investors will like.

Investors will like their dividend yield & valuation metrics, but must be cautious about their debt situation.

Traders will like their momentum in the near-term, but may dislike how illiquid their options are.

CPLP stock is worth taking a closer look into, regardless of your trading style.

*** I DO NOT OWN SHARES OF CPLP ***