Church & Dwight Co. Inc. CHD Stock

Church & Dwight Co., Inc. stock trades under the ticker CHD & has shown recent bullish behavior that traders & investors should take a closer look into.

CHD closed at $99.20/share on 3/3/2022.

Church & Dwight Co. Inc. CHD Stock’s Technicals Broken Down

Church & Dwight Co. Inc. CHD Stock's Technical Performance Over The Last Year

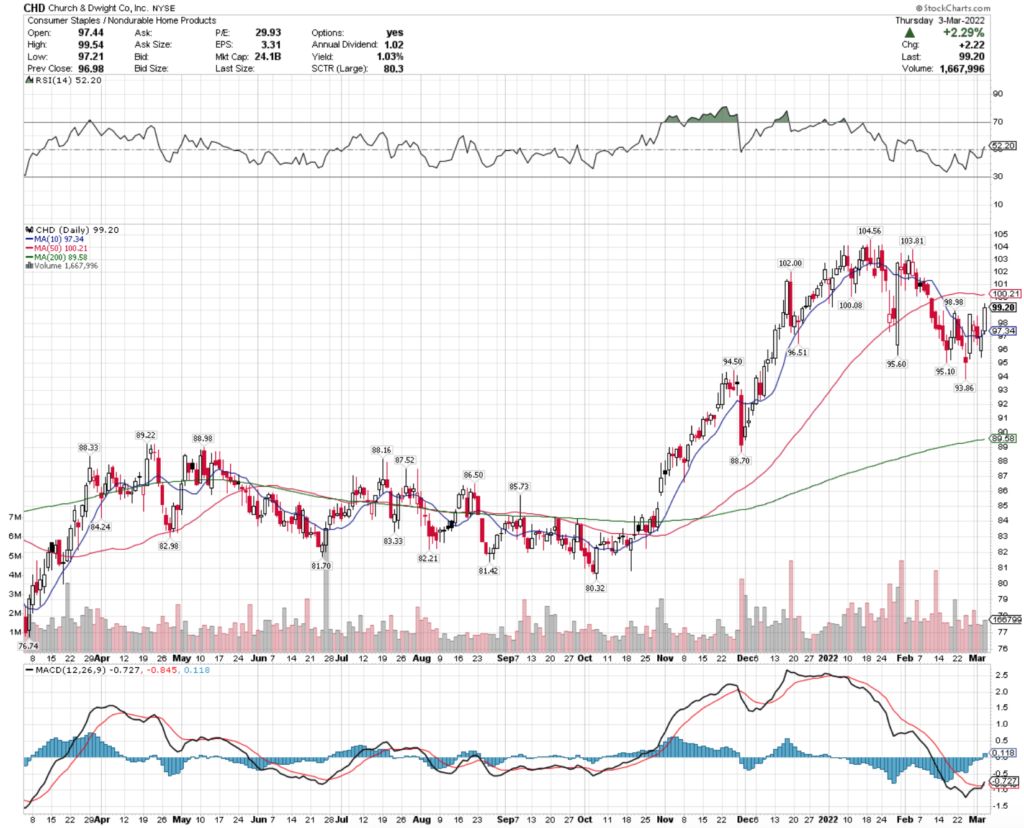
CHD Stock Price: $99.20

10 Day Moving Average: $97.34

50 Day Moving Average: $100.21

200 Day Moving Average: $89.58

RSI: 52.2

MACD: -0.727

Earlier today CHD stock completed a bullish MACD crossover, on slightly above average trading volume compared to the year prior.

It also broke out above its 10 day moving average, which leaves it 1% away from its 50 day moving average.

CHD will need to break through the $100.27 price level, before testing the $101.43/share resistance level.

Church & Dwight Co. Inc. CHD Stock As A Long-Term Investment

Long-term oriented investors will find CHD stock’s P/E (ttm) acceptable at 29.73, but will likely balk at their 7.41 P/B (mrq).

They recently had 5.7% Quarterly Revenue Growth Y-o-Y, with 5.3% Quarterly Earnings Growth Y-o-Y.

CHD stock’s balance sheet will require a closer examination, with Total Cash (mrq) of $240.6M, being eclipsed by their Total Debt (mrq) of $2.78B.

However, Moody’s has CHD stock’s credit rating at A3, which is considered upper medium grade.

CHD offers a modest 1.04% dividend yield, which appears to be safe as their payout ratio is 30.4%.

88% of CHD stock’s outstanding share float is owned by institutional investors.

Church & Dwight Co. Inc. CHD Stock As A Short-Term Trade Using Options

CHD stock has options that traders can use in the near-term to profit from their price movements in either direction.

I am looking at the contracts with the 3/18 expiration date.

The $100 & the $95 call options look appealing, although their combined open interest is only ~600 total contracts between both strike prices.

The $105 & $110 puts also look interesting, but they are even less liquid than the calls, signifying that the market still sees CHD stock being bullish in the coming weeks.

Tying It All Together

All-in-all, CHD stock has many characteristics that traders & investors alike will appreciate.

Investors will like their debt rating & dividend safety, but may find their valuation metrics to be a bit high.

Traders will like the current momentum, but balk at their lack of liquidity in the expiration date that I was looking at.

CHD stock is worth taking a closer look at, regardless of your trading style.

*** I DO NOT OWN SHARES OF CHD STOCK ***

Crane Co. CR Stock Analysis

Crane Co. stock trades under the ticker CR & has shown recent bullish momentum that traders & investors of all styles may want to take a closer look at.

CR stock closed at $104.22/share on 3/3/2022.

Crane Co. CR Stock’s Technicals Broken Down

Crane Co. CR Stock's Technical Performance Over The Last Year

CR Stock: $104.22

10 Day Moving Average: $100.92

50 Day Moving Average: $101.80

200 Day Moving Average: $97.22

RSI: 55.95

MACD: -0.024

Earlier today, CR stock completed a bullish MACD crossover, while staying above its 10 & 50 day moving averages that it broke out above the day prior.

They have traded on above average volume in 2022 compared to the year period prior.

With a neutral RSI at ~56, there looks to be a lot more momentum behind CR stock to continue pushing its price higher.

They will need to break out above $105.77, before testing the $106.57 resistance level.

Crane Co. CR Stock As A Long-Term Investment

Long-term focused investors will find CR stock’s P/E (ttm) to be appealing at 15.25, but their P/B (mrq) is a bit rich at 3.25.

They had 12.7% Quarterly Revenue Growth Y-o-Y, with 54% Quarterly Earnings Growth Y-o-Y.

CR stock’s balance sheet will warrant a deeper review, with Total Cash (mrq) of $508.6M & Total Debt (mrq) of $944.2M.

Despite this, their debt rating from Moody’s is Baa2, which is lower medium grade & above junk status.

CR stock pays a 1.65% dividend yield, which looks to be very sturdy, with a 25.8% payout ratio.

73.3% of CR stock’s outstanding share float is held by institutional investors.

Crane Co. CR Stock As A Short-Term Trade Using Options

Crane Co. stock has options that traders can use to profit on their price movement up or down in the near-term.

I am looking at the contracts with the 3/18 expiration date.

The $95, $100 & $105 call options all look interesting, although they do lack a bit in open interest.

There is no liquidity currently in any of the puts that are above $105 strike price, making that the highest reasonable strike price as of my writing this.

Tying It All Together

Overall, Crane Co. stock has many interesting attributes that traders & investors will want to look into.

Their valuation looks sturdy, and their dividend yield looks safe.

In the near-term, they have bullish momentum, although their 3/18 options contracts could be a bit more liquid.

CR stock is worth taking a deeper dive into, regardless of your trading strategy.

*** I DO NOT OWN SHARES OF CR STOCK ***

Kadant Inc. KAI Stock Analysis

Kadant Inc. stock trades under the ticker KAI & has shown recent bullishness that traders & investors should take a closer look into.

KAI stock closed at $202.22/share on 3/3/2022.

Kadant Inc. KAI Stock’s Technicals Broken Down

Kadant Inc. KAI Stock's Technical Performance Over The Last Year

KAI Stock Price: $202.22

10 Day Moving Average: $195.31

50 Day Moving Average: $210.62

200 Day Moving Average: $203.34

RSI: 49.44

MACD: -4.52

Today, KAI stock completed a bullish MACD crossover, while breaking out above its 10 day moving average, closing just below their 200 day moving average.

With ~0.5% between their price & the 200 Day MA & a neutral RSI, KAI stock looks set to continue climbing higher on solid momentum.

They have traded at above average volume levels since the beginning of 2022 compared to the year prior.

They will need to break out above $204.50’s resistance level, before testing $209.89.

Kadant Inc. KAI Stock As A Long-Term Investment

Long-term oriented investors will find KAI stock’s P/E (ttm) to be appropriate at 26.4, but they may find their P/B (mrq) to be a bit rich at 3.91.

Their Quarterly Revenue Growth Y-o-Y is 29.7% with 49.7% Quarterly Earnings Growth Y-o-Y.

KAI’s balance sheet will require a more detailed examination, as they have $94.2M in Total Cash (mrq), and Total Debt (mrq) of $269.5M.

They offer a modest 0.51% dividend yield, which appears to be very safe as their payout ratio is only 13%.

97.9% of KAI stock’s total outstanding share float is owned by institutional investors.

Kadant Inc. KAI Stock As A Short-Term Trade Using Options

Traders can use options to take advantage of KAI stock’s current momentum, while also hedging against volatility in the broader markets.

I am looking at the contracts with the 3/18 expiration date.

The $180 & $200 calls are the only ones with open interest, and both are extremely illiquid with under 10 contracts at each strike price.

For puts, only the $200 & $195 strike priced contracts have open interest, with 1 contract per strike price.

Tying It All Together

Overall, KAI stock has many interesting attributes that traders & investors are sure to be interested in learning more about.

They offer a modest, but very secure dividend yield, and have fair valuation metrics, which likely explains the extremely high levels of institutional ownership.

Traders with a short-term focus will like their current momentum pace, but may be disappointed at how illiquid their options are for the 3/18 expiration date.

KAI stock is worth taking a closer look into, regardless of your trading style.

*** I DO NOT OWN SHARES OF KAI STOCK ***

Hormel Foods Corp. HRL Stock Analysis

Hormel Foods Corp. stock trades under the ticker HRL & has shown recent bullishness that traders & investors should take note of.

HRL stock closed at $47.70/share on 2/23/2022.

Hormel Foods Corp. HRL Stock’s Technicals Broken Down

Hormel Foods Corp. HRL Stock's Technical Performance Over The Last Year

HRL Stock Price: $47.70

10 Day Moving Average: $47.50

50 Day Moving Average: $48.09

200 Day Moving Average: $45.40

RSI: 51.11

MACD: -0.081

Yesterday, HRL stock completed a bullish MACD crossover, on about average volume compared to the last year, while also breaking out above their 10 Day Moving Average.

Their next level of resistance is $48.09, followed by $48.13.

With a neutral RSI, HRL stock looks poised to continue climbing higher in the near-term.

Hormel Foods Corp. HRL Stock As A Long-Term Investment

Long-term oriented investors will like HRL stock’s valuation metrics, with a P/E (ttm) of 28.6 & a P/B (mrq) of 3.69.

HRL stock’s Quarterly Revenue Growth Y-o-Y is 42.8%, with 20.2% Quarterly Earnings Growth Y-o-Y.

Their balance sheet will require a further inspection though, with Total Cash (mrq) of $634.7M & Total Debt (mrq) of $3.4B.

They offer a 2.06% dividend yield, which looks relatively safe with a 59% payout ratio.

Only 42% of HRL stock’s outstanding share float is held by institutional investors.

Hormel Foods Corp. HRL Stock As A Short-Term Trade Using Options

Short-term oriented traders can use options to take advantage of HRL stock’s momentum, while hedging against broader market volatility.

I am looking at the contracts with the 3/18 expiration date.

The $47 & $48 call options look interesting, although their open interest levels are mediocre.

The $49 & $50 puts also look appealing, but are much less liquid than the calls, which signals that there is more bullish than bearish sentiment for HRL.

Tying It All Together

Overall, HRL stock has many attributes that traders & investors will find interesting.

Investors will like their dividend yield, as well as their valuation metrics.

Traders will like their momentum, but may be disappointed by the liquidity of their options contracts.

HRL stock is worth taking a closer look into, regardless of your trading style.

*** I DO NOT OWN SHARES OF HRL STOCK ***

The J.M. Smucker Co. SJM Stock Analysis

J.M. Smucker Co. stock trades under the ticker SJM & has shown recent bullishness that traders & investors should take a closer look into.

SJM stock closed at $138.99/share on 2/18/2022.

J.M. Smucker Co. SJM Stock’s Technicals Broken Down

J.M. Smucker Co. SJM Stock's Technical Performance Over The Last Year

SJM Stock Price: $138.99

10 Day Moving Average: $136.40

50 Day Moving Average: $137.17

200 Day Moving Average: $128.84

RSI: 54.66

MACD: -0.119

On Friday, SJM completed a bullish MACD crossover, while trading on just below average volume for the year prior.

With a neutral RSI & <0.5% between their 10 & 50 Day Moving Averages looks set to continue to the bullish charge & push SJM stock higher.

SJM stock’s next text of resistance will be at $139.70, followed by $140.73.

J.M. Smucker Co. SJM Stock As A Long-Term Investment

Investors will find SJM stock’s P/E (ttm) to be fair at 27.74, although their P/B (mrq) is a bit rich at 37.96.

SJM had Quarterly Revenue Growth Y-o-Y of 11.2%, with 20.4% Quarterly Earnings Growth Y-o-Y.

Their balance sheet will require a closer examination, with Total Cash (mrq) of $63.91B & Total Debt (mrq) of $122.8B.

SJM offers a 2.85% dividend yield, which looks safe, despite their payout ratio being 52%.

60% of SJM stock’s outstanding share float is held by institutional investors.

J.M. Smucker SJM Stock As A Short-Term Trade Using Options

SJM stock has options that traders can use to profit from short-term price fluctuations in either direction.

I am looking at the contracts with the 3/18 expiration date.

The $130, $135 & $140 call options all look appealing, although they have low open interest levels.

The $150 & $145 puts also look appealing, but very illiquid.

Tying It All Together

All-in-all, SJM stock has many characteristics that traders & investors alike will like.

Investors will like their dividend yield & valuation metrics, although they will want to look into their debt structure more closely.

Traders focused on the short-term will like their current momentum, but dislike the illiquidity of their options contracts.

SJM stock is worth taking a closer look at, regardless of your trading style.

*** I DO NOT OWN SHARES OF SJM STOCK ***

Kraft Heinz Co. KHC Stock Analysis

Kraft Heinz Co. stock trades under the ticker KHC & has shown recent bullishness that traders & investors should take a closer look into.

KHC stock closed at $37.79/share on 2/16/2022, after a 3.19% gain on Thursday.

Kraft Heinz Co. KHC Stock’s Technicals Broken Down

Kraft Heinz Co. KHC Stock's Technical Performance Over The Last Year

KHC Stock Price: $37.79

10 Day Moving Average: $35.21

50 Day Moving Average: $35.87

200 Day Moving Average: $37.37

RSI: 66.2

MACD: -0.093

Yesterday, KHC stock completed a bullish MACD crossover, after breaking out above its 10, 50 & 200 day moving averages in the last 2 days.

They have been trading on higher than average volume this week, with three straight days of gains, after having a rocky start to 2022.

Their RSI is almost overbought, which will simmer down in the coming days as they begin to establish a new trading range.

KHC’s next test of resistance is at $38.12.

Kraft Heinz Co. KHC Stock As A Long-Term Investment

Investors may find KHC stock’s P/E (ttm) to be a bit rich at 46.1, but their P/B (mrq) is modest at 0.91.

Their Quarterly Revenue Growth Y-o-Y is -3.3%

KHC stock’s balance sheet will require a closer examination, with Total Cash (mrq) of $3.44B & Total Debt (mrq) of $21.81B.

They offer a 4.37% dividend yield, which may be unsustainable in the longer run, as their payout ratio is 85.6%

Still, 79.6% of their outstanding share float is held by institutional investors.

Kraft Heinz Co. KHC Stock As A Short-Term Trade Using Options

KHC stock has options that traders can use to take advantage of their price movements in either direction.

I am looking at the contracts with the 3/18 expiration date.

The $37.50 & $40 calls both look interesting, and have open interest over 1,000+ contracts each, making them very liquid.

For puts, the $42.50 & $45 contracts look appealing, but they are very illiquid, with under 100 contracts of open interest per strike price.

Tying It All Together

Overall, there look to be a lot of appealing attributes to KHC stock.

Investors will like their valuation & dividend yield, but will want to take a deeper dive into their balance sheet to see how sustainable those yields are in the long-term.

Short-term investors will like their current momentum, as well as the liquidity levels of their options contracts.

KHC stock is worth taking a closer look into, regardless of your trading style.

*** I DO NOT OWN SHARES OF KHC STOCK ***

Regal Rexnord Corp. RRX Stock Analysis

Regal Rexnord Corp. stock trades under the ticker RRX & has shown recent bullishness that traders & investors should take a closer look into.

RRX stock closed at $161.90/share on 2/16/2022.

Regal Rexnord Corp. RRX Stock’s Technicals Broken Down

Regal Rexnord Corp. RRX Stock's Technical Performance Over The Last Year

RRX Stock Price: $161.90

10 Day Moving Average: $159.68

50 Day Moving Average: $164.23

200 Day Moving Average: $146.73

RSI: 50.3

MACD: -1.372

Yesterday, RRX stock completed a bullish MACD crossover, while trading at slightly above average volume levels for the last year.

With <3% between their 10 & 50 Day Moving Averages, there looks to be additional momentum to push their price higher in the near-term, particularly with a neutral RSI of 50.

RRX will need to break above $162.80, before testing $164.85/share.

Regal Rexnord Corp. RRX Stock As A Long-Term Investment

Long-term investors will like RRX stock’s valuation metrics, with a P/E (ttm) of 35.52 & a P/B (mrq) of 1.68.

RRX stock had 55.9% Quarterly Revenue Growth Y-o-Y, which investors will find appealing.

Their balance sheet may require a deeper review, with $672.8M it Total Cash (mrq) & $1.92B in Total Debt (mrq).

RRX stock offers a modest 0.8% dividend yield, which looks safe as their payout ratio is 29%.

82% of RRX’s outstanding share float is held by institutional investors.

Regal Rexnord Corp. RRX Stock As A Short-Term Trade Using Options

Regal Rexnord Corp. stock has options that traders can use to profit on their short-term movements in either direction.

I am looking at the contracts with the 3/18 expiration date.

The $160 & $165 call options look interesting, although highly illiquid.

The $170 puts also look appealing, but illiquid as well.

Since there is an expiration date for February tomorrow, I expect to see more contracts written in the coming week for March, but this does not look like a name that has a lot of open interest on average.

Tying It All Together

Overall, RRX stock has many unique characteristics that traders & investors will like.

Investors will like their valuation & safe dividend yield, but will want to look into their balance sheet a bit more in detail.

Traders will like their current momentum trajectory, but will be disappointed by the lack of open interest in their options contracts.

RRX stock is worth taking a closer look at to see if it matches your trading style.

*** I DO NOT OWN SHARES OF RRX STOCK ***

Lee Enterprises, Inc. LEE Stock

Lee Enterprises, Inc. stock trades under the ticker LEE & has shown recent bullishness that traders & investors should take a closer look into.

LEE stock closed at $37.17/share on 2/16/2022.

Lee Enterprises, Inc. LEE Stock’s Technicals Broken Down

Lee Enterprises, Inc. LEE Stock's Technical Performance Over The Last Year

LEE Stock Price: $37.17

10 Day Moving Average: $34.58

50 Day Moving Average: $36.03

200 Day Moving Average: $28.01

RSI: 55.67

MACD: -0.073

Yesterday, LEE stock completed a bullish MACD crossover, a day after breaking out above its 50 Day Moving Average.

With a neutral RSI, they look to be in prime position to continue climbing higher in the near-term, as there is only ~4% between their 10 & 50 Day Moving Averages.

LEE stock will need to retest the $37.50 level, before the $40.15 level of resistance.

Lee Enterprises, Inc. LEE Stock As A Long-Term Investment

Long-term oriented investors will like LEE stock’s valuation metrics, with a P/E (ttm) of 10.73 & a P/B (mrq) of 3.47.

LEE stock had -4.5% Quarterly Revenue Growth Y-o-Y, with -20.4% Quarterly Earnings Growth Y-o-Y, which investors may want to look into why these drops occurred before investing.

Their balance sheet will require a closer examination as well, with $18.59M in Total Cash (mrq) & Total Debt (mrq) of $525.79M.

LEE stock does not offer a dividend yield, which may play a part as to why only 42% of their total share float is held by institutional investors.

Tying It All Together

Investors in the long-term may be interested in LEE stock for its valuation metrics, but may want to look closer into the structure of their debt on their balance sheet.

While LEE stock does not have options, there is still opportunities in the near-to-mid term to profit from their momentum, as their share price is poised to continue climbing.

Overall, LEE stock is worth taking a closer look into, regardless of your trading strategy.

*** I DO NOT OWN SHARES OF LEE STOCK ***

Kellogg Co. K Stock Analysis

Kellogg Co. stock trades under the ticker K & has shown recent bullishness that traders & investors should take a closer look into.

K stock closed at $64.59/share on 2/15/2022.

Kellogg Co. K Stock’s Technicals Broken Down

Kellogg Co. K Stock's Technical Performance Over The Last Year

K Stock Price: $64.59

10 Day Moving Average: $63.03

50 Day Moving Average: $64.38

200 Day Moving Average: $63.30

RSI: 53.4

MACD: -0.363

Yesterday, K stock completed a bullish MACD crossover, while breaking out above its 50 Day Moving Average.

With a neutral RSI & its 10 day MA set to bullishly cross the 200 day MA, there looks to be more momentum on the horizon for K stock.

Their next test level is $65.98/share.

Kellogg Co. K Stock As A Long-Term Investment

Investors focused on long-term returns will find Kellogg stock to have many interesting characteristics.

Their P/E (ttm) looks fair at 14.95, although their P/B (mrq) is a bit rich at 5.95.

K stock’s Quarterly Revenue Growth Y-o-Y is -1.2%, with 111.2% Quarterly Earnings Growth Y-o-Y.

K stock’s balance sheet warrants a closer examination, with $286M in Total Cash (mrq) & $7.73B in Total Debt (mrq).

Their dividend yield is 3.57%, which appears safe for now with a payout ratio of 53%.

85.2% of K stock’s total share float is held by institutional investors.

Kellogg Co. K Stock As A Short-Term Trade Using Options

Kellogg stock has options that traders can use to take advantage of price movements in both directions in the near-term.

I am looking at the contracts with the 3/18 expiration date.

The $62.50 & $65 call options look appealing, as both have decent liquidity.

The $70 & $72.50 puts also look appealing, although they are less liquid, with lower open interest.

Tying It All Together

Overall, K stock has many appealing attributes that traders & investors will like.

Their valuation metrics are fair, and they also offer a nice dividend that investors will be fond of.

Traders will like their options’ open interest levels, as well as their current momentum path.

K stock is worth taking a closer look at, regardless of your portfolio structure.

*** I DO NOT OWN SHARES OF K STOCK ***

J.B. Hunt Transport Services, Inc. JBHT Stock

J.B. Hunt Transport Services Inc. stock trades under the ticker JBHT & has shown recent bullishness that traders & investors should take a closer look into.

JBHT stock closed at $193.01/share on 2/15/2022.

J.B. Hunt Transport Services, Inc. JBHT Stock’s Technicals Broken Down

J.B. Hunt Transport Services, Inc. Stock's Technical Performance Over The Last Year

JBHT Stock Price: $193.01

10 Day Moving Average: $191.51

50 Day Moving Average: $196.96

200 Day Moving Average: $180.45

RSI: 48.26

MACD: -1.791

Yesterday, JBHT stock completed a bullish MACD crossover, while also breaking out above its 10 day moving average.

2022’s trading volume so far has been above average, and their RSI is just below neutral, showing room for more momentum in the near-term.

Their next test of resistance is $197.35, followed by $201.03.

J.B. Hunt Transport Services Inc. JBHT Stock As A Long-Term Investment

Investors will find JBHT to have fair valuation metrics, with a P/E (ttm) of 26.96, although their P/B (mrq) is a bit rich at 6.49.

JBHT stock had 27.7% Quarterly Revenue Growth Y-o-Y, as well as 57.3% Quarterly Earnings Growth Y-o-Y.

Their balance sheet will require a closer examination though, with $355.55M in Total Cash (mrq) & $1.3B in Total Debt (mrq).

They offer a modest dividend of 0.61%, which looks very safe as JBHT stock’s payout ratio is 16.5%.

74.3% of JBHT stock’s outstanding share float is held by institutional investors.

J.B. Hunt Transport Services Inc. JBHT Stock As A Short-Term Trade Using Options

Short-term traders can profit from JBHT stock’s current momentum by trading options.

I am looking at the contracts with the 3/18 expiration date.

The $190 & $195 calls look interesting, although very illiquid, with low levels of open interest.

The $195 & $200 puts also look appealing, but very illiquid too.

I expect to see more contracts written after this week’s expiration date passes on Friday.

Tying It All Together

JBHT stock has many interesting characteristics that traders & investors should find appealing.

Traders will like their current trajectory of momentum, but will be looking for more liquidity in their March dated options.

Investors will like their valuation metrics, but would certainly appreciate a dividend hike.

Overall, JBHT stock is worth taking a closer look into, regardless of your trading style.

*** I DO NOT OWN SHARES OF JBHT STOCK ***