Cigna Corp. CI Stock Analysis

Cigna Corp. stock trades under the ticker CI & has shown recent bullishness that traders & investors should research further into.

CI stock closed at $256.54/share on 4/4/2023.

Cigna Corp. CI Stock’s Technical Performance Over The Past Year

Cigna Corp. CI Stock's Technical Performance Over The Past Year
Cigna Corp. CI Stock’s Technical Performance Over The Past Year

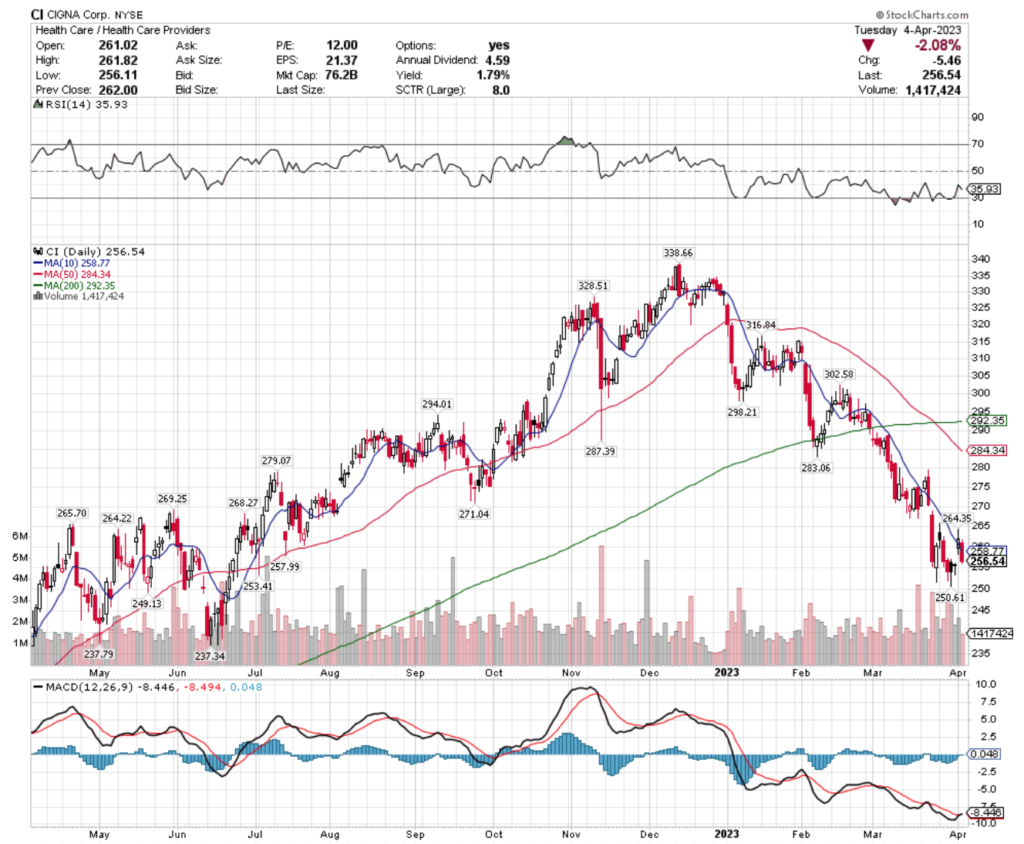
CI Stock Price: $256.54

10 Day Moving Average: $258.77

50 Day Moving Average: $284.34

200 Day Moving Average: $292.35

RSI: 35.93

MACD: -8.446

Yesterday, CI stock completed a bullish MACD crossover, losing -2.08% on the day’s session.

Their RSI is approaching oversold at 35.9 & recent trading volumes have been about average compared to the year prior, as they have steadily declined throughout Q1 2023.

CI stock has support at the $253.41, $250.61 & $249.13/share price level, as they look to break out above their $257.99, $258.77 (10 day moving average) & $264.22/share price levels.

Cigna Corp. CI Stock As A Long-Term Investment

Long-term oriented investors will like CI stock’s valuation metrics, with a 12.05 P/E (ttm) & a 1.7 P/B (mrq).

They recently reported 0% Quarterly Revenue Growth Y-o-Y, with 4.7% Quarterly Earnings Growth Y-o-Y.

Their balance sheet will require a more thorough review, with $6.76B of Total Cash (mrq) & $31.55B of Total Debt (mrq).

CI stock pays a 1.71% dividend, which appears to be sustainable in the long-run, as their payout ratio is 21.03%.

90.79% of CI stock’s outstanding share float is owned by institutional investors.

Cigna Corp. CI Stock As A Short-Term Trade Using Options

Short-term traders can use options to hedge their portfolios against volatility, while profiting from CI price movements.

I am looking at the contracts with the 5/19 expiration date.

The $250, $240 & $210 call options are all in-the-money, listed from highest to lowest level of open interest.

The $260, $270 & $280 puts are also all in-the-money, with the former being more liquid than the latter strikes.

Tying It All Together

CI stock has many interesting characteristics that traders & investors are sure to find appealing.

Investors will like their valuation metrics & dividend yield, but may want to review their balance sheet more thoroughly.

Traders will like their recent technical performance.

All-in-all, it is worth taking a closer look into CI stock to see how it fits into your portfolio strategy.

*** I DO NOT OWN SHARES OR OPTIONS CONTRACT POSITIONS IN CI STOCK AT THE TIME OF PUBLISHING THIS ARTICLE ***

PetMed Express, Inc. PETS Stock Analysis

PetMed Express, Inc. stock trades under the ticker PETS & has shown recent bullishness that traders & investors should research further into.

PETS stock closed at $16.09/share on 4/4/2023.

PetMed Express, Inc. PETS Stock’s Technical Performance Broken Down

PetMed Express, Inc. PETS Stock 's Technical Performance Over The Past Year
PetMed Express, Inc. PETS Stock ‘s Technical Performance Over The Past Year

PETS Stock Analysis: $16.09

10 Day Moving Average: $16.28

50 Day Moving Average: $18.55

200 Day Moving Average: $19.18

RSI: 39.25

MACD: -0.648

Yesterday, PETS stock completed a bullish MACD crossover, but lost -2.84% on the day’s session.

Their RSI is approaching oversold at 39 & recent trading volumes have been about average compared to the year prior, as their price has slid throughout March 2023.

PETS stock has support at the $15.09 & $12.79/share price levels, with resistance at the $16.28 (10 day moving average), $16.60 & $16.96/share price levels.

PetMed Express, Inc. PETS Stock As A Long-Term Investment

Long-term oriented investors will like PETS stock’s 29.84 P/E (ttm), but may find their 2.64 P/B (mrq) to be a bit too rich.

They recently reported -3% Quarterly Revenue Growth Y-o-Y, which may warrant a closer review.

Investors will like their balance sheet, which contains $102.43M of Total Cash (mrq) & no Total Debt (mrq).

PETS stock pays a 7.25% dividend yield, which appears to be unsustainable in the long-run & will require more research, as their payout ratio is 214.29%.

82.38% of PETS stock’s outstanding share float is owned by institutional investors.

PetMed Express, Inc. PETS Stock As A Short-Term Trade Using Options

Traders with shorter time horizons can trade options to profit from price movements in PETS stock, while hedging their portfolios from volatility.

I am looking at the contracts with the 5/19 expiration date.

The $12.50 & $15 call options are in-the-money, listed in order of highest to lowest open interest level.

The $17.50, $30 & $20 puts are also all in-the-money, with the former being more liquid than the latter strikes.

Tying It All Together

PETS stock has many interesting attributes that traders & investors will find appealing.

Investors will like their balance sheet & hefty dividend yield, but may want to research deeper into its longevity potential.

Traders will like their recent technical performance, but may wish their options were more liquid.

Overall, it is worth taking a closer look into PETS stock to see how it fits into your portfolio strategy.

*** I DO NOT OWN SHARES OR OPTIONS CONTRACT POSITIONS IN PETS STOCK AT THE TIME OF PUBLISHING THIS ARTICLE ***

Macy’s Inc. M Stock Analysis

Macy’s Inc. stock trades under the ticker M & has shown recent bullishness that traders & investors should research further into.

M stock closed at $18.80/share on 3/3/2023.

Macy’s Inc. M Stock’s Technical Performance Broken Down

Macy's Inc. M Stock's Technical Performance Over The Past Year
Macy’s Inc. M Stock’s Technical Performance Over The Past Year

M Stock Price: $18.80

10 Day Moving Average: $17.58

50 Day Moving Average: $20.76

200 Day Moving Average: $19.45

RSI: 48.82

MACD: -0.905

Yesterday, M stock completed a bullish MACD crossover, gaining +7.49% on the day’s session.

Their RSI is neutral & recent trading volumes have been about average compared to the year prior, but there is uncertainty in yesterday’s doji candlestick.

M stock has support at the $18.69, $18.42 & $18.34/share price levels, as they look to break out above the $19.12, $19.23 (2 points in last 52 weeks) & $19.45 (200 day moving average).

Macy’s Inc. M Stock As A Long-Term Investment

Long-term oriented investors will like M stock’s 3.24 P/E (ttm).

They recently reported -4.5% Quarterly Revenue Growth Y-o-Y, with -31.5% Quarterly Earnings Growth Y-o-Y, which will require a closer examination.

Their balance sheet also will require a more thorough review, with $862M of Total Cash (mrq) & $6.4B of Total Debt (mrq).

M stock pays a 3.6% dividend, which appears to be sustainable in the long-run, as their payout ratio is 15.04%.

85.67% of M stock’s outstanding share float is owned by institutional investors.

Macy’s Inc. M Stock As A Short-Term Trade Using Options

Traders with shorter time horizons can trade options to profit from M stock’s price movements, while protecting their portfolio from volatility.

I am looking at the contracts with the 5/19 expiration date.

The $18, $17 & $14 call options are all in-the-money, listed from highest to lowest level of open interest.

The $19, $20 & $23 puts are also all in-the-money, with the former being more liquid than the latter strikes.

Tying It All Together

M stock has many interesting characteristics that traders & investors are sure to find appealing.

Investors will like their dividend yield, but may want to look closer into their balance sheet & recent growth troubles.

Traders will like their liquid options & recent technical performance.

Overall, it is worth taking a closer look into how M stock fits into your portfolio strategy.

*** I DO NOT OWN SHARES OR OPTIONS CONTRACT POSITIONS IN M STOCK AT THE TIME OF PUBLISHING THIS ARTICLE ***

Patrick Industries, Inc. PATK Stock Analysis

Patrick Industries, Inc. stock trades under the ticker PATK & has shown recent bullishness that traders & investors should research further into.

PATK stock closed at $68.59/share on 4/3/2023.

Patrick Industries, Inc. PATK Stock’s Technical Performance Broken Down

Patrick Industries, Inc. PATK Stock's Technical Performance Over The Past Year
Patrick Industries, Inc. PATK Stock’s Technical Performance Over The Past Year

PATK Stock Price: $68.59

10 Day Moving Average: $67.43

50 Day Moving Average: $70.78

200 Day Moving Average: $57.81

RSI: 48.8

MACD: -0.885

Yesterday, PATK stock completed a bullish MACD crossover, losing -0.32% on the day’s session.

Their RSI is neutral, with recent trading volumes being lighter than average compared to the year prior, signaling uncertainty by the market as to where to price them.

PATK has support at the $67.43 (10 day moving average), $66.83 & $64.89/share price levels, with resistance at the $67.76, $70.78 (50 day moving average) & $70.99/share price levels.

Patrick Industries, Inc. PATK Stock As A Long-Term Investment

Long-term oriented investors will like PATK stock’s 4.95 P/E (ttm), as well as their 1.57 P/B (mrq).

Their recently reported growth metrics will require a more thorough examination, with -17% Quarterly Revenue Growth Y-o-Y & -34.2% Quarterly Earnings Growth Y-o-Y.

Their balance sheet will also require a more thorough examination, with $22.85M of Total Cash (mrq) & $1.45B of Total Debt (mrq).

PATK stock pays a 2.09% dividend, which appears to be sustainable in the long-run, as their payout ratio is 10.67%.

96.86% of PATK stock’s outstanding share float is owned by institutional investors.

Patrick Industries, Inc. PATK Stock As A Short-Term Trade Using Options

Traders with shorter time horizons can trade options to profit from PATK stock’s price movements, while protecting their portfolios from volatility.

I am looking at the contracts with the 5/19 expiration date.

The $55, $65 & $60 call options are all in-the-money, listed from highest to lowest level of open interest.

The $70 & $75 puts are also all in-the-money, with the former being more liquid than the latter strike.

Tying It All Together

PATK stock has many interesting attributes that traders & investors will find appealing.

Investors will like their valuation metrics & sustainable dividend yield, but may want to look deeper into recent growth trouble & their balance sheet.

Traders will like their recent technical performance, but may be disappointed by how liquid their options are.

Overall, it is worth taking a closer look into PATK stock to see how it fits into your portfolio strategy.

*** I DO NOT OWN SHARES OR OPTIONS CONTRACT POSITIONS IN PATK STOCK AT THE TIME OF PUBLISHING THIS ARTICLE ***

New York Times Co. NYT Stock Analysis

New York Times Co. stock trades under the ticker NYT & has shown recent bullishness that traders & investors should research further into.

NYT stock closed at $38.19/share on 3/29/2023.

New York Times Co. NYT Stock’s Technical Performance Broken Down

New York Times Co. NYT Stock's Technical Performance Over The Past Year
New York Times Co. NYT Stock’s Technical Performance Over The Past Year

NYT Stock Price: $38.19

10 Day Moving Average: $37.60

50 Day Moving Average: $37.38

200 Day Moving Average: $32.87

RSI: 54.58

MACD: -0.005

Yesterday, NYT stock completed a bullish MACD crossover, gaining +1.81% on the day’s session.

Their RSI is neutral & recent trading volumes have been about average compared to the year prior.

NYT stock has support at the $37.80, $37.60 (10 day moving average) & $37.38/share price levels, with resistance at the $39.24, $39.96 & $40.73/share price levels.

New York Times Co. NYT Stock As A Long-Term Investment

Long-term oriented investors will like NYT stock’s 36.22 P/E (ttm), but may find their 3.88 P/B (mrq) to be a bit too rich.

They recently reported 12.5% Quarterly Revenue Growth Y-o-Y, with 1.3% Quarterly Earnings Growth Y-o-Y.

Their balance sheet looks solid, with $347.36M in Total Cash (mrq) & $69.03M of Total Debt (mrq).

NYT stock pays a modest 0.96% dividend, which appears to be sustainable in the long-run, as their payout ratio is 34.62%.

93.54% of NYT stock’s outstanding share float is owned by institutional investors.

New York Times Co. NYT Stock As A Short-Term Trade Using Options

Short-term focused traders can use options to hedge their portfolios against volatility, while profiting from price movements in NYT stock.

I am looking at the contracts with the 4/21 expiration date.

The $38, $37 & $36 call options are all in-the-money, listed from highest to lowest level of open interest.

The $41, $39 & $40 puts are also all in-the-money, with the former being more liquid than the latter strikes.

Tying It All Together

NYT stock has many interesting attributes that traders & investors should look deeper into.

Investors will like their balance sheet & modest, but sustainable dividend.

Traders will like their recent technical performance & liquid options.

Overall, it is worth taking a closer look into NYT stock to see how it fits into your portfolio strategy.

*** I DO NOT OWN SHARES OR OPTIONS CONTRACT POSITIONS IN NYT STOCK AT THE TIME OF PUBLISHING THIS ARTICLE ***

Fox Corporation FOX Stock Analysis

Fox Corporation stock trades under the ticker FOX & has shown recent bullishness that traders & investors should research further into.

FOX stock closed at $30.98/share on 3/27/2023.

Fox Corporation FOX Stock’s Technical Performance Broken Down

Fox Corporation FOX Stock's Technical Performance Over The Past Year
Fox Corporation FOX Stock’s Technical Performance Over The Past Year

FOX Stock Price: $30.98

10 Day Moving Average: $30.49

50 Day Moving Average: $31.53

200 Day Moving Average: $30.12

RSI: 48.6

MACD: -0.336

Yesterday, FOX stock completed a bullish MACD crossover, gaining +1.97% on the day’s session.

Their RSI is neutral & recent trading volumes have been about average.

FOX stock has support at the $30.64, $30.62 & $30.56/share price levels, with resistance at the $31.44, $31.53 (50 day moving average) & $31.67/share price levels.

Fox Corporation FOX Stock As A Long-Term Investment

Long-term oriented investors will like FOX stock’s 11.07 P/E (ttm) & their 1.39 P/B (mrq).

They recently reported 3.7% Quarterly Revenue Growth Y-o-Y.

Their balance sheet will require a more thorough examination, with $4.06B of Total Cash (mrq) & $8.22B of Total Debt (mrq).

FOX stock pays a 1.61% dividend, which appears to be sustainable as their payout ratio is 18.01%.

54.26% of FOX stock’s outstanding share float is owned by institutional investors.

Fox Corporation FOX Stock As A Short-Term Trade Using Options

Traders focused on shorter time horizons can trade options to profit from FOX stock’s price movements, while protecting their portfolios from volatility.

I am looking at the contracts with the 4/21 expiration date.

The $30, $25 & $20 call options are all in-the-money, with the former being more liquid than the latter two strike prices.

The $35 & $40 puts are also both in-the-money, listed from highest to lowest level of open interest.

Tying It All Together

FOX stock has many interesting attributes that traders & investors are sure to find appealing.

Investors will like their valuation metrics, as well as their sustainable dividend.

Traders will like their recent technical performance, but may wish that their options were more liquid.

Overall, it is worth taking a closer look into FOX stock to see how it fits into your portfolio strategy.

*** I DO NOT OWN SHARES OR OPTIONS CONTRACT POSITIONS IN FOX STOCK AT THE TIME OF PUBLISHING THIS ARTICLE ***

Valero Energy Corp. VLO Stock Analysis

Valero Energy Corp. stock trades under the ticker VLO & has shown recent bullishness that traders & investors should research further into.

VLO stock closed at $131.88/share on 3/27/2023.

Valero Energy Corp. VLO Stock’s Technical Performance Broken Down

Valero Energy Corp. VLO Stock's Technical Performance Over The Past Year
Valero Energy Corp. VLO Stock’s Technical Performance Over The Past Year

VLO Stock Price: $131.88

10 Day Moving Average: $129.39

50 Day Moving Average: $134.72

200 Day Moving Average: $121.24

RSI: 49.99

MACD: -1.118

Yesterday, VLO stock completed a bullish MACD crossover, gaining +2.03% on the day’s session.

Recent trading volumes have been about average compared to the year prior & their RSI is neutral, after recently climbing back from the losses of early March 2023.

VLO stock has support at the $129.39 (10 day moving average), $128.70 & $127.86/share price levels, with resistance at the $134.72 (50 day moving average), $135.70 & $141.32/share price levels.

Valero Energy Corp. VLO Stock As A Long-Term Investment

Long-term oriented investors will like VLO stock’s 4.35 P/E (ttm) & their 1.99 P/B (mrq).

They recently reported 17.5% Quarterly Revenue Growth Y-o-Y, with 208.5% Quarterly Earnings Growth Y-o-Y.

Their balance sheet will require a more thorough examination, with $4.86B of Total Cash (mrq) & $12.72B of Total Debt (mrq).

VLO stock pays a 3.03% dividend yield, which appears to be sustainable in the long-run, as their payout ratio is 13.5%.

83.82% of VLO stock’s outstanding share float is owned by institutional investors.

Valero Energy Corp. VLO Stock As A Short-Term Trade Using Options

Traders with shorter time horizons can trade options to profit from VLO stock’s price movements, while protecting their portfolios from volatility.

I am looking at the contracts with the 4/21 expiration date.

The $130, $131 & $129 calls are all in-the-money, listed from highest to lowest level of open interest.

The $135, $132 & $134 puts are also all in-the-money, with the former being more liquid than the latter two strikes.

Tying It All Together

VLO stock has many interesting characteristics that traders & investors will find appealing.

Investors will like their valuation metrics, recent growth & dividend yield.

Traders will like their recent technical performance & how liquid their options are.

All-in-all, VLO stock is worth taking a closer look at to see how it fits into your portfolio strategy.

*** I DO NOT OWN SHARES OR OPTIONS CONTRACT POSITIONS IN VLO STOCK AT THE TIME OF PUBLISHING THIS ARTICLE ***

Oracle Corp. ORCL Stock Analysis

Oracle Corp. stock trades under the ticker ORCL & has shown recent bullishness that traders & investors should research further into.

ORCL stock closed at $87.90/share on 3/22/2023.

Oracle Corp. ORCL Stock’s Technical Performance Broken Down

Oracle Corp. ORCL Stock's Technical Performance Over The Past Year
Oracle Corp. ORCL Stock’s Technical Performance Over The Past Year

ORCL Stock Price: $87.90

10 Day Moving Average: $85.59

50 Day Moving Average: $87.65

200 Day Moving Average: $77.22

RSI: 54.5

MACD: -0.253

Yesterday, ORCL stock completed a bullish MACD crossover, gaining +0.37% on the day’s session.

Recent trading volumes have been above average compared to the year prior & their RSI is neutral, but their recent candlesticks signal there will be more weakness in the near-term, which can give traders & investors more favorable entrypoints.

ORCL stock has support at the $87.65 (50 day moving average), $85.87 & $85.59/share price levels, as they try to break out & above their $90.67 & $99.63/share resistance levels.

Oracle Corp. ORCL Stock As A Long-Term Investment

Long-term oriented investors will like ORCL stock’s 28.14 P/E (ttm).

They recently reported 17.9% Quarterly Revenue Growth Y-o-Y, with -18.2% Quarterly Earnings Growth Y-o-Y, which prospective investors may want to look further into.

Their balance sheet will also require a more thorough examination, with $8.77B of Total Cash (mrq) & $91.81B of Total Debt (mrq).

ORCL stock pays a 1.55% dividend, which appears to be sustainable in the long-run as their payout ratio is 42.24%.

43.54% of ORCL stock’s outstanding share float is owned by institutional investors.

Oracle Corp. ORCL Stock As A Short-Term Trade Using Options

Traders with shorter time horizons can trade options to profit from price moves in ORCL stock, while protecting their portfolios from volatility.

I am looking at the contracts with the 4/21 expiration date.

The $87.50, $85 & $87 call options are all in-the-money, listed from highest to lowest level of open interest.

The $90, $88 & $89 puts are also all in-the-money, with the former being more liquid than the latter strikes.

Tying It All Together

ORCL stock has many interest attributes that traders & investors are sure to find appealing.

Investors will like their P/E (ttm) & sustainable dividend yield.

Traders will like their liquid options & recent technical performance.

Overall, it is worth taking a closer look into how ORCL stock fits into your portfolio strategy.

*** I DO NOT OWN SHARES OR OPTIONS CONTRACT POSITIONS IN ORCL STOCK AT THE TIME OF PUBLISHING THIS ARTICLE ***

Aon Corp. AON Stock Analysis

Aon Corp. stock trades under the ticker AON & has shown recent bullish behavior that traders & investors should research further into.

AON stock closed at $300.47/share on 3/20/2023.

Aon Corp. AON Stock’s Technical Performance Broken Down

Aon Corp. AON Stock's Technical Performance Over The Past Year
Aon Corp. AON Stock’s Technical Performance Over The Past Year

AON Stock Price: $300.47

10 Day Moving Average: $296.13

50 Day Moving Average: $310.04

200 Day Moving Average: $290.02

RSI: 47.95

MACD: -4.097

Yesterday, AON stock completed a bullish MACD crossover, gaining +1.31% on the day’s session.

Their RSI is neutral & recent trading volumes have been above average compared to the year prior, as they try to recover from losses incurred in earlier 2023.

AON stock has support at the $296.35, $296.13 (10 day moving average) & $294.47/share price levels, with resistance at the $302.17, $310.04 (50 day moving average) & $314.09/share price levels.

Aon Corp. AON Stock As A Long-Term Investment

Long-term oriented investors will like AON stock’s 24.45 P/E (ttm).

Before investing, it would be wise to look closer into their recently reported growth metrics, with 1.6% Quarterly Revenue Growth Y-o-Y & -23.9% Quarterly Earnings Growth Y-o-Y.

Their balance sheet will also require a more thorough review, with $1.03B of Total Cash (mrq) & $11.68B of Total Debt (mrq).

AON stock pays a modest 0.74% dividend, which appears to be sustainable in the long-run as their payout ratio is 18.04%.

87.24% of AON stock’s outstanding share float is owned by institutional investors.

Aon Corp. AON Stock As A Short-Term Trade Using Options

Traders with shorter time horizons can trade options to profit from AON stock’s price movements, while protecting their portfolio from volatility.

I am looking at the contracts with the 6/16 expiration date.

The $300, $290 & $260 call options are all in-the-money, listed from most to least liquid strike price.

The $310, $320 & $330 puts are also all in-the-money, listed from highest to lowest level of open interest.

Tying It All Together

AON stock has many interesting attributes that traders & investors will find appealing.

Investors will like their P/E (ttm) & modest, but sustainable dividend.

Traders will like their recent technical performance.

All-in-all, it is worth taking a closer look into how AON stock fits into your portfolio strategy.

*** I DO NOT OWN SHARES OR OPTIONS CONTRACT POSITIONS IN AON STOCK AT THE TIME OF PUBLISHING THIS ARTICLE ***

Cintas Corp. CTAS Stock Analysis

Cintas Corp. stock trades under the ticker CTAS & has shown recent bullishness that traders & investors should research further into.

CTAS stock closed at $441.79/share on 3/20/2023.

Cintas Corp. CTAS Stock’s Technical Performance Broken Down

Cintas Corp. CTAS Stock's Technical Performance Over The Past Year
Cintas Corp. CTAS Stock’s Technical Performance Over The Past Year

CTAS Stock Price: $441.79

10 Day Moving Average: $435.29

50 Day Moving Average: $438.99

200 Day Moving Average: $419.13

RSI: 53.25

MACD: -1.033

Yesterday, CTAS stock completed a bullish MACD crossover, gaining +2.09% on the day’s session.

Their RSI is neutral & recent trading volumes have been below average compared to the year prior, as they have spent much of 2023 in a consolidation range.

CTAS stock has support at the $439.46, $438.99 (50 day moving average) & $438.41/share price level, with resistance at the $447.88, $453.01 & $463.47/share price levels.

Cintas Corp. CTAS Stock As A Long-Term Investment

Long-term oriented investors will like CTAS stock’s 35.48 P/E (ttm), but will find their 12.92 P/B (mrq) to be a bit too high.

They recently reported 13.1% Quarterly Revenue Growth Y-o-Y, with 10.1% Quarterly Earnings Growth Y-o-Y.

Their balance sheet will require a deeper examination, with $89.9M of Total Cash (mrq) & $3.1B of Total Debt (mrq).

CTAS stock pays a 0.97% dividend, which appears to be sustainable in the long-run, as their payout ratio is 34.17%.

66.92% of CTAS stock’s outstanding share float is owned by institutional investors.

Cintas Corp. CTAS Stock As A Short-Term Trade Using Options

Traders with short-term time horizons can trade options to profit from CTAS stock’s price movements, while protecting their portfolios from volatility.

I am looking at the contracts with the 5/19 expiration date.

The $430, $420 & $400 call options are all in-the-money, listed from highest to lowest levels of open interest.

The $460, $480 & $450 puts are also all in-the-money, with the former being more liquid than the latter strikes.

Tying It All Together

CTAS stock has many interesting attributes that traders & investors will find appealing.

Investors will like their recent growth metrics & modest, but stable dividend.

Traders will like their recent technical performance & liquid options.

Overall, it is worth taking a closer look into how CTAS stock fits into your portfolio strategy.

*** I DO NOT OWN SHARES OR OPTIONS CONTRACT POSITIONS IN CTAS STOCK AT THE TIME OF PUBLISHING THIS ARTICLE ***