Box Inc. BOX Stock Analysis

Box Inc. stock is a cloud-based technology stock that trades under the ticker BOX.

BOX stock closed at $24.40/share on 8/2/2021, after showing recent technical strength & completing a bullish MACD crossover.

Short-term traders & long-term investors alike should have BOX stock on their radar as it looks poised to offer solid returns.

BOX Inc. BOX Stock Technical Performance For The Last Year

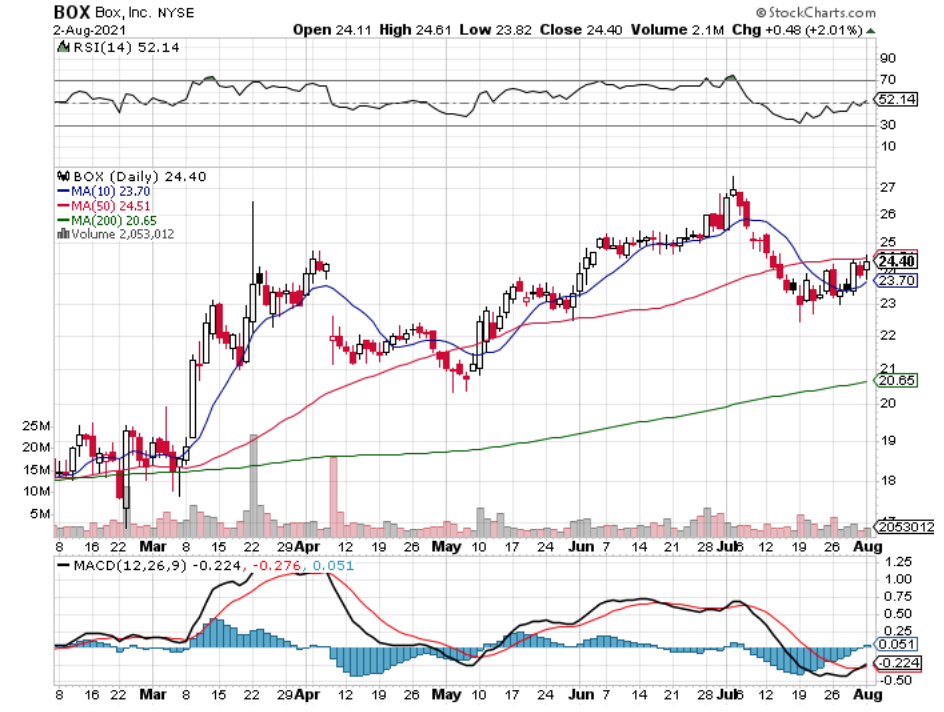
BOX Stock Price: $24.40

10 Day Moving-Average: $23.70

50 Day Moving-Average: $24.51

200 Day Moving-Average: $20.65

RSI: 52

Box Inc. is well above its 200 Day Moving-Average, with a 3% difference between their 10 Day & 50 Day MA’s, showing signs of more price momentum to come.

With an RSI that is relatively flat at 52, there also looks to be added bullishness in the near term.

From an options perspective, BOX $24 strike price looks the most appealing as it is currently at-the-money for calls.

The $25 puts look appealing, although there is much more bullish sentiment than bearish when you compare the open interest on either, as there are 5x the number of open contracts up the calls side vs. the puts.

Longer term investors should like BOX, as the cloud space continues to grow, and they are featured in a number of prominent ETFs.

Once BOX stock breaks beyond the $25 mark, there looks to be more room to run until they reach the $27 range, giving them a potential 10%+ upside with the current way momentum is moving them.

Overall, short-term traders & long-term investors alike should be taking a closer look at BOX stock for an opportunity for profits.

*** I DO NOT OWN SHARES OF BOX STOCK ***

Capri Holdings Ltd. CPRI Stock Analysis

Capri Holdings Ltd. stock experienced a 12.5%+ gap up on Friday 7/30/2021, closing the session at $56.31/share.

CPRI stock enjoyed the highest level of volume it has had in over a year as it completed a bullish MACD crossover.

Capri Holdings Ltd. is a luxury fashion company based out of London.

Capri Holdings Ltd. CPRI Stock Technical Performance For The Last Year

CPRI Stock Price: $56.31

10 Day Moving-Average: $50.45

50 Day Moving-Average: $53.45

200 Day Moving-Average: $45.48

RSI: 60

With an RSI of 60, CPRI stock does not show signs of being terribly overbought, giving it room to continue climbing in the near-term.

With CPRI’s 10 Day Moving-Average ~6% below the 50 Day MA, the momentum looks poised to continue pushing CPRI’s stock price higher in the short-to-mid term.

The $58 price level should be interesting from a resistance perspective, as the price has flirted with this level now a few times in the last 2 months.

From an options perspective, Capri Holdings Ltd. the $57 strike price is currently at-the-money as I type this, making it the best level to target (unless looking at the $56 & lower calls).

One thing of note is that CPRI has low open interest in its options, so traders will want to be sure they understand the risks associated with trading options in an illiquid market.

Longer-term focused investors may find CPRI’s P/E (ttm) of 5 & their P/B of 3 may be of interest, especially when combined with their almost 92% % Institutional Ownership.

Overall CPRI stock & options look to have appealing characteristics for both short & long term traders & investors & are worth taking a closer look at.

*** I DO NOT OWN SHARES OF CPRI STOCK ***

Hess Midstream Partners LP HESM Stock Analysis

Hess Midstream Partners LP stock trades under the ticker HESM & closed for trading at $25.45/share on 7/28/2021.

HESM stock has shown recent technical strength, with a bullish MACD crossover yesterday on a 9%+ gap up day.

Hess Midstream Partners LP HESM Stock Technical Performance Over The Last Year

HESM Stock Price: $25.45

10 Day Moving-Average: $23.55

50 Day Moving-Average: $25.00

200 Day Moving-Average: $21.25

RSI: 60.51

Hess Midstream Partners LP’s stock looks to have a bit of momentum driving it forward, as the 10 Day Moving-Average approaches the 50 Day MA.

Their RSI is a bit high at 60, but as they begin to establish a new range this will settle down & enable them to keep growing from a not being overbought standpoint.

If HESM is able to cross the $25.71 mark then there looks to be open room to run up to $26.50- low $27’s.

From an options perspective, the HESM calls & puts with the $25 strike price look most appealing, as the $30 calls are far out of the money and the $30 puts (8/20 expiration) have no open interest.

Recall that the less open interest, the less liquidity there is, making it more difficult to unload your position.

Short-term & long-term traders alike have good reason to be looking into HESM stock & options.

From a long-term hold perspective HESM offers a 6.99% Dividend Yield, providing a near 7% cushion annually for investors.

Overall, Hess Midstream Partners LP looks to be a great opportunity for near & long-term investors & traders and is worth considering in your research.

*** I DO NOT OWN SHARES OF HESM STOCK ***

Direxion Daily Aerospace & Defense Bull 3x DFEN ETF Analysis

DFEN is the ticker for the Direxion Daily Aerospace & Defense Bull 3x Shares ETF, which closed at $23.01/share on 7/27/2021.

DFEN is a 3x levered ETF, which means it seeks the returns of 300% of the Dow Jones US Select Aerospace & Defense Index.

It is important to note that the 300% anticipated returns on that index are for a single day, and not for longer-term periods.

Direxion Daily Aerospace & Defense Bull 3X Shares DFEN ETF Technical Performance For The Last Year

DFEN Stock Price:$23.01

10 Day Moving-Average: $22.11

50 Day Moving-Average: $24.08

200 Day Moving-Average: $19.11

RSI: 48

The DFEN ETF has been rebounding after a dip in early July, completing a bullish MACD crossover yesterday.

With an RSI of 48 this looks like the trend is on pace to continue higher, as the price finds itself near halfway between the 10 Day & 50 Day Moving-Averages.

Before purchasing DFEN or any other ETF (especially leveraged ones), always review the holdings in the prospectus to ensure that you have an understanding of what is going to be impacting the price.

In the case of DFEN, the top ten holdings in the ETF are: Boeing, Raytheon Technologies, Lockheed Martin, Teledyne Tech, L3 Harris Technologies, General Dynamics, Northrop Grumman, Transdigm Group, Textron & Howmet Aerospace (by %).

One interesting thing to note is that by sector the ETF is constructed of 97.7% Aerospace & Defense names, while also having 1.4% Machinery & ~1% Leisure Products components, which will impact performance on a given day.

DFEN is an interesting play for short-term oriented traders, especially those that want to get exposure to the Aerospace & Defense sector.

As a longer-term hold, it would be wiser to examine the basket of stocks that they own, and choose the best among them on an individual basis, so that you reduce the risks associated with owning a leveraged large basket of individual stocks.

I’m looking at the $24 call options with the 8/20 expiration date, and the same puts as well.

Overall, DFEN offers traders a great way to take advantage of short-term advances in the aerospace & defense sector and is worth considering adding to your portfolio.

*** I DO NOT OWN SHARES OF DFEN STOCK/ETF ***

IMV Inc. IMV Stock Analysis

IMV Inc. stock trades under the ticker IMV & is a Biotechnology company.

IMV stock closed at $2.05/share on 7/26/2021, after showing great technical strength over the prior 2 days.

IMV Inc. IMV Stock Technical Performance In The Last Year

IMV Stock Price: $2.05

10 Day Moving-Average: $1.63

50 Day Moving-Average: $2.16

200 Day Moving-Average: $3.05

RSI: 54.9

Yesterday, IMV stock completed a bullish MACD crossover after jumping ~26% during the day, following a ~18% increase the day prior.

With an RSI of ~55 there is still room for IMV Inc. to climb, although there may be a shake out period after back-to-back gap up days.

The volume of the last two days of trade show great momentum behind the changes in price, with shares trading at far higher volume levels than anytime in the last year.

IMV will need to clear the $2.15 price level to break the resistance of where it had been prior to early July before its heavy gap down on 7/15/21.

Once that has happened, I’m eyeing the $2.40/$2.50 price level where the High of yesterday’s prices was.

The filled green candle yesterday isn’t the best looking situation to be in, but after a ~49%+ jump in price there is some shaking out to be expected as it establishes a new range.

Unfortunately, the options for IMV are around that second level that I am eyeing for price, with the cheapest calls & puts available at $2.50.

I may eye the $2.50 calls, especially today as the price of IMV shares begins to drop a bit & settle down.

I’m also debating buying some shares outright as well, as looking at IMV’s delta that may offer similar (but not the same) reward with slightly less risk.

If there shares do go into the money at $2.50, that will be 25%+ profit, and selling them as calls will get a little extra money with the attached premium.

Either way, IMV is an interesting stock that traders should have their eyes on in the near-to-mid term.

*** I DO NOT OWN SHARES OF IMV STOCK ***

Amyris Inc. AMRS Stock Analysis

Amyris Inc. stock trades under the ticker AMRS & closed at $15.56/share on 7/23/2021.

Amyris stock has recently shown technical strength, completing a Bullish MACD crossover on Friday.

AMRS looks primed to continue climbing in the near & long term timeframes.

Amyris Inc. AMRS Stock Technical Performance For The Last Year

AMRS Stock Price: $15.56

10 Day Moving-Average: $14.56

50 Day Moving-Average: $14.97

200 Day Moving-Average: $11.29

RSI: 53

AMRS looks primed with momentum up until it begins to test the $17/share range for investors & traders with long-term timeframes.

I’m looking at their August 20th expiration options with the $16 strike price, with the calls (Delta of 0.4986) being almost at-the-money & the puts being slightly in-the-money (Delta of -0.5006).

August 20th has much more open interest than any of the other near-term options (less the $16 7/30 exp. calls), so there is more likelihood of being able to sell them easily.

With an RSI at 53, AMRS stock seems fairly priced from a technical perspective & has more room to run.

This will be supported also in part by the 10 Day Moving-Average crossing the 50 Day MA in the near future (3% difference), as the current stock price’s trend will carry it through.

All-in-all, AMRS stock & options look to provide great opportunities in the near & long-term to traders & investors.

*** I DO NOT OWN SHARES OF AMRS STOCK ***

Gannet Co. GCI Stock Analysis

Gannet Co. stock trades under the ticker GCI & has recently shown a 25% increase in price.

GCI stock closed at $5.52 on 7/21/21, completing a Bullish MACD crossover on higher than normal volume after a sturdy 3 day climb in price.

Gannet Co. GCI Stock Technical Performance For The Last Year

GCI Stock Price: $5.52

10 Day Moving-Average: $4.98

50 Day Moving-Average: $5.22

200 Day Moving-Average: $4.10

RSI: 59.21

MACD: -0.064

GCI’s 10 Day Moving-Average is ~4% shy of their 50 Day Moving-Average, which when combined with their RSI of 59 shows that they still have room to climb higher.

There is resistance around the $5.95-6 range, but all technical indicators are looking strong for continued price growth.

Gannet’s option strike prices are at-the-money at $5 calls & puts, with the other options having $2.50 & $7.50 strike prices.

I am looking at the 10/15/21 expiration call options today, as they have dropped a bit in price in the pre-market so at-the-money calls will be cheaper.

It is unlikely that they will climb the 50% needed in that time to make the $7.50 options in-the-money.

Overall, Gannet Co’s stock looks to have some great short-term trade opportunities.

*** I DO NOT OWN SHARES OF GCI STOCK ***

Mastercard Stock Analysis

Mastercard stock trades under the ticker MA & closed at $374.39/share on 7/21/2021.

MA stock has recently shown some technical weakness that both long-term investors & short-term traders can take advantage of.

After a ~5.5% gap-down on Monday, MA had a bearish MACD crossover, despite a slight recovery in price yesterday.

Mastercard MA Stock Technical Performance For The Last Year

MA Stock Price: $374.39

10 Day Moving-Average: $378.39

50 Day Moving-Average: $368.84

200 Day Moving-Average: $352.00

RSI: 50

While Mastercard’s current stock price is in a questionable area, a long-term investor may think to start a position at this level, where they may be able to buy into on-coming weakness as the price level flirts with the 50 Day Moving-Average & is below the 10 Day MA.

Their dividend yield isn’t much of a cushion to protect against further downward motion, but with an RSI of 50 it isn’t unreasonable to think that they will be able to rebound in the nearterm.

Short-term traders may think to take advantage to this recent weakness using options.

The MA 7/30 $375 puts are currently at-the-money with a Delta of -.50, although with a Theta of -.41 it would be wise to be hedged with either some long-term shares & or some matching calls.

From the calls perspective, it may be better worthwhile to buy the slightly more in-the-money $372.50’s to allow for extra wiggle room as the price levels stabilize.

Overall, Mastercard’s stock & options look to provide traders & investors great opportunities & are worth considering a closer look at.

*** I DO NOT OWN SHARES OF MASTERCARD MA STOCK OR OPTIONS ***

Cheesecake Factory CAKE Stock & Option Analysis

Cheesecake Factory stock trades under the ticker CAKE & closed for trading at $62.47/share on 6/8/2021.

CAKE stock has just completed a bullish MACD crossover, along with a price breakout above its 10 Day Moving-Average, which shows that there is still momentum to the upside for their shares.

Cheesecake Factory CAKE Stock Technical Performance For The last Year

CAKE Stock Price: $62.47

10 Day Moving-Average: $57.98

50 Day Moving-Average: $58.85

200 Day Moving-Average: $44.31

RSI: 61

While CAKE stock’s volume has been more quiet in 2021 than 2020, they have begun heating up in June again.

Their RSI is showing signs that the climb can continue without venturing too deep into overbought territory, and their 10 Day Moving-Average is about to cross their 50 Day Moving-Average bullishly, which is another good signal for short-term traders.

Cheesecake Factory stock has options, and I am looking at the $60 calls that are currently in the money, as well as some further out $65 calls.

I also like the slightly out-of-the-money puts at $60 as a hedge, as 4% to the downside puts them in the money, while ~4% to the upside puts the $65 calls in the money.

From a long-term investment standpoint it may be worth waiting to buy into them, as their current resistance is just under $66/share, so unless you plan on starting a position now & averaging it down, there appears to be more initial downside than up for the long-haul.

Restaurants as a whole are looking strong from our technical analysis perspective, with BJ’s & Chuy’s Holdings also showing similar strength.

Overall, CAKE stock & options appear to have a great opportunity for short-term traders looking to take advantage of their recent surge in momentum.

*** I DO NOT OWN SHARES OF CAKE STOCK ***

CTS Corporation CTS Stock Analysis

CTS Corporation’s stock trades under the ticker CTS & closed at $38.53/share on 6/7/2021.

CTS has been on a run from the $32/share range since early-mid May, and while they appear from a technical standpoint to be cooling off a bit as they establish a new price range, this gives traders an opportunity for gains on the way up & down for CTS stock.

CTS Corporation CTS Stock Technical Performance For The Last Year

CTS Stock Price: $38.53

10 Day Moving-Average: $38.34

50 Day Moving-Average: $33.44

200 Day Moving-Average: $30.31

RSI: 66

CTS Corporation’s stock’s RSI is just coming back from being in overbought territory, with what appears to be a bit more steam to blow off in the near-term.

CTS’s MACD just completed a bearish cross, after the price level was stopped around the $39.50 level, and with the stock price about to bearishly cross through the 10 Day Moving-Average the case for CTS puts becomes quite strong.

I am looking at the $40 puts, as their delta of -.76 & gamma of .16 are more appealing than the out-of-the-money $35 puts.

CTS stock’s $35 calls look the best from the upside, although traders can also look for a longer-term entry as the price level begins to stabilize in the $36-37 range.

*** I DO NOT OWN SHARES OF CTS STOCK ***