SilverSun Technologies, Inc. SSNT Stock Analysis

SilverSun Technologies, Inc. stock trades under the ticker SSNT & closed at $7.18/share on 5/4/2021.

SSNT stock has many favorable technical indicators & has been steadily climbing since mid-September 2020.

SilverSun Technologies Inc. SSNT Stock Technical Performance For The Last Year

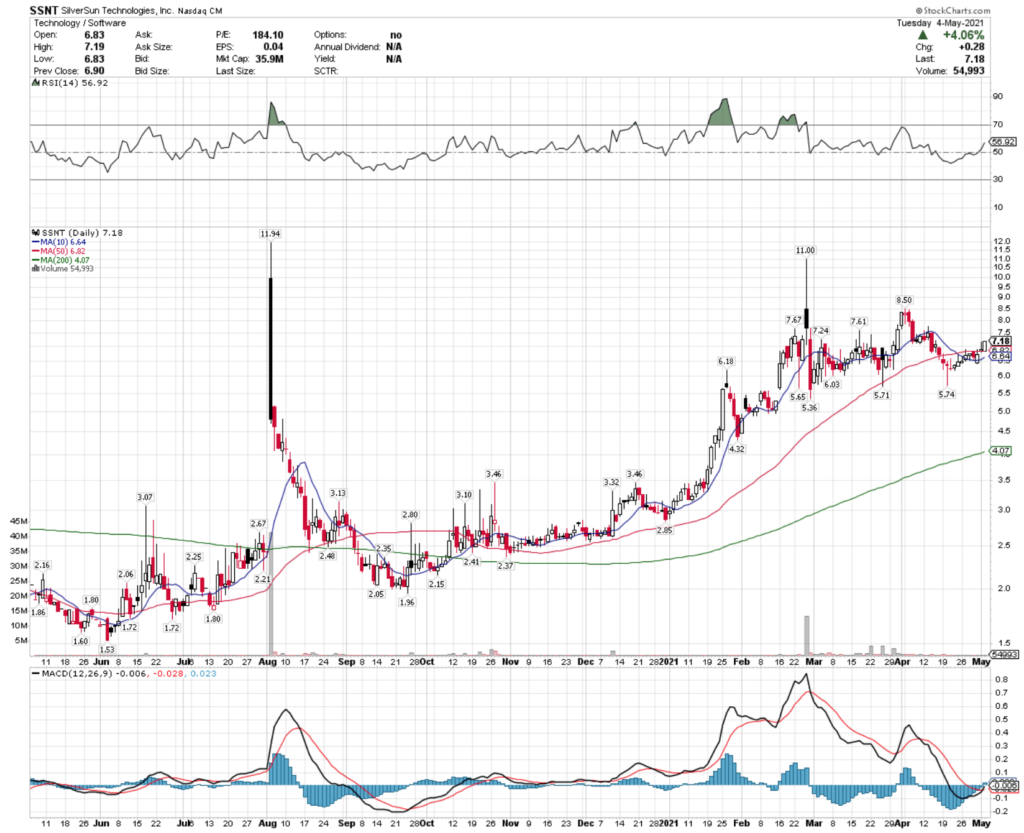
SSNT Stock Price: $7.18

10 Day Moving-Average: $6.64

50 Day Moving-Average: $6.82

200 Day Moving-Average: $4.07

RSI: 57

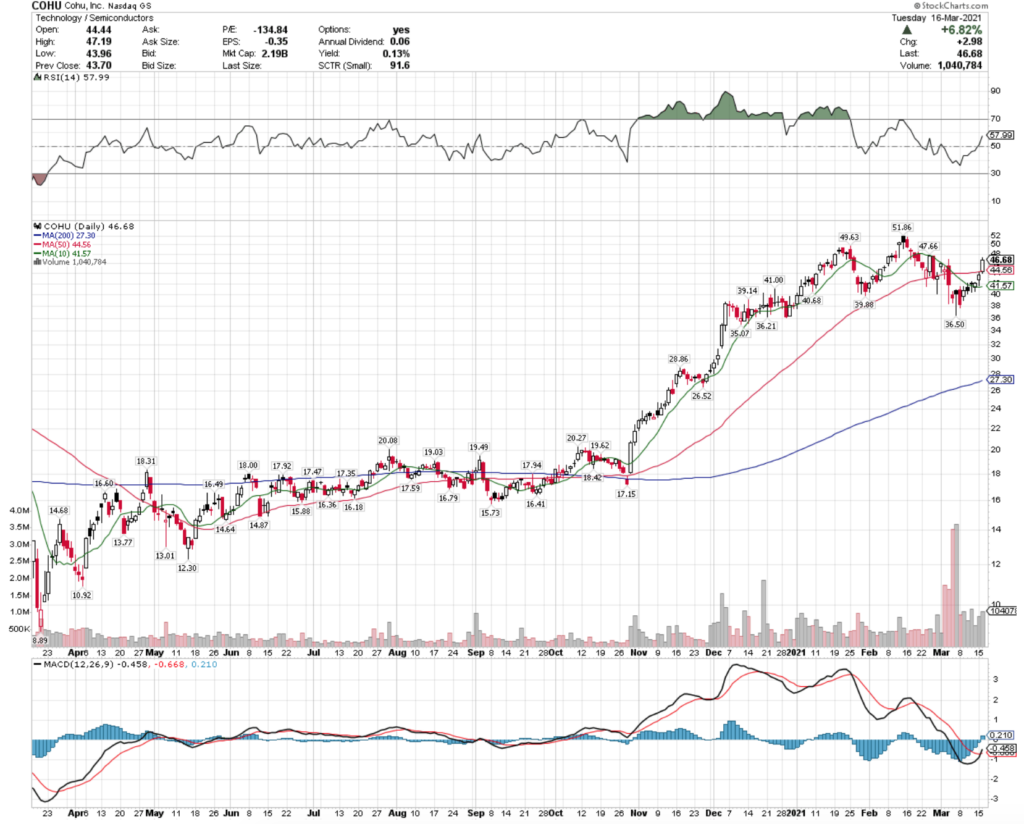
As you can see, SSNT’s 10 Day Moving-Average is approaching the 50 Day MA rapidly, and they just completed a bullish MACD crossover.

This should provide extra room for short-to-midterm growth, as the momentum is there pushing the price higher.

With an RSI just under 57, it appears that SilverSun Technologies Inc.’s stock has plenty more room to run before it enters overbought territory.

SSNT stock does not offer options for traders, however they do offer an annual dividend most years, which should be interesting as the last two were a combined $0.90, which is significant given the share price was in the $3 range when each of the payments were made (Jan & Dec 2020).

While that Dividend Yield is not as consistent as we like, it does provide a nice added bonus should it continue into EOY 2021 & beyond.

If SSNT’s price breaks through $7.22 I will be looking for it to climb up to $7.50, then fighting to go beyond $7.76.

Overall, it appears there is more opportunity for SSNT to grow, and there may be some nice buying opportunities presenting themselves in the coming days.

*** I DO NOT OWN ANY SHARES OF SSNT STOCK ***

Chico’s FAS, Inc. CHS Stock Analysis

Chico’s FAS, Inc. stock trades under the ticker CHS & closed at $3.23/share on 5/3/2021.

CHS stock has recently experienced a bullish MACD crossover, as well as a bullish 10 & 50 Day Moving-Average crossover, making it worth taking a closer look at from a short-term trade perspective.

Chico's FAS, Inc. CHS Stock Technical Performance For The Last Year

CHS Stock Price: $3.23

10 Day Moving-Average: $3.00

50 Day Moving-Average: $3.09

200 Day Moving-Average: $1.93

RSI: 56

With CHS stock’s 50 Day Moving-Average just 3% shy of its 10 Day MA, there looks to be more gas in the tank for their price to continue rising.

CHS’s current resistance level is <1% higher than the share price today ($3.25), giving it more room to run in the near-to-mid term.

Chico’s FAS, Inc.’s stock also has options for traders to capitalize on.

The $3 CHS call options look to be the most appealing, as the next highest strike price is $4, which requires another 23%+ price increase in order to become in-the-money.

From a puts perspective, the $4 strike price seems optimal, as it would require a 7%+ drop in share price for CHS stock to be in-the-money.

I’ll be looking at the options outlined above this week, as it appears that CHS stock has a lot of opportunity for short & mid-term traders.

For the mid-term traders & longer-term investors, Chico’s FAS Inc. offers a 3% annual dividend yield, an added bonus that makes their stock even more appealing.

*** I DO NOT OWN ANY SHARES OF CHS STOCK ***

Colfax Corp. CFX Stock & Option Analysis

Colfax Corp. stock trades under the ticker CFX & has recently shown technical strength, making it worth taking a closer look at for a short-term trade opportunity.

CFX stock closed at $44.93/share on 4/19/2021, and they just completed a bullish MACD crossover.

Colfax Corp. CFX Stock Technical Performance For The Last Year

CFX Stock Price: $44.93

10 Day Moving-Average: $43.94

50 Day Moving-Average: $44.43

200 Day Moving-Average: $36.57

RSI: 53

With their average RSI & MACD crossover, there appears to be more room for upward growth & momentum, especially given the close proximity of the 10 Day & 50 Day Moving-Averages.

Their volume is relatively close to average recently, with the exception of a couple of higher volume bad days in March 2021.

I’ll be eyeing the $45 strike calls & puts, as $45.43 is the first test point for resistance, which will also account for any potential macro-market conditions that may adversely impact CFX’s growth.

My only concern is that there is a low amount of open interest on these options (45 calls, 35 puts), but their volume has been more active than their open interest recently.

All-in-all there appears to be great opportunities here for a short-term trade, making CFX a name all traders should be keeping an eye on.

*** I DO NOT OWN SHARES OF CFX STOCK ***

Phillips 66 Partners LP PSXP Stock Analysis

Phillips 66 Partners LP stock trades under the ticker PSXP & has recently shown technical strength, making it worth considering for a short-term trade opportunity.

PSXP stock closed for trading at $30.05/share on 4/7/2021, as its MACD formed a bearish crossover.

Phillips 66 Partners LP PSXP Stock Technical Performance For The Last Year

PSXP Stock Price: $30.05

10 Day Moving-Average: $30.95

50 Day Moving-Average: $28.37

200 Day Moving-Average: $26.50

RSI:49.8

PSXP’s stock has recently slid, putting its price slightly below the 10 Day Moving-Average, but its volume has increased dramatically in the past few days.

From an options perspective, I am looking at the $30 calls & puts, keeping an eye out for the $30.50 & $28.50 levels in price.

Phillips 66 Partners LP stock also offers an 11.65% dividend yield for its common shares, which also may be appealing to longer-term oriented investors.

Overall, PSXP looks to have many advantages for short-term traders & long-term investors alike, and is worth taking a closer look at.

*** I DO NOT OWN SHARES OF PSXP STOCK ***

Everi Holdings Inc. EVRI Stock Analysis

Everi Holdings Inc. stock trades under the ticker EVRI closed at $14.72 on 4/6/2021. EVRI stock has recently shown some signs of technical strength, making it worth taking a closer look at for a short-term trade opportunity.

EVRI just experienced a bullish MACD crossover, and its low-prices have been on a steady uptrend for the last few months.

Everi Holdings Inc. EVRI Stock Technical Performance For The Last Year

EVRI Stock Price: $14.72

10 Day Moving-Average: $14.17

50 Day Moving-Average: $14.52

200 Day Moving-Average: $10.48

RSI: 52

With an average RSI reading & their recent MACD crossover, there looks to be some upside potential in the near-term for Everi Holdings Inc.’s stock & options.

EVRI’s $15 strike call options are just about at-the-money, making that level the one I am currently eyeing for both calls & puts.

Selling the $17.50 strike calls that expire May 21 may also be profitable, as to become in-the-money they would have a month and a half to jump 18%+.

All-in-all, there appears to be some great opportunities for traders to take advantage of EVRI stock & options.

*** I DO NOT OWN SHARES OF EVRI STOCK ***

Cohu, Inc. COHU Stock & Option Analysis

Cohu, Inc. stock trades under the ticker COHU & closed at $46.68/share on 3/16/21.

COHU’s stock has recently shown technical strength, with a MACD bullish crossover & their price breaking the 50 Day Moving-Average, making their stock & options appealing to short-term traders.

Cohu, Inc. COHU Stock Technical Performance For The Last Year

COHU Stock Price: $46.68

10 Day Moving-Average: $41.57

50 Day Moving-Average: $44.56

200 Day Moving-Average: $27.30

RSI: 58

From an options perspective, I would be focused on the $45 level puts & calls from a long positioning standpoint, while eyeing selling the $50 calls, as they would require a 10% gain before 3/19 to be in-the-money.

The $47.66 level will be interesting to watch how COHU’s price reacts, as if they can pass through there, the $51 will be the next level of resistance, putting the $50 calls in-the-money, which would be possible for the 4/16 expiration date.

Overall, COHU stock & options seem to have a few interesting possibilities for short-term traders.

*** I DO NOT OWN SHARES OF COHU STOCK ***

Southern Co. SO Stock Analysis

Southern Co. stock trades under the ticker SO & has recently shown some technical strength, making it worth looking at for a short term trade.

SO stock closed at $59.61 on 3/8/21, after gapping up & crossing it’s 50 Day Moving-Average, while also completing a bullish MACD crossover.

Southern Co. SO Stock Technical Performance For The Last Year

SO Stock Price: $59.61

10 Day Moving-Average: $58.03

50 Day Moving-Average: $59.22

200 Day Moving-Average: $56.16

RSI: 55.6

SO Stock looks ready to move higher, with yesterday’s movement coming off of some of the highest volume their shares have had in months.

If they reach $60, I’ll be keeping an eye on the $60.88 level as in the last quarter there has been resistance around $61.

I’ll be looking at the $59.50 calls & puts with Friday expiration (3/12), as the overall market conditions are a bit ambiguous, with most eyes on tomorrow’s CPI numbers.

*** I DO NOT OWN SHARES OF SO STOCK ***

Surgalign Holdings, Inc. SRGA Stock Analysis

Surgalign Holdings, Inc. stock closed at $2.31/share on 2/3/2021, after completing a bullish MACD crossover, jumping nearly 15% on the day.

Surgalign’s ticker is SRGA, and they’re worth examining more from a short-term trade perspective, as this recent momentum looks to carry them a bit further in price.

Surgalign Holdings, Inc. SRGA Stock Technical Performance For The Past Year

SRGA Stock Price: $2.31

10 Day Moving-Average: $1.94

50 Day Moving-Average: $2.23

200 Day Moving-Average: $2.39

RSI: 59

With an about average RSI, there still looks to be more room to run for SRGA stock.

SRGA has options, with the $2.50 calls being about at-the-money, and the next highest strike price being $5.

SRGA puts are interesting, as unless you purchase a $2.50 long put, there doesn’t seem to be much opportunity for profit.

Selling any of the puts is currently a risk for assignment, as all of their strike prices are in-the-money, and if you sold a $5 one & made the $303 premium (based on closing prices yesterday), you are still down $197.

Selling the $2.50 strike put will yield profit, but it requires an 8% further gain in the coming two weeks, which may not sustain given overall market shakiness.

Overall though, SRGA stock & options are worth taking a closer look at from a short-term trading perspective.

*** I DO NOT OWN SHARES OF SRGA STOCK ***

Snowflake Inc. SNOW Stock Analysis

Snowflake Inc. stock trades under the ticker SNOW & has recently shown technical strength, making it an interesting candidate for a short-term trade.

SNOW stock had a bullish MACD crossover yesterday, while going up 6.63% to close at $300.71.

Snowflake Inc. SNOW Stock Technical Performance For The Last Year

SNOW Stock Price: $300.71

10 Day Moving-Average: $281.66

50 Day Moving-Average: $308.90

200 Day Moving-Average: N/A

RSI: 54

Yesterday’s volume for SNOW was the third highest level since 2021 began, with the upper wick crossing the 50 Day Moving-Average.

SNOW stock does not have a 200 Day Moving-Average yet, as it is still relatively new.

Snowflake looks to have built some positive momentum, making it a prime candidate for a short-term trade.

Looking at SNOW options, the $307.50 calls & puts look the most appealing from a long perspective as a means of having some insurance against any near-term pullback.

From a selling perspective, selling the $330 calls that expire 2/5 seems like a safe opportunity, with decent open interest (322), and selling the $285 put for the same expiration also offers a decent premium, with about half of the open interest (162).

Overall, Snowflake Inc. stock looks to have a lot of opportunities in the near-term for traders to capitalize on.

*** I DO NOT OWN SHARES OF SNOW STOCK ***

Coeur Mining Inc. CDE Stock Analysis

Coeur Mining Inc. stock trades under the ticker CDE & closed at $11.14/share on 2/1/2021.

CDE looks to have great short-term potential for traders, with a recent bullish MACD crossover & a gap up that is about to punch the 10 Day Moving-Average through the 50 Day MA bullishly.

Coeur Mining Inc. CDE Stock Technical Performance For The Past Year

CDE Stock Price: $11.14

10 Day Moving-Average: $8.81

50 Day Moving-Average: $8.94

200 Day Moving-Average: $7.20

RSI: 65

Coeur Mining Inc. has also experienced a surge in volume the last three days when compared to the prior 90 day period, showing a higher than average interest in their stock.

Given the fact that they gapped up so aggressively yesterday, I would focus on the in-the-money $8 or $9 calls & $11 and $12 puts from a long-perspective.

Overall, it looks like CDE stock still has some room to run & is worth taking a look at for a short-term trade opportunity.

*** I DO NOT OWN SHARES OF CDE STOCK ***