Mondelez International Inc. MDLZ Stock

Mondelez International Inc. is in the snack & beverage production industry & trades under the ticker MDLZ.

MDLZ stock closed at $63.69/share on 8/17/2021, on a gap-up day where they also completed a bullish MACD crossover.

Mondelez International, Inc. MDLZ Stock Technical Performance

Mondelez International Inc. MDLZ Stock Technical Performance For The Last Year

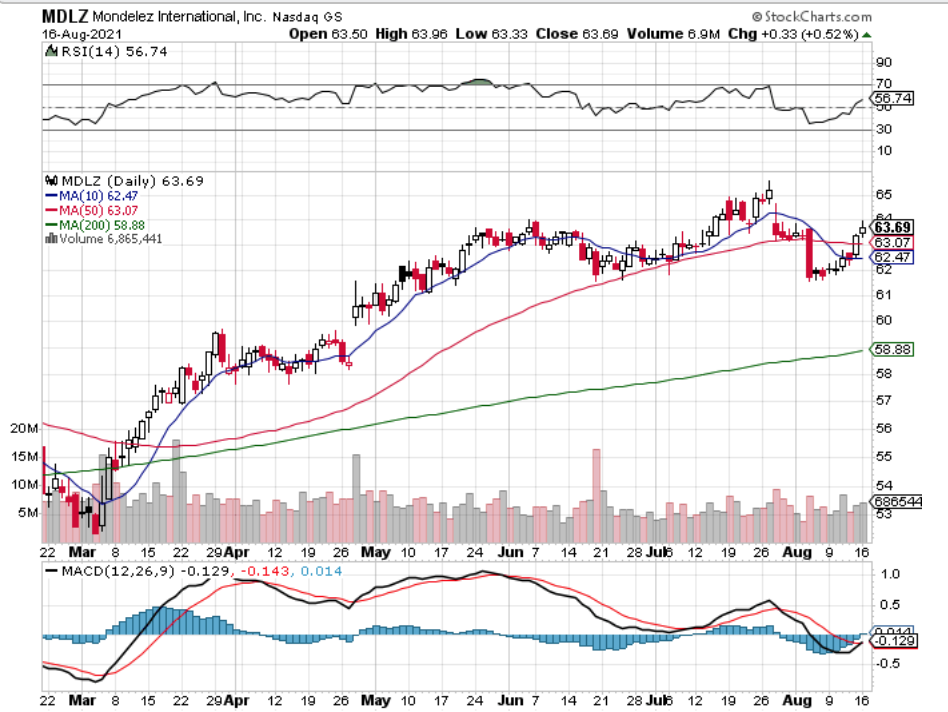
MDLZ Stock Price: $63.69

10 Day Moving-Average: $62.47

50 Day Moving-Average $63.07

200 Day Moving-Average: $58.88

RSI: 56.7

MACD: -0.129

Yesterday’s price movement crossed the 50 Day Moving-Average, with the 10 Day MA <1% away from breaking through it bullishly.

MDLZ’s volume for August has been about average levels with the rest of the year, with their price level 8%+ above their 200 Day Moving-Average.

Mondelez International Inc MDLZ Stock Investment Opportunities

MDLZ has great investment potential, with a P/E(ttm) of 20.98 & a P/B of ~3.

Investors also should like their Dividend Yield of 1.99%, especially with their safe Payout Ratio of 41.7%.

Institutional Investors also like MDLZ, as ~79% of their shares are held by institutions.

With a Beta of 0.68, MDLZ stock is also less likely to be as volatile as the broader markets, which is always a benefit for a long-term investment.

Short-Term Trading Opportunities Using Mondelez International Inc. MDLZ Options

I am looking at the $63 & $63.50 call options with the 9/17 expiration date.

Both of these have healthy Open Interest, although volume has been light recently.

This also makes sense, given these options are in-the-money, making traders less likely to want to part with their so quickly.

From the puts perspective, I am eyeing the $65 & $67.50 strike prices.

Both have low Open Interest, showing that traders feel more bullish about MDLZ stock in the coming month than bearish.

Tying It All Together

All-in-all, MDLZ stock has great potential for both long-term investors & short-term traders.

In the near-term their technical strength looks set to propel them to higher price levels on good momentum.

From a long-term perspective they appear to have healthy growth & offer ~2% as a Dividend Payment annually.

Traders of all time frames & styles should take a closer look at Mondelez International Inc.’s stock.

*** I DO NOT OWN SHARES OF MDLZ STOCK ***

Atlanticus Holdings ATLC Stock Notes

Atlanticus Holdings, Corp. stock trades under the ticker ATLC & focuses on the FinTech space.

ATLC stock closed at $45.86/share on 8/13/2021, & looks to have more room to run higher in the near-term.

Atlanticus Holdings, Corp. ATLC Stock Technical Performance

Atlanticus Holdings, Corp. ATLC Stock Technical Performance For The Last Year

ATLC Stock Price: $45.86

10 Day Moving-Average: $46.50

50 Day Moving-Average: $42.37

200 Day Moving-Average: $30.32

RSI: 55.7

MACD: 1.39

ATLC stock price just completed a bearish MACD crossover, while also dipping below their 10 Day Moving-Average.

Their volume on average for August is higher than their average for the year, and their RSI is working its way back down to 50, after being over-bought before the recent price dip.

This appears to be a chance for traders & investors alike to get a decent price deal before it continues to climb.

Investing For The Long-Term In Atlanticus Holdings, Corp ATLC Stock

Long-term focused investors may find ATLC’s P/E(ttm) appealing at 8.06.

I’m not particularly keen on their Debt/Equity (mrq) levels, nor are Institutional Investors apparently as they have only 16% of ATLC shares.

However, there is more opportunity for growth which may be of interest to investors looking for FinTech exposure.

Trading Atlanticus Holdings, Corp. ATLC Options In The Short-Term

ATLC stock does have options, which short-term focused traders can use to profit from.

I am looking at the 9/17 Expiration, with the $45 & $50 calls.

The open interest on them is very low, so it may be difficult to get rid of your contracts.

From a puts perspective, I would be eyeing the $55 strike price.

I expect there to be more contracts written after Friday’s August expiration, as the open interest on these is practically non-existent.

Tying It All Together

All-in-all there seems to be a lot of opportunities in ATLC stock for both short-term traders & long-term investors.

There appears to be more opportunity for growth from a long-term perspective, although there is no dividend yield to collect on.

In the near-term, their options look to have potential, with their pre-market price continuing to climb as I write this.

*** I DO NOT OWN SHARES OF ATLC STOCK ***

Everi Holdings, Inc. EVRI Stock Notes

Everi Holdings, Inc. stock produces technology for the casino, gaming & interactive industries & trades under the ticker EVRI.

EVRI stock closed at $23.60/share on 8/12/21, showing signals of both short & long-term bullishness.

Everi Holdings, Inc EVRI Stock Technical Performance

Everi Holdings, Inc. EVRI Stock Technical Performance For The Last Year

EVRI Stock Price: $23.60

10 Day Moving-Average: $22.58

50 Day Moving-Average: $23.09

200 Day Moving-Average: $16.41

RSI: 56.6

MACD: -0.073

EVRI stock’s price just broke out over their 50 Day Moving-Average, with the 10 Day MA 2% away from making the same bullish cross.

In August they have traded at higher volume than average for the rest of the past year as well, adding to this sentiment.

Yesterday they completed a bullish MACD crossover, making them look even more appealing as they continue to ride out positive momentum.

Once they break beyond the $23.77 level, I’ll be watching them test the $24.60 level next.

Everi Holdings, Inc. EVRI As A Long-Term Investment

Everi Holdings, Inc. has a P/E (ttm) of 40.69 & a P/B of 36.98.

For a firm that builds technology these are not too high for comfort, as their P/E is reasonable & their costs of equipment etc… are fairly low compared to other niches & industries.

However, investors should be weary of their Debt/Equity (mrq) which is awfully high, as is seen with their Total Debt (mrq) vs. Total Cash levels.

They do have solid underlying trend support from their 200 Day Moving-Average though.

Trading Everi Holdings, Inc. Options

I am looking at the $22.50 calls with the 8/20 expiration, as well as the $25 strike price as well.

These levels have solid Open Interest & Volume levels, making it easier to buy & sell them than other options.

For puts, I may think to look out to the following month’s expiration date, as I’m not certain that this momentum will let up before next Friday’s expiration.

Even the September puts are still very low in open interest, although more contracts will likely be written between now & mid-next week.

Tying It All Together

All-in-all, Everi Holdings, Inc. stock looks to be a great trade idea for both short-term traders & long-term investors alike.

EVRI stock looks set to continue a healthy climb, although there may be some bumps along the way next month.

Regardless, EVRI is definitely worth taking a closer look at by any market participant.

*** I DO NOT OWN SHARES OF EVRI STOCK ***

Caleres, Inc. CAL Stock Analysis

Caleres, Inc. stock trades under the ticker CAL & engages in the sales of retail & wholesale footwear.

CAL stock closed at $24.06/share on 8/11/2021, while completing a bullish MACD crossover.

Breaking Down Caleres, Inc. CAL Stock’s Technicals

Caleres, Inc. CAL Stock Technical Performance Over The Last Year

CAL Stock Price: $24.06

10 Day Moving-Average: $24.11

50 Day Moving-Average: $25.72

200 Day Moving-Average: $19.37

RSI: 47

MACD: -0.465

CAL stock is looking to break out beyond its 10 & 50 Day Moving-Averages, which will add some extra momentum from a technical perspective.

After they cross $24.72, the next target level will be $26.78, as they establish a safer range in that neighborhood.

Caleres, Inc. CAL Stock As A Long-Term Investment

In the long-run, CAL has strong support over their 200 Day Moving-Average, and rewards long-term investors with a 1.15% Dividend.

Unfortunately, their Debt/Equity (ttm) is too high for my liking, but they may be a good fit for certain portfolios.

Trading Caleres, Inc. CAL Options In The Short-Term

From an options perspective, I am looking at the 9/17 exp. $22.50 & $25 calls.

Although their open interest is a bit low, based on the closer strike prices activity I think that more people will be writing them after this current batch expires.

Their puts for the same expiration date are very low in open interest, signaling bullish sentiment in the next month from traders.

However, the $25 & $30 puts still look like their worth taking a closer look at.

All-in-all CAL stock & options look to be well worth taking a closer look at for both short-term traders & long-term investors.

*** I DO NOT OWN SHARES OF CAL STOCK ***

Globalstar Inc. GSAT Stock Analysis

Globalstar Inc. stock trades under the ticker GSAT & provisions mobile satellite services.

GSAT stock closed at $1.42/share on 8/10/2021, with technical signals indicating more bullishness to come.

Globalstar Inc. GSAT Stock Technical Performance For The Last Year

GSAT Stock Price: $1.42

10 Day Moving-Average: $1.38

50 Day Moving-Average: $1.48

200 Day Moving-Average: $1.12

RSI: 48

MACD: -0.041

GSAT’s share price is approaching its 50 Day Moving-Average, with the 10 Day MA ~7% behind the 50 Day.

In addition to the Moving Averages signaling bullishness, GSAT’s RSI is lightly oversold, as it is under 50.

Yesterday, Globalstar Inc completed a bullish MACD crossover, although their volume has been low recently vs. their average for the year.

I am looking at the 8/20 $1.50 call options, which are currently 6% away from being in-the-money, as well as the $1 calls.

For puts, I am looking at the $1.50 & $2 options, although the $1 puts have an unexpectedly high amount of open interest compared to other strike prices.

From a longer-term investment perspective, their P/B is a bit high at 6, although this isn’t exactly a deterrent for folks interested in their industry.

All-in-all, GSAT stock looks to have great opportunities for both long-term & short-term growth & should be on every trader’s radar.

*** I DO NOT OWN SHARES OF GSAT STOCK***

Wynn Resorts Ltd. WYNN Stock Analysis

Wynn Resorts Ltd. stock trades under the ticker WYNN & has recently shown signs of short-term technical strength.

WYNN stock closed at $96.14/share on 8/9/2021, completing a bullish MACD crossover, with an oversold RSI.

Wynn Resorts Ltd. WYNN Stock Technical Performance For The Last Year

WYNN Stock Price: $96.14

10 Day Moving-Average: $97.89

50 Day Moving-Average: $115.58

200 Day Moving-Average: $115.24

RSI: 34.96

MACD: -5.6

While their chart is not the prettiest, WYNN looks poised to bounce & regain some lost ground while establishing a new range.

Their 50 Day Moving-Average will break the 200 Day MA bearishly, which will cause some more pain as the new range is established.

However, given that they are now oversold at the RSI, WYNN should begin to trend back up.

Long-Term investors can use this price level as a means to establish a solid position or add to an existing one.

Short-term traders & options traders can take advantage of the bounce to gain some quick profits.

I am looking at the $97.50 9/18 Exp. call options, although their Theta is going to be a consideration for my timing, as it is -0.0719.

This means that the contracts will decay at a rate of ~7 cents/day.

There seems to be a slightly more bearish sentiment in existing options contracts, as the Open Interest on the same puts is a bit higher.

However, from the short-term perspective there seems to be a good chance that these will become in-the-money before then.

All-in-all, WYNN stock is worth taking a closer look at for both short-term & long-term traders.

*** I DO NOT OWN SHARES OF WYNN STOCK ***

Hyre Car Inc. HYRE Stock Analysis

HyreCar Inc. engages in the peer-to-peer ridesharing business, and trades under the ticker HYRE.

HYRE stock closed at $18.60/share on 8/6/2021, while signaling that there is more bullish momentum to come.

HyreCar Inc. HYRE Stock Technical Performance For The Last Year

HYRE Stock Price: $18.60

10 Day Moving Average: $17.33

50 Day Moving-Average: $18.78

200 Day Moving-Average: $11.69

RSI: 53.7

MACD: -0.4

On Friday, HyreCar stock completed a bullish MACD crossover, a sign that there is more positive momentum to come.

Additionally, they also have an even RSI at ~54, showing no signs of being overbought nor oversold.

HYRE stock’s price is poised to break through the 50 Day Moving-Average & their 10 Day MA is only 9% below.

Once they make the crossover, it will provide additional momentum pushing the stock price higher.

While HYRE has had weaker than usual trading volume the past few months, it has continued the uptrend that began on a gap up day in May.

Short-term traders can take advantage of this momentum either by purchasing common shares or options.

I am looking at the $17.50 strike calls with the 8/20 expiration, as they have healthy open interest & volume, so they should be an easy position to exit from.

The $20 strike price has more open interest & volume, but are too far out-of-the-money for my liking at the moment.

I may think to purchase some of them with the 9/17 strike price though.

The sentiment the options are showing me is heavily bullish, as there is far less open interest on any of the in or at the money puts vs. calls.

From a long-term perspective, this seems more like a speculative investment.

Their P/B is high at 19, and they have no P/E(ttm), with a high level of Debt/Equity.

However, this doesn’t mean investors should necessarily shun HYRE stock, but be mindful of its speculative status in the long-run.

Overall, there seems to be some great opportunity for short-term oriented & options traders, making HyreCar Inc. stock worth taking a closer look at.

*** I DO NOT OWN SHARES OF HYRE STOCK ***

Senseonics Holdings Inc. SENS Stock

Senseonics Holdings Inc. stock trades under the ticker SENS & creates implantable glucose monitoring systems for folks with diabetes.

SENS stock closed at $3.14/share on 8/5/2021, and looks poised to continue climbing higher on technical strength.

Senseonics Holdings Inc. SENS Stock Technical Performance For The Last Year

SENS Stock Price: $3.14

10 Day Moving-Average: $3.06

50 Day Moving-Average: $3.17

200 Day Moving-Average: $2.16

RSI: 51

MACD: -0.029

Yesterday SENS completed a bullish MACD crossover, a signal of technical strength.

In addition to their MACD crossover, the 10 Day Moving-Average is ~3% away from crossing the 50 Day MA, which will help propel the price higher.

Most importantly, the RSI is neutral, showing that their share price is neither overbought, nor oversold.

Senseonics Holdings Inc.’s stock has traded on below average volume recently, while being constricted to a tight price range since July.

SENS options look to be very liquid, with all of of the at-the-money range calls & puts having good volume of Open Interest.

However, their implied volatility is high, which may make some options traders more likely to want to sell vs. buy.

I am looking at the $3 & $3.50 strike prices, over the 8/20 & 9/17 expiration dates.

These seem to be a realistic range for that time period, unlike the $4 calls.

From a long-term traders perspective, SENS stock looks to continue climbing.

While it does not have a positive P/E (ttm), their chart looks to have long-term positive momentum.

Furthermore, with how many people are impacted by the disease that they are fighting, there is great opportunity for growth as the company matures & solves their problems.

Overall, SENS stock looks to be an interesting opportunities for both long-term & short-term traders alike & is worth taking a closer look at.

*** I DO NOT OWN SHARES OF SENS STOCK ***

Evolus Inc. EOLS Stock Analysis

Evolus Inc. stock trades under the ticker EOLS & is a medical aesthetics company.

EOLS stock closed at $11.40/share on 8/4/2021, after completing a bullish MACD crossover, a sign of technical strength with more growth to come.

Evolus Inc EOLS Stock Technical Performance For The Last Year

EOLS Stock Price: $11.40

10 Day Moving-Average: $10.98

50 Day Moving-Average: $11.84

200 Day Moving-Average: $8.61

RSI: 49

MACD: -0.264

EOLS’s RSI is slightly oversold at 49, showing that there is more room to breakout higher safely.

Additionally, the 10 Day Moving-Average is ~8% away from crossing the 50 Day MA.

The share price is ~3% from testing the 50 Day MA, which will also help push the price level higher & add to positive momentum.

From a short-term perspective this looks great for EOLS, similarly from a longterm perspective their share price is well above their 200 Day Moving-Average.

For options traders, the $10 Calls have an attractive Delta of 0.759.

Additionally, their Theta is -0.026 for the 8/20 expiration date.

I’ll also be looking at the $12 puts with the same expiration, or the 9/17 expiration.

Overall, it appears that Evolus Inc. stock has more room to run both in the near-term & long-term & should be on any trader/investor’s radar for additional research.

*** I DO NOT OWN SHARES OF EOLS STOCK ***

Express Inc. EXPR Stock Analysis

Express Inc. stock trades under the ticker EXPR & is an apparel retail company.

EXPR stock closed at $5.14/share on 8/3/2021, with some short-term bullish signals traders may be interested in taking advantage of.

Express Inc EXPR Stock Technical Performance For The Last Year

EXPR Stock Price: $5.14

10 Day Moving-Average: $4.94

50 Day Moving-Average: $5.24

200 Day Moving-Average: $3.14

RSI: 51

MACD: -0.089

Yesterday EXPR completed a bullish MACD crossover, signalling an uptrend & bullish sentiment.

With a mid-range RSI, I’ll be watching the $5.50 resistance level, which should be tested within the coming days/week.

The price currently is testing the 50 Day Moving-Average, with the 10 Day MA lagging the 50 by ~6%.

Another thing of note regarding EXPR stock is that their earnings call is scheduled for 3 weeks from today, which may find traders trying to get in ahead of a potential beat.

From an options perspective, I like the $5 strike for the calls, as all of their August expiration dates have healthy Open Interest & Volume levels, despite the stock itself’s common share volume being lower than average for the year.

I also like the $5 puts, and may think to purchase both, using different price levels for different expiration dates based on how their price performs over the next couple of days.

From a long-term standpoint, Express Inc. stock doesn’t offer a dividend yield, and as we are at all-time highs I would wait to purchase shares as there is no cushion for investors in the event of a correction.

Overall, EXPR stock offers short-term traders some opportunity for profits, and is worth exploring introductory price levels for longer-term investors after a shakeout.

*** I DO NOT OWN SHARES OF EXPR STOCK ***