Direxion Daily FTSE China Bear 3x Shares YANG ETF Analysis

Direxion Daily FTSE China Bear 3x Shares ETF trades under the ticker YANG, and has recently shown technical movement that makes it worth considering for a short-term trade.

YANG closed at $12.76, after climbing 6.69% on 1/29/2021, with a bullish MACD crossover, rising volume & a low RSI.

Direxion Daily FTSE China Bear 3x Shares ETF YANG Technical Performance For The Last Year

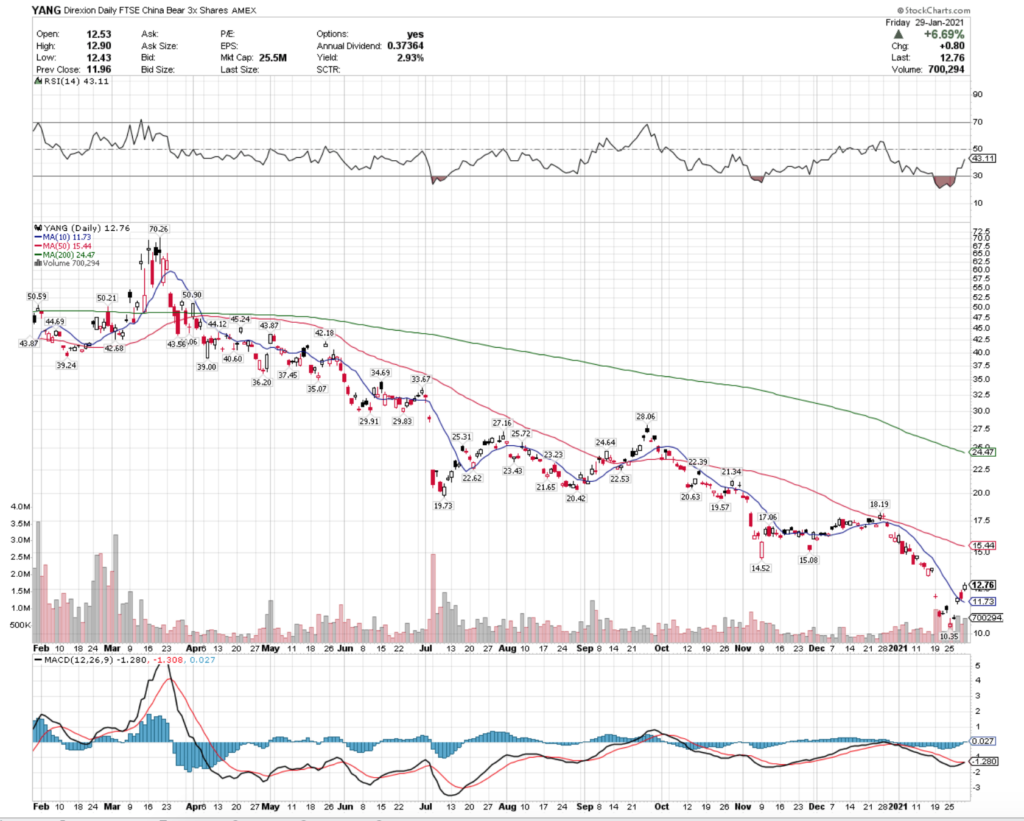
YANG Share Price: $12.76

10 Day Moving Average: $11.73

50 Day Moving-Average: $15.44

200 Day Moving-Average: $24.47

RSI: 43

YANG’s volume has been increasing recently compared to the prior 90 day’s average, and the recent price crossing the 10 Day Moving-Average shows that there may be some more momentum to continue the growth in price.

Direxion Daily FTSE China Bear 3x Shares ETF has options; I like the $10-11 calls & puts.

Given that this is a 3x levered fund, it may be riskier to sell the puts, whereas owning them will provide more cushion, something that also is worth considering for an ETF that tracks China.

*** I DO NOT OWN SHARES OF YANG ETF ***

Charter Communications Inc. CHTR Stock Analysis

Charter Communications Inc. stock has recently shown great technical strength, making it worth considering for a short-term trade opportunity.

CHTR stock closed at $650.43/share on 1/21/21, while completing a bullish MACD crossover into a new uptrend.

Charter Communications Inc. CHTR Stock Technical Performance For The Last Year

CHTR Stock Price: $650.43

10 Day Moving-Average: $632.33

50 Day Moving-Average: $646.22

200 Day Moving-Average: $584.68

RSI: 55

Given CHTR’s low RSI value & recent volume behind their upwards movement, this trend looks to have more room to run.

CHTR stock also has options that traders can take advantage of.

Looking at the 2/19 expiration date, the $650 calls are just in-the-money, although they may be lacking in liquidity as there is a very low open interest (13 as of writing this), which is something traders should be mindful of.

In the case of CHTR I’m not certain that I would be quick to sell any puts here, as in the event of a 10% correction, their price would be flirting with their 200 Day Moving-Average on a downtrend, which would be a bearish flag.

If I were going to, I may think to look at the $540 range for a strike price, which would give you an additional ~7% cushion for further declines in price.

All-in-all, Charter Communications Inc Stock looks to have a lot of good opportunities for short-term traders to take advantage of.

*** I DO NOT OWN SHARES OF CHTR STOCK ***

National Beverage Corp. FIZZ Stock Analysis

National Beverage Corp. stock trades under the ticker FIZZ & has recently shown technical strength, making it worth examining closer for a short-term trade opportunity.

FIZZ stock closed at $88.67 on Friday 1/15/2020, while making a bullish MACD crossover & breaking above their 50 day moving-average bullishly.

National Beverage Corp. FIZZ Stock Technical Performance For The Last Year

FIZZ Stock Price: $88.67

10 Day Moving-Average:$83.31

50 Day Moving-Average: $85.82

200 Day Moving-Average: $67.37

RSI: 58

FIZZ’s 10 Day Moving-Average is 3% away from a bullish crossover of their 50 Day Moving-Average, which seems unavoidable given their price-per-share is 3%+ higher than the 50 Day MA.

FIZZ stock has options that traders can capitalize on, with the $90 2/19 expiration calls looking particularly appealing, as they’re ~1% away from being at-the-money.

If one were thinking of selling puts for the same expiration, the $75 strike price may be best, as should there be a normal 10% correction the $80 strikes would be at-the-money, while the $75’s would still need further decline in price.

Even factoring in their beta of 1.37, that still looks like the safer level for selling.

Overall, National Beverage Corp.’s stock looks to still have room to move to the upside, and should be on any short-term trader’s radar.

*** I DO NOT OWN SHARES OF FIZZ STOCK ***

Carrols Restaurant Group, Inc. TAST Stock Analysis

Carrols Restaurant Group, Inc. stock trades under the ticker TAST, and is currently trading at $6.78/share.

TAST stock is set up for potential upside movement, with their bullish MACD cross yesterday, and is currently on a 5.6% upswing day as I write this post (late, yes I know…)

Carrols Restaurant Group Inc TAST Stock Technical Performance For The Last Year

TAST Stock Price: $6.78

10 Day Moving-Average:$6.34

50 Day Moving-Average: $6.27

200 Day Moving-Average: $5.50

RSI: 59

TAST stock looks to have some room to run in the short-to-medium term, that can be beneficial to traders of the common shares & options alike.

Their $7.50 calls expiring on 2/19, along with the $7.50 puts are likely the best place to be looking, given the lower level of open interest & volume that I am seeing for the in-the-money $5 calls.

All-in-all, traders should be able to take advantage of the momentum that Carrols Restaurant Group Inc. stock is currently experiencing, and be able to take home some short-term gains on TAST.

*** I DO NOT OWN SHARES OF TAST STOCK ***

Immunovant Inc. IMVT Stock Analysis

Immunovant Inc. stock trades under the ticker IMVT & closed at $46.77/share on 1/11/2021.

After recent technical movement, IMVT stock is worth taking a closer look at for a short term trade opportunity.

Immunovant Inc. IMVT Stock One Year Technical Performance

IMVT Stock Price: $46.77

10 Day Moving-Average: $47.25

50 Day Moving-Average: $48.50

200 Day Moving-Average: $32.80

RSI: 46

Immunovant Inc. stock has been stuck relatively rangebound for the last few months, and the overall market movement will likely dictate its next move.

IMVT’s MACD is also interesting, as it looked ready for takeoff until yesterday, whereas now it could be replicating its moves from mid-December, where the MACD almost had a bullish cross, but ultimately had a significant downtrend, while prices remained rangebound (which also happened in August, citing the bottom of the chart above).

Despite a few recent consecutive strong days, yesterday it far outpaced the NASDAQ on a downward move, losing 5%+, VS. QQQ’S loss of 1.45%.

IMVT stock has options, and I am favoring the $45 strike price, looking for February’s expiration date.

Given the general market’s iffy footing, the $45 puts look appealing, as they can be bought at a 3:2 ratio vs. the $50, while still saving ~14% of capital, which enables safer hedging than holding 2 $50 contracts.

On the upside, I still also like the $45 calls, given how tightly range bound they have been recently, and the average percentage of their gaps to the upside & downside, with 5 weeks until expiration.

The one caveat is that the NASDAQ itself is not looking as technically solid as it has all year, so there may be more downside than upside here, but given that nature of IMVT stock’s strength this year, traders of options have a great opportunity, and traders of common shares should be on the lookout for when they see a bottom.

*** I DO NOT OWN SHARES OF IMVT STOCK ***

Citizens, Inc CIA Stock Analysis

Citizens, Inc. stock trades under the ticker CIA, and closed at $6.13/share on 1/7/2020.

CIA stock has recently shown strong technical performance, including a recent MACD bullish-crossover, making it worth considering for a short-term trade.

Citizens, Inc. CIA Stock Technical Performance For The Last Year

CIA Stock Price: $6.13

10 Day Moving-Average: $5.85

50 Day Moving-Average: $6.06

200 Day Moving-Average: $5.86

RSI: 54

CIA’s 10 Day Moving-Average is about to bullishly cross its 200 Day MA, and it is in a prime position to also cross the 50 shortly thereafter.

CIA has options that traders can capitalize on in addition to their common shares.

With their MACD crossover & RSI being right in the middle range, there seems to be bullish upside to holders of the common stock.

From an options perspective, I like the $5 calls, as the $7.50’s, as there would need to be tremendous upside (~22%) from the current price for those to go in-the-money.

The current premium on the $5 puts is low, so not certain it would be worth selling those, nor do I think there would be many interested buyers, given that the current open interest is 0, and for these to go in-the-money it would require a similarly large drop in share price (~18%).

Overall though, it does appear that Citizen’s, Inc. stock has more room to run to the upside, and should be something on any short-term trader’s radar.

*** I DO NOT OWN SHARES OF CIA STOCK ***

Bed, Bath & Beyond Stock Analysis

Bed, Bath & Beyond stock has recently shown technical strength that is worth taking a closer look at for a short-term trade.

Trading under the ticker BBBY, they closed yesterday at $19.76/share, on strong volume for the last few months, indicating that there is at least short-term momentum for further price movement.

Bed, Bath & Beyond BBBY Stock Technical Performance For The Last Year

BBBY Stock Price: $19.76

10 Day Moving-Average: $18.75

50 Day Moving-Average: $20.10

200 Day Moving-Average: $12.86

RSI: 54

Their MACD is beginning to curl up, showing signs of a possible breakout to the upside, which is also confirmed by the price about to cross the 50 Day Moving-Average, bringing the 10 Day Moving-Average along with it, a bullish signal.

Since BBBY stock also has options to trade, buying the $19 calls with the 1/8 expiration seems appealing in this instance, while selling the $19 puts with the same expiration date can also yield a little more money.

Overall, it appears that Bed, Bath & Beyond stock has more room to run, making a great opportunity in the near-term for traders of common shares & options alike!

*** I DO NOT OWN SHARES OF BBBY STOCK ***

Elanco Animal Health Inc. ELAN Stock Analysis

Elanco Animal Health Inc. stock trades under the ticker ELAN, and closed at $29.95/share on 12/16/2020.

ELAN stock is worth taking a closer look at from a short-term trade perspective, as they recently had a bullish MACD crossover – particularly for options traders.

Elanco Animal Health Inc. ELAN Stock Technical Performance For The Last Year

ELAN Stock Price: $29.95

10 Day Moving-Average: $29.35

50 Day Moving-Average: $30.76

200 Day Moving-Average: $25.33

RSI: 50

With an RSI that is even at 50, and the bullish MACD crossover, it looks like ELAN has some room to run.

The $30 calls are at-the-money as of the premarket, with a delta of 0.49, and their $29 calls offer a higher delta at 0.83, with less theta risk at only -0.07 (vs. -0.11 for the $30’s).

From a puts perspective, the $32 & $33 options seem to make the most sense if you’re viewing the December 18th expiration (tomorrow), as they are already in the money.

Looking into January expirations though, there may be some value to the $31 puts while ELAN stock tries to continue climbing, while establishing a trading range.

*** I DO NOT OWN SHARES OF ELAN STOCK ***

Catalent, Inc. CTLT Stock Analysis

Catalent, Inc. stock trades under the ticker CTLT, and closed at $100.01/share on 12/15/2020.

CTLT’s stock has shown technical strength of recent, with their MACD lines just crossing in an uptrend & an RSI of 57, making them worth looking at for a short-term trade.

CTLT’s 10 Day Moving-Average is also on the verge of crossing their 50 Day Moving-Average, signaling more bullish strength to run.

Catalent, Inc. CTLT Stock Technical Performance For The Last Year

CTLT Stock Price: $100.01

10 Day Moving-Average: $95.04

50 Day Moving-Average: $96.01

200 Day Moving-Average: $78.35

RSI: 58

CTLT stock has options, with $100 & $105 calls being the at-the-money & just out-of-the-money options worth looking at. The $105 calls would be best suited for January, as the December options expire in 2 days.

From the perspective of their puts, the $110’s & $105’s look best from a December standpoint, although the next level of strike prices ($115) may have to be evaluated for January, as they still have bullish legs to run on.

*** I DO NOT OWN SHARES OF CTLT STOCK ***

First Acceptance Corp. FACO Stock Analysis

First Acceptance Corporation stock trades under the ticker FACO & closed at $1.39 on 12/14/2020.

FACO stock’s technicals are showing strength, with a bullish MACD crossover yesterday, as well as a bullish curl up of their 10 Day Moving-Average, set to cross their 50 Day Moving-Average; and their RSI is at a reasonable level.

First Acceptance Corp. FACO Stock Technical Performance For The Last Year

FACO Stock Price: $1.39

10 Day Moving-Average: $1.23

50 Day Moving-Average: $1.28

200 Day Moving-Average: $0.90

RSI: 63

While FACO stock does not have options, there still looks to be some opportunity for a short-term trader to capitalize on their stock performance.

I would be focused on their filled green candlestick price levels (black in the chart above), as it looks like they’re finding resistance at $1.50, but with how often they’ve knocked on the door at that level, there looks to be some form of opportunity.

Overall, First Acceptance Corporation stock looks to have some room for opportunity for a short-to-medium-term trade.

*** I DO NOT OWN SHARES OF FACO STOCK ***