Fuel Tech, Inc. FTEK Stock Analysis

Fuel Tech, Inc. stock trades under the ticker FTEK & has recently broken out (on 11/24/20202).

FTEK stock shows great opportunity for a short term trading perspective, both for holders of common shares & options traders.

FTEK closed at $4.40 on 11/30/2020, and still looks to have more room to run.

Fuel Tech, Inc. FTEK Stock Technical Performance For The Last Year

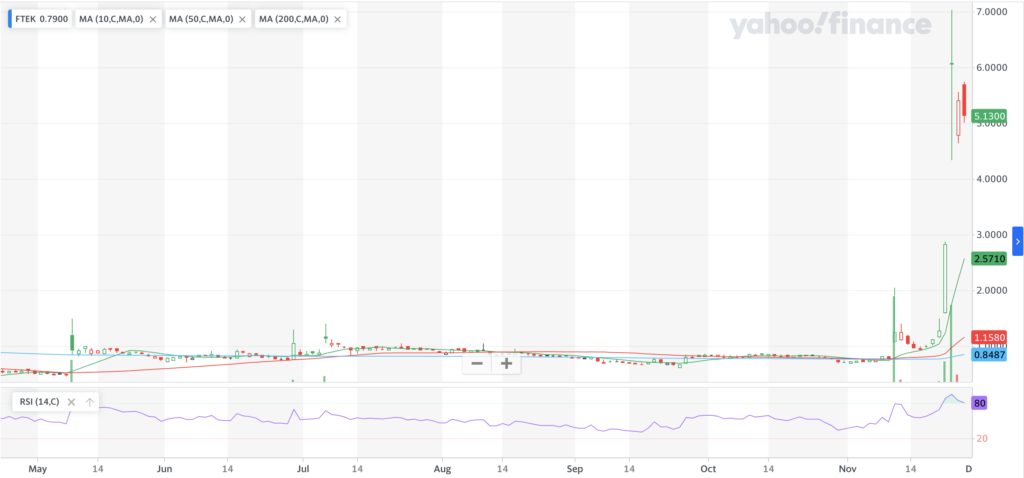
FTEK Stock Price: $4.40

10 Day Moving-Average: $2.57

50 Day Moving-Average: $1.16

200 Day Moving-Average: $0.85

RSI: 80

While their RSI of 80 is high, it will die down in near time while FTEK stock establishes its new range.

From an options perspective, I am looking at the $5 puts & the $4 calls at the moment while it sorts itself out.

There’s still room for upward growth, but the charts are showing that there will be some profit taking before that happens.

Today’s futures are signaling a green day, but FTEK may be sitting it out, making it worth looking at entry opportunities for common shareholders.

I’ll be looking to play the options I outlined above.

*** I DO NOT OWN SHARES OF FTEK STOCK ***

Tuniu Corporation, TOUR Stock Analysis

Tuniu Corporation stock has recently shown great technical growth & performance, trading under the ticker TOUR.

TOUR stock closed at $3.19/share on 11/27/20, preparing to close out November as a very strong month.

TOUR has options, in addition to common shares, making opportunities for all types of traders to profit from their stock performance.

TOUR Stock Price: $3.19

10 Day Moving-Average: $2.40

50 Day Moving-Average: $1.36

200 Day Moving-Average: $1.17

RSI: 77

While their RSI of 77 is still high, Tuniu corporation’s stock still looks to have legs to run, as it establishes a new range.

Traders of the common shares should be able to find advantageous entry points this week.

TOUR’s $2.50 calls are already in-the-money, with the $5 strike price being the next level.

Given that in the pre-market they are already beyond last week’s resistance level, the $5 calls aren’t as out of the question anymore, with a delta of .364.

From a puts perspective, I’d be favoring the $5 strike price, at the moment, unless they outperform that $5 mark, in which case the $7.50 puts will become cheaper.

*** I DO NOT OWN SHARES OF TOUR STOCK ***

Riot Blockchain, Inc. RIOT Stock Analysis

Riot Blockchain, Inc. stock trades under the ticker RIOT & closed for trading at $7.23 on 11/23/2020.

RIOT stock has recently been on a tremendous upswing, and looks to have more strength carrying it into the near future, making it worth consideration for a short-term trade.

Riot Blockchain, Inc RIOT Stock Technical Performance For The Last Year

RIOT Stock Price: $7.23

10 Day Moving-Average: $4.57

50 Day Moving-Average: $3.47

200 Day Moving-Average: $2.41

RSI: 72

With an RSI of 72, there is still room for RIOT to run in the next day or two, making a buying opportunity for common shares & call options alike.

I am favoring the $7 calls, and the $8 puts for RIOT stock options, as today’s pre-market pricing shows that there is still strength to be had, but within the next few days the puts will prove valuable as a hedge.

I’ll be watching the chart closely over the next week, but looking to purchase the options mentioned above this morning, favoring the calls.

As always, I encourage you to research RIOT stock before purchasing, but this does look to have some great potential in its current state.

*** I DO NOT OWN SHARES OF RIOT STOCK ***

Blink Charging Co. BLNK Stock Analysis

Blink Charging Co.’s stock trades under the ticker BLNK & has recently shown excellent technical strength, making it a prime candidate for a short to mid-term trade.

BLNK Stock closed at $22.67/share on 11/20/2020, after impeccable performance from 11/16/2020 onward.

BLNK Stock Price: $22.67

10 Day Moving-Average: $13.12

50 Day Moving-Average: $9.76

200 Day Moving-Average: $5.54

RSI: 87

While BLNK stock’s RSI is awfully high, there is still room for them to run, although there will likely be some form of a pullback before the common shares look to be priced at a good deal.

For anyone trading the common shares, I would be closely eyeing the charts if I dove in before seeing that RSI drop a bit more/prices correct and even out into a range.

For traders interested in BLNK options, the $22.50 or $25 calls are where I am looking, especially given their pre-market strength (+14% more as I write this).

*** I DO NOT OWN SHARES OF BLNK STOCK ***

ReneSola Ltc. SOL Stock Analysis

ReneSola stock trades under the ticker SOL, and closed at $5.32/share on 11/20/2020.

Since September they’ve been steadily climbing higher, with a particular noteworthy positive day on 11/13/2020.

ReneSola Ltd. SOL Stock Technical Performance For The Last Year

SOL Stock Price: $5.32

10 Day Moving-Average: $4.46

50 Day Moving-Average: $3.24

200 Day Moving-Average: $1.79

RSI: 72

SOL stock’s moving averages still indicate there this is more room for their share price to run.

From an options perspective, the $5 strike price for the puts & calls seems like the safest idea, as the $2.50 & $7.50 options are awfully far from the current price of the underlying contract.

Purchasing the $5 call while it continues to climb, and then perhaps buying a $5 put, or selling a $7.50 call for the following month may be worth considering, pending your own due-diligence & following how their chart looks moving into 2021.

*** I DO NOT OWN SHARES OF SOL STOCK ***

Arcimoto Inc. FUV Stock Analysis

Arcimoto Inc. stock trades under the ticker FUV & closed for trading at $16 on 11/19/2020.

This morning in the pre-market it has shed 10% of its price, dropping to $14.35, opening up for a potential short-term trade opportunity.

While this mornings drop is likely the result of a blend of trimming after a 69%+ gain day & macro-market conditions pointing lower, FUV stock has displayed steady growth since May 2020.

Arcimoto Inc. FUV Stock Technical Performance For The Last Year

FUV Stock Price: $16.00

10 Day Moving-Average: $7.15

50 Day Moving-Average: $6.42

200 Day Moving-Average: $4.25

RSI: 75

For traders interested in the common shares, today may not be the best pullback to buy into, but looking at the charts should help you determine the right amount of risk there.

From an options perspective, the 12/18 $15 calls may carry more risk than is worth taking, so I may think to look at the $12.50’s or the $10’s.

The puts on the other hand look much cheaper than the calls, with the at-the-money $15’s marked only at $3.95 (before the market opens, this should change upon the open), which may offer an opportunity for a few extra percentage points for a quick trade on today’s weakness.

All-in-all, FUV stock & options should look to give traders some great opportunity for a short-term trade.

*** I DO NOT OWN SHARES OF FUV STOCK ***

Electrameccanica Vehicles Corp. SOLO Stock Analysis

Electrameccanica Vehicles Corp. stock trades under the ticker SOLO, and closed yesterday at $6.91/share (11/18/2020).

This morning it has continued to climb in pre-market trading, currently at $7.63.

Given its recent technical strength, there are some good short-term trade opportunities for SOLO stock.

SOLO Stock Price: $6.91

10 Day Moving-Average: $4.50

50 Day Moving-Average: $3.01

200 Day Moving-Average: $2.25

RSI: 83

While it may climb a little higher & test the $7 range, SOLO’s RSI is currently showing over-bought conditions at 83.

With this in mind, I would be interested in tracking both the calls & puts that focus around wherever their new range may emerge, based on whether or not they can cross the $7 mark cleanly today/tomorrow.

SOLO’s calls can either have a $6 or a $7.50 strike price, if I were looking at the ones with tomorrow’s expiration I would favor the $6 strike price, while for the next expiration date the $7.50’s show signs of being able to be in the money, given their early morning performance today.

One thing to keep in mind about the $7.50 call expiring on 12/18/2020 is that their Theta is currently -0.025.

Looking at the puts, The $7.50 or the $9 are likely the best option for SOLO for tomorrow’s expiration, but I may instead set my sights on the 12/18/2020 expiration, given that their current strength does not indicate that a put for tomorrow will play out favorably.

*** I DO NOT OWN SHARES OF SOLO STOCK ***

Five Prime Therapeutics, Inc. FPRX Stock Analysis

Five Prime Therapeutics, Inc. stock trades under the ticker FPRX & has recently shown great technical strength, closing for trading on 11/17/2020 at $20.20/share.

FPRX stock has quadrupled since 11/10/2020, which is indicated through its RSI, which is sending overbought signals.

While we can expect to see it decline a bit based on the RSI & the fact that its only hollow candlestick since it’s take-off day is red (down, but finished above where it opened), cautious entry from a common share position, and a position favoring puts for options is likely the best course of action.

Five Prime Therapeutics, Inc. FPRX Stock Technical Performance For The Last Year

FPRX Stock Price: $20.20

10 Day Moving-Average: $11.36

50 Day Moving-Average: $6.15

200 Day Moving-Average: $4.86

RSI: 86

From a calls perspective, I would be focused on the $20 or $17.50 strike prices, while focusing on the $20 or $22.50 strike prices on the puts.

This way your trade is protected from the overall market’s behavior, as something with an RSI this high may prove to be quite temperamental in the event of a major market drop.

Five Prime Therapeautics, Inc. stock is worth a closer look from a short-term perspective, whether via options or their common FPRX shares.

*** I DO NOT OWN SHARES OF FPRX STOCK ***

Moneygram International, Inc. MGI Stock Analysis

Moneygram International, Inc. stock trades under the ticker MGI & closed for trading at $8.10 on 11/16/2020.

MGI stock has recently displayed amazing technical strength, nearly doubling in price since 10/13/2020.

Moneygram has options, which are currently at-the-money when looking at the $8 strike prices.

Given the 0.56 delta of the $8 calls, I would look there and or at the $7 calls for the upside, with the same levels being targeted for the puts covering the downside, but favoring the higher strike price for the puts.

Moneygram International, Inc. MGI Stock Technical Performance For The Past Year

MGI Stock Price: $8.10

10 Day Moving-Average: $5.78

50 Day Moving-Average: $3.93

200 Day Moving-Average: $2.82

RSI: 80

MGI stock has great potential for a short-term trade, and is worth a second look by traders.

I’ll be looking at them today, as their pre-market price is down 2.5% to $7.90, making those strike prices even more attractive, but perhaps buying the calls & puts for different expiration dates.

*** I DO NOT OWN SHARES OF MGI STOCK ***

Infrastructure & Energy Alternatives Inc. IEA Stock Analysis

Infrastructure & Energy Alternatives Inc. stock trades under the ticker IEA, and closed at $11.17/share on 11/11/2020.

IEA stock does not have options, so traders have to trade common shares, which have shown strong technical performance recently.

IEA is up an additional 1.16% as of 9 am in the pre-market trading, and with the NASDAQ futures trending lower as we approach the open, there may be a better entry-point coming in the near future for a short-term trade.

Infrastructure & Energy Alternatives IEA Stock Past Year Technical Performance

IEA Stock Price: $11.17

10 Day Moving-Average: $8.42

50 Day Moving-Average: $6.56

200 Day Moving-Average: $3.80

RSI: 75

If they get swept up in the NASDAQ’s trends today, a decent entry point may present itself today, but otherwise I may think to wait a little longer to find a good price.

Overall, I will be watching IEA’s stock for the days to come for a trade opportunity.

*** I DO NOT OWN SHARES OF IEA STOCK ***