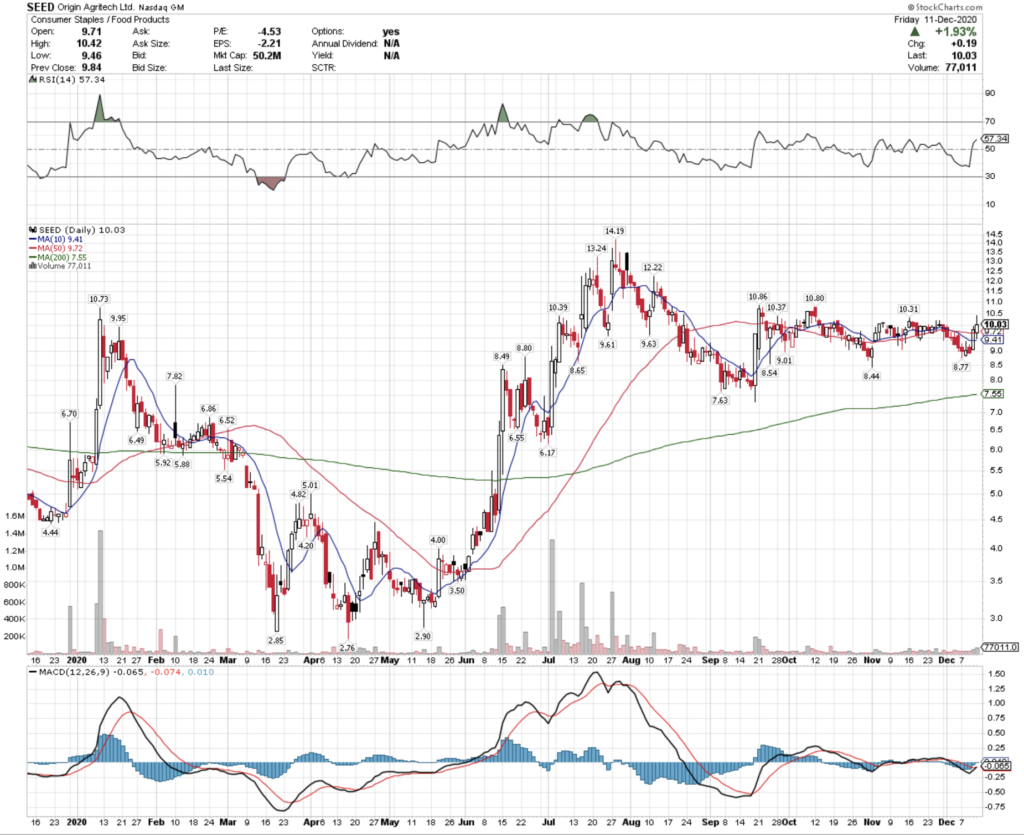
Origin Agritech Limited stock trades under the ticker SEED, and closed at $10.03/share on 12/12/2020.
SEED stock has recently shown technical strength that is worth a closer review from a short-term traders perspective.
SEED Stock Price: $10.03
10 Day Moving-Average: $9.41
50 Day Moving-Average: $9.72
200 Day Moving-Average: $7.55
RSI: 57
With their recent crossover in the MACD & low RSI, SEED stock looks to have some short-term momentum working for it that traders can take advantage of.
I will be eyeing an entry for SEED stock this morning, using common shares as unfortunately they do not offer options to trade.
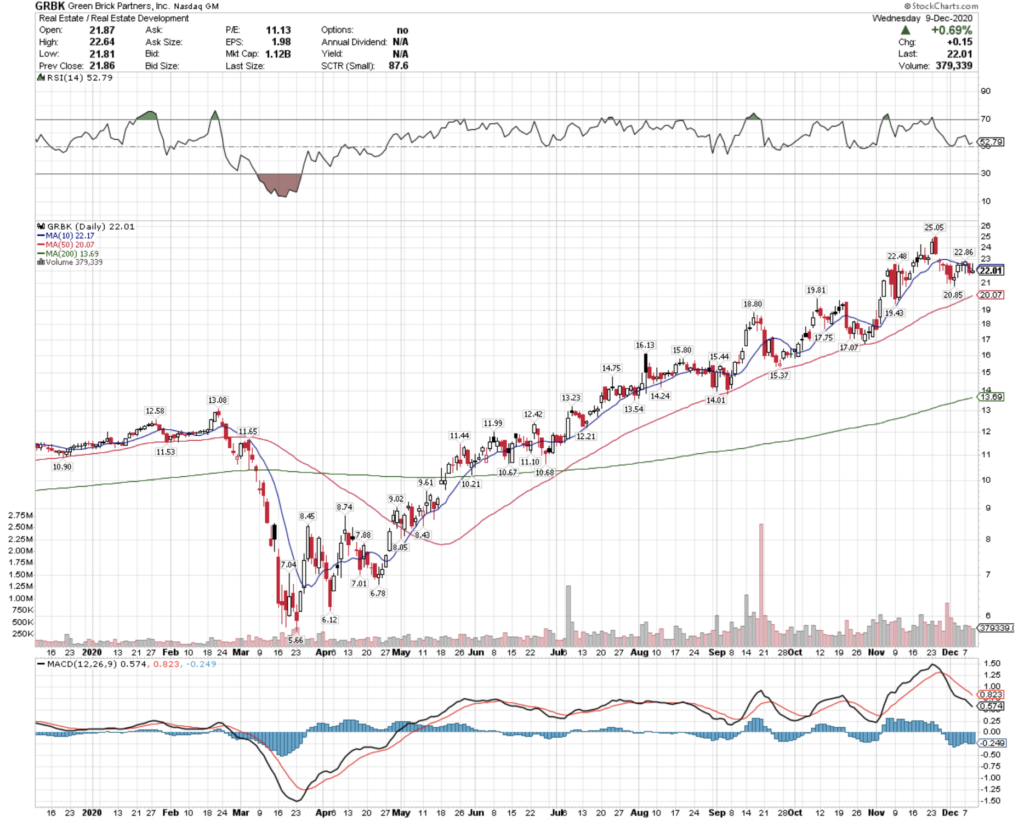
Green Brick Partners, Inc. stock trades under the ticker GRBK & closed at $22.01/share on 12/9/2020.
GRBK stock has had a strong year, as homebuilders have fared very well since COVID, & their stock & options look appealing to long-term & short-term traders alike.
GRBK Stock Price: $22.01
10 Day Moving-Average: $22.76
50 Day Moving-Average: $19.96
200 Day Moving-Average: $13.63
RSI: 52
For longer-term investors who are interested in the common shares, there may be some opportunity to get a good buy-in price on the horizon, as the shares have dropped a bit since Thanksgiving.
There looks to still be room to drop though when you examine the relationship between their moving averages, but from a longer-term perspective, if you’re looking to take advantage of the homebuilders boom, they present a solid opportunity.
In the short-term, the $20 GRBK calls look appealing, with a delta of 0.89, as I am not sure that the $22.50 calls will be worth the gamble when I see the MACD trend (bottom of the chart above).
I’m looking at the $22.50 puts (delta of -0.59) that are slightly in-the-money, as the next level down strike price is $20, which would require a >10% price correction to go into the money (delta of -0.15).
Overall, GRBK looks to have something to offer traders of all kinds, making it worth taking a closer look at.
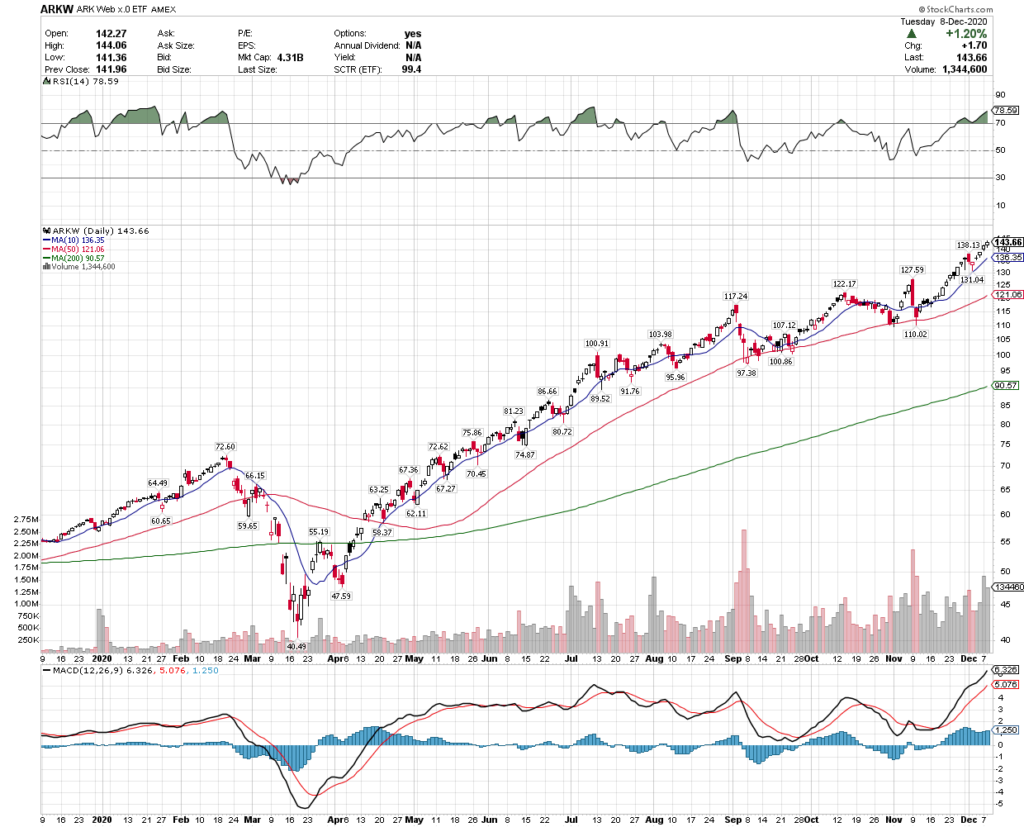
ARK Next Generation Internet ETF trades under the ticker ARKW, and closed at $143.66/share on 12/8/2020.
ARKW is an ETF that focuses on companies that are moving away from hardware & software, to focus more on running their platforms through the cloud & mobile, which is a fast growing industry.
ARKW ETF Price: $143.66
10 Day Moving-Average: $136.35
50 Day Moving-Average: $121.06
200 Day Moving-Average: $90.57
RSI: 78
ARKW’s RSI is pushing the range of overbought (80), and their MACD lines are beginning to come closer together, with the 10 Day Moving-Average being 5% below their price per share.
This signals that a quick profit may be made by owning the common shares, but traders need to be mindful of how fast that gap closes, in addition to the 50 Day Moving-Average, which is currently 16% less than the share price & 11% below the 10 Day Moving-Average.
As those numbers close, the trend is going to likely reverse, unless the overall market conditions manage to propel it higher.
ARKW ETF has options, with the $145 calls being at-the-money (delta is 0.45), and the $140 calls being slightly in-the-money (delta 0.69) if you’re looking for some padding from any potential shakeups in the near-term to prevent decay.
ARKW puts look appealing from the $150 (delta -0.56) or $145 standpoint (delta -0.8), which can serve as a good hedge for any shifts in market sentiment.
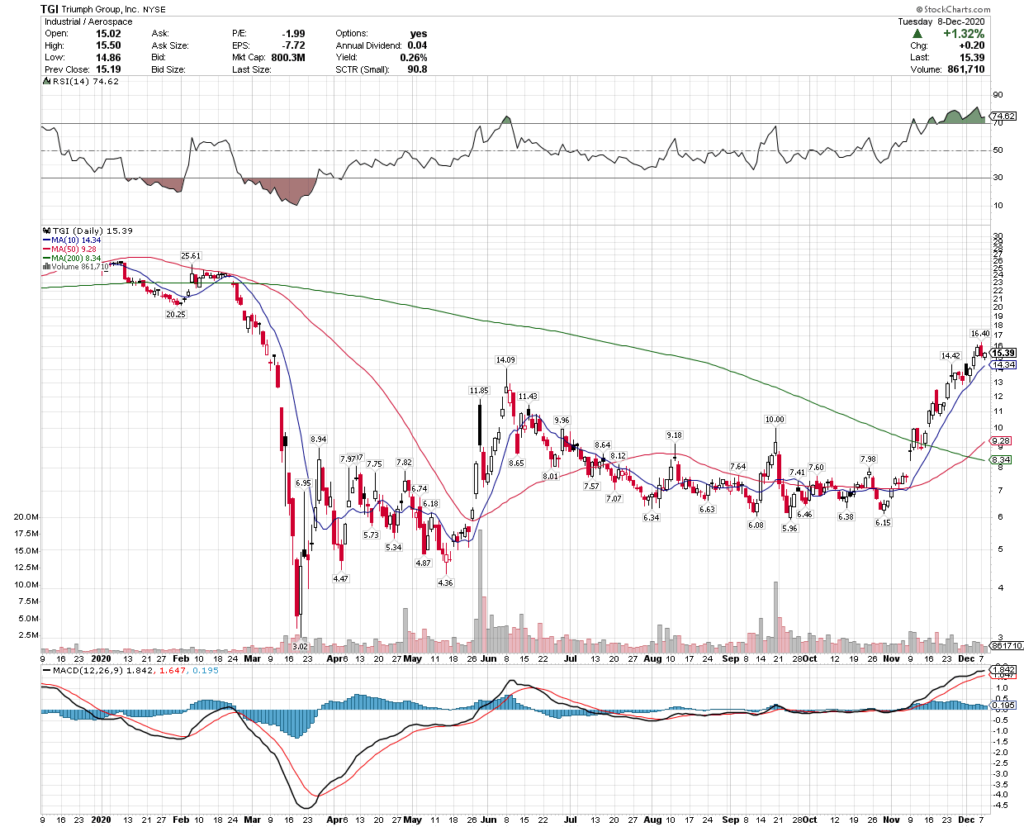
Triumph Group, Inc. stock trades under the ticker TGI & closed at $15.39/share on 12/8/2020.
TGI stock’s 50 Day Moving-Average recently crossed the 200 Day Moving-Average, showing technical strength that began with a major gap up on 11/9/2020.
TGI Stock Price: $15.39
10 Day Moving-Average: $14.34
50 Day Moving-Average: $9.28
200 Day Moving-Average: $8.34
RSI: 74
TGI’s RSI is a bit high, and their MACD trend looks like it may be overlapping/running out of steam, so traders who are only interested in the common shares may want to be looking to unload their shares quickly after getting a profit.
A well timed entry will be key in this scenario, as their 10 Day Moving-Average is 6% away from their price/share & will continue creeping higher.
From an options perspective, I would be purchasing calls that are already in-the-money to account for the pullback that may occur – the $15 calls have a delta of 0.59, and the $12.50 calls have a delta of 0.87.
From the puts perspective, I’m looking at the almost at-they-money $15 puts, with a delta of -0.41, and or the in-the-money puts at $17.50, whose delta is -0.77.
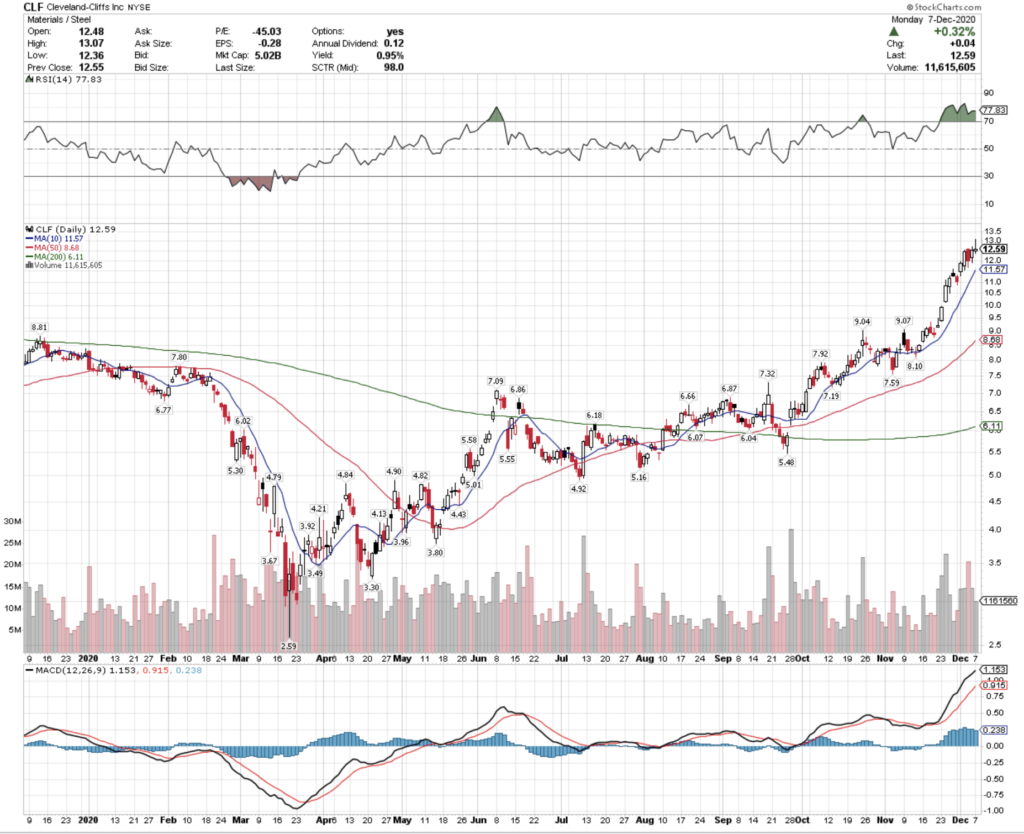
Cleveland-Cliffs Inc. stock trades under the ticker CLF & closed at $12.59/share on 12/7/2020.
CLF stock has been on a solid growth trajectory since mid-November 2020, and shows signs of profit opportunities for short & medium-term traders alike.
CLF Stock Price: $12.59
10 Day Moving-Average: $11.57
50 Day Moving-Average: $8.68
200 Day Moving-Average: $6.11
RSI: 77
With an RSI of 77, CLF is likely going to ease in price in the near-term, offering an opportunity for common-share investors to buy into a more advantageous price as it establishes its new range.
Their MACD trend suggests this as well, so I would be watching these numbers & lines while trying to decide an entry, if I were looking to go long the common shares.
In terms of options, I may look at the $12 calls that are already in the money with a delta that is greater than .74, and or the at-the-money $12.50 calls.
From a puts perspective, the $13 puts has a delta of -0.6956, suggesting that during the correcting of price range, a small amount of movement will move the price of your option in a large way, and as they’re quoted at $0.55 vs. $1.47 for the $14 puts (delta -0.88), you’ll be able to make a little more bang for your buck on that price range establishment.
Overall, CLF stock looks to still have legs under it to continue growing, and their options also look appealing.
I’ll be eyeing their options for a possible trade today & tomorrow.
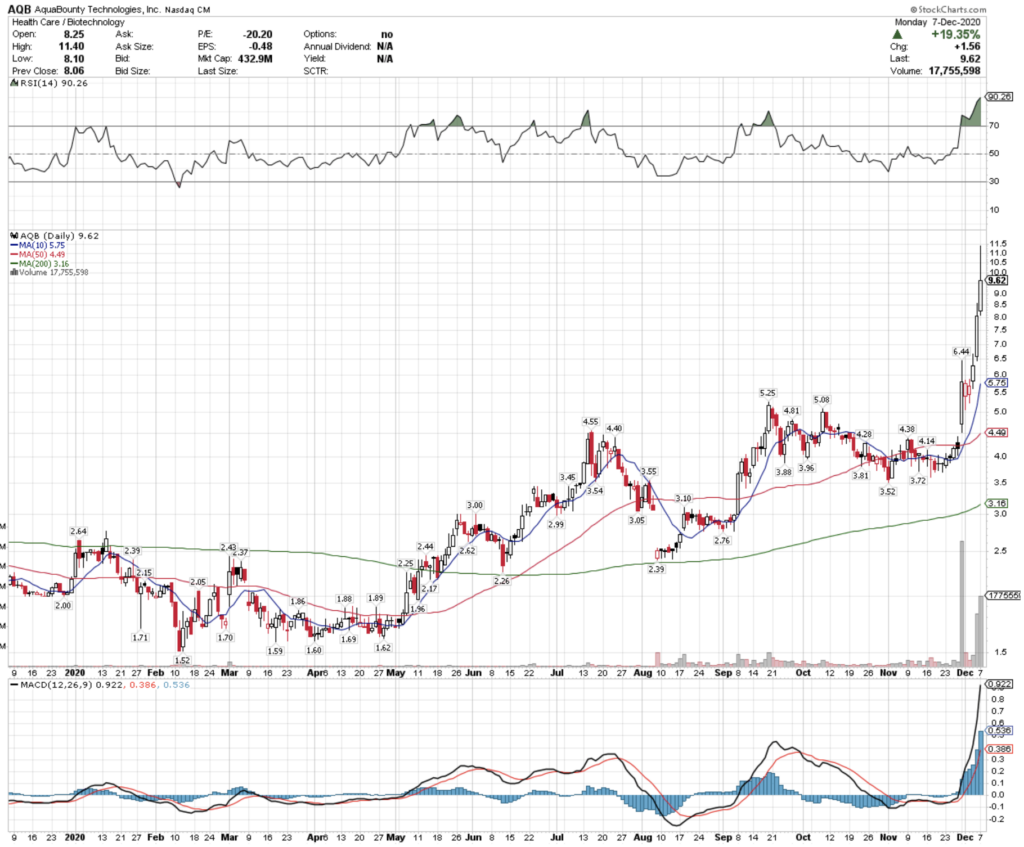
Aqua Bounty Technologies, Inc. stock trades under the ticker AQB & has broken out by over 100% since the end of October 2020.
AQB stock closed at $9.62/share on 12/7/2020 & looks to have more room to run as it establishes a new price range to trade in.
This means that there is an opportunity to short & medium-term traders to take advantage of profit opportunities from AQB stock & options.
AQB Stock Price: $9.62
10 Day Moving-Average: $5.75
50 Day Moving-Average: $4.49
200 Day Moving-Average: $3.16
RSI: 90
AQB stock’s RSI is overbought at 90, signaling that there will be some evening out in pricing as it establishes a new range after a very strong December performance that began with a high volume gap up on 11/30/2020.
If trading the common shares, I would wait for a little pullback before diving in, as with the overly inflated RSI there is room for the price to even itself out a bit before continuing to climb upwards.
From an options perspective, the $10 calls are just about at-the-money, while the closest strike price for in-the-money calls is $7.50; if you’re worried about AQB’s price being impacted by broader market conditions in the near-term, I would choose the $7.50 strike price.
From a puts perspective, given that the strike price options are $10 or $12.50 for at or in-the-money, the $10 is likely the best option based on prices, as in the pre-market on 12/8/2020 the $10 strike puts are $1.98, while the $12.50 are $3.95, making there more room to lose money on the $12.50’s.
All-in-all, AQB stock & options offer a lot of potential profit & growth opportunities for traders, and I will be watching their options today & tomorrow for an entry.
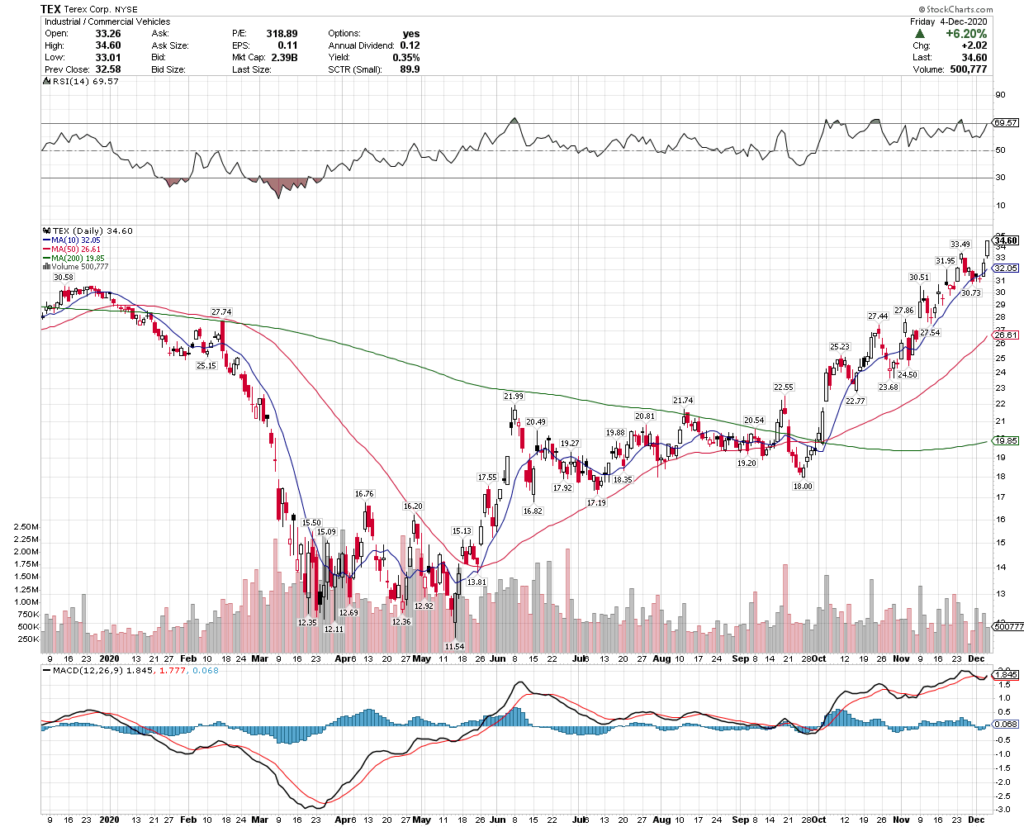
Terex Corporation stock trades under the ticker TEX & closed at $34.60 on 12/4/2020.
TEX stock has shown technical strength over the last couple of months & experienced a gap up day on 12/4 – making it worth taking a closer look at for short-term traders & investors alike.
Terex stock has options, making it easier for traders to capitalize on their short-term momentum, while also being able to hedge against any larger market declines that may impact their share price.
TEX Stock Price: $34.60
10 Day Moving-Average: $32.05
50 Day Moving-Average: $26.61
200 Day Moving-Average: $19.86
RSI: 70
While Terex’s RSI is a bit high at 70, there still looks to be room to climb for their shares.
I am looking at the $34 calls, as well as the $34 puts for a hedge, as they begin to establish a new range after their recent gap up.
Overall, TEX stock still seems to have room to run, giving traders of all different time frames an opportunity for profit.
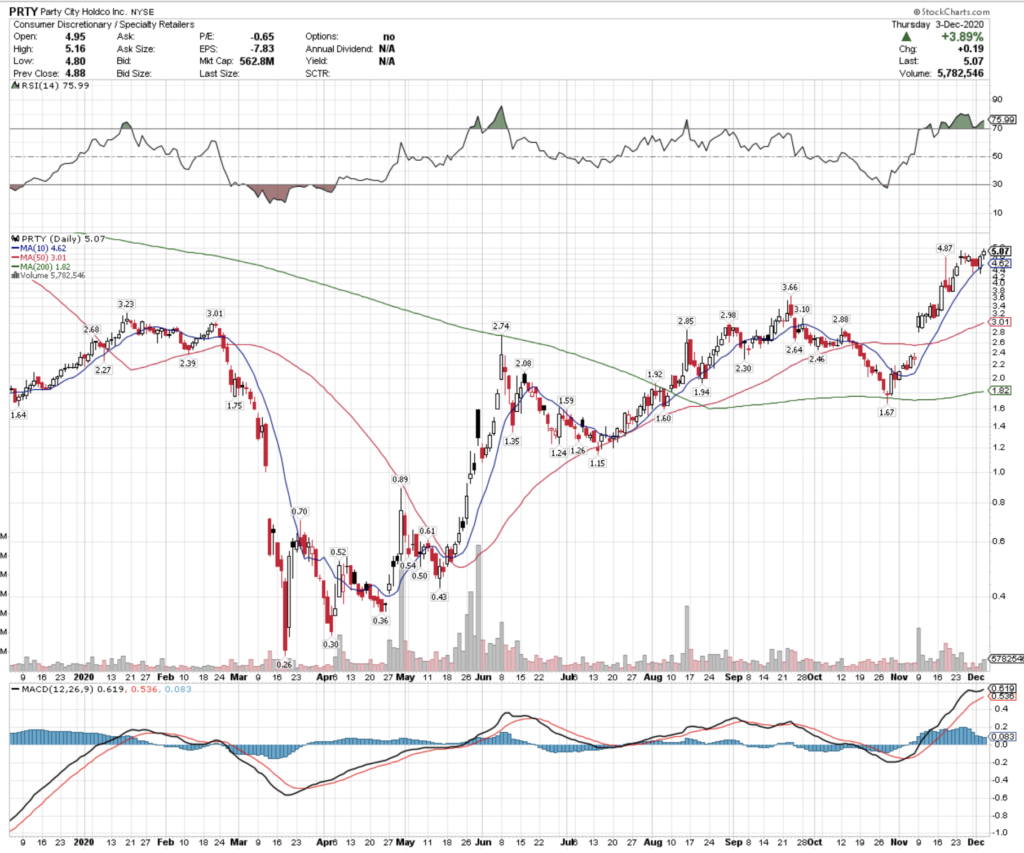
Party City Holdco Inc. stock trades under the ticker PRTY & closed at $5.07/share on 12/3/2020.
PRTY stock looks to have more room for growth in the near-term, which can be taken advantage of through common shares, or their options.
PRTY Stock Price: $5.07
10 Day Moving-Average: $4.41
50 Day Moving-Average: $2.94
200 Day Moving-Average: $1.80
RSI: 71
Today will likely be a bit of a risk off day, which will help their RSI go down to a more reasonable level that is less overbought.
With that in mind, short-term focused traders who want to use common shares of PRTY stock to profit from momentum may have an opportunity for entry today.
From an options standpoint, I like the $5 calls, and the $5.50 puts, as given that it’s Friday & there may be a risk-off day both are already in-the-money.
By having both you are protected to an extent from whatever movement that PRTY stock has today/Monday, depending on how long you want to hold them for.
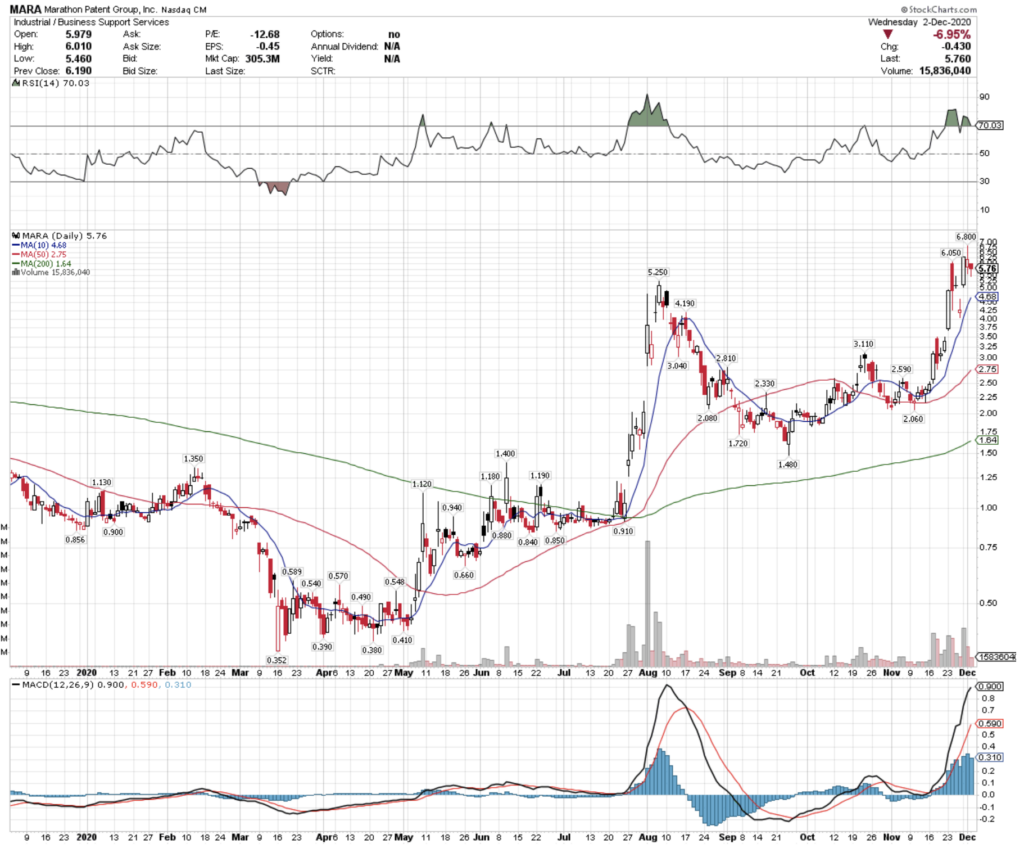
Marathon Patent Group, Inc. stock trades under the ticker MARA, closing on 12/2/2020 at $5.76/share.
After a couple of gap up days in November, MARA stock is performing well on a technical basis, making it worth considering for a short-term trade idea.
MARA stock also has options in addition to common shares.
MARA Stock Price: $5.76
10 Day Moving-Average: $4.68
50 Day Moving-Average: $2.75
200 Day Moving-Average: $1.64
RSI: 70
While its RSI is a bit steep at 70, the pre-market price says that MARA stock still has room to run.
The $6 calls for MARA look appealing, as they are about at-the-money in the pre-market already; although I may target the $5 calls for a little more money.
The puts will get cheaper as they continue to climb, although if they break their resistance point, the almost at-the-money $6 puts will likely not perform well, so I would wait until the $7.50 & $9 puts become cheaper.
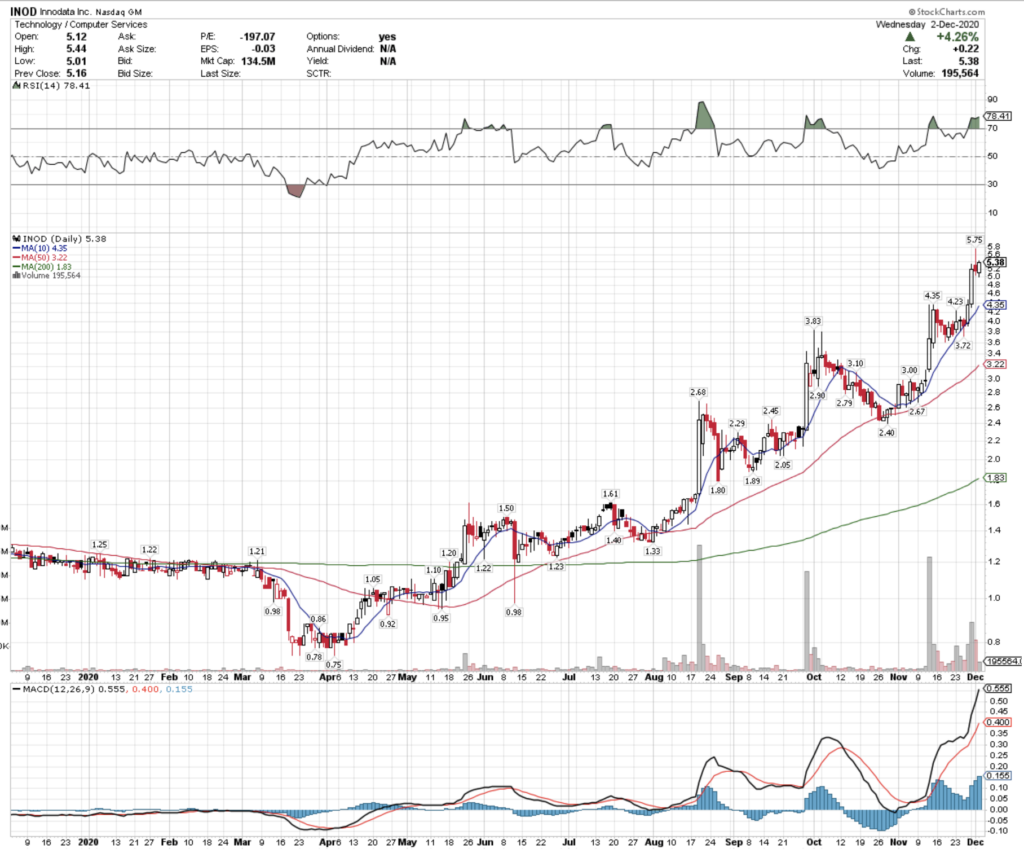
Innodata Inc. stock trades under the ticker INOD & closed at $5.38/share on 12/2/2020.
After a very strong November, INOD looks to have some opportunity for short-to-mid-term traders to capitalize on as we begin December.
INOD Stock Price: $5.38
10 Day Moving-Average: $4.35
50 Day Moving-Average: $3.22
200 Day Moving-Average: $1.83
RSI: 78
While INOD’s RSI will need to cool off a bit (signaling an overbought tendency at 78), traders still have room to capitalize on its upwards momentum.
INOD also has options, where traders should be looking at the $5 calls, and if feeling aggressive pursue the $7.50 calls.
The pre-market pricing on the $7.50 calls is insanely cheap, but you’ll be betting on no market forces dragging them down in the meantime.
From a puts perspective, the $7.50 is the best looking option, although that will likely not be a major play, unless there is some major market movement across the board, and or if you capitalize on some short-term hiccups while INOD stock establishes its range.