Titan International, Inc. TWI Stock Analysis

Titan International, Inc. stock trades under the ticker TWI & has recently shown technical strength, making it a prime candidate for a short-term trade.

TWI stock closed for trading at $4.99/share on 11/10/2020, putting them at-the-money for their $5 calls & puts.

After a big day on 11/9/2020, their price has outpaced their moving-averages, and their 10 day moving-average just recently crossed the 50 day moving-average, a bullish sign.

In terms of their options, I don’t see much action outside of the $5 range, as the closest other strike prices are $2.50 & $7.50, which are a pretty steep ways away from one another.

Titan International, Inc. TWI Stock Technical Performance Over The Last Year

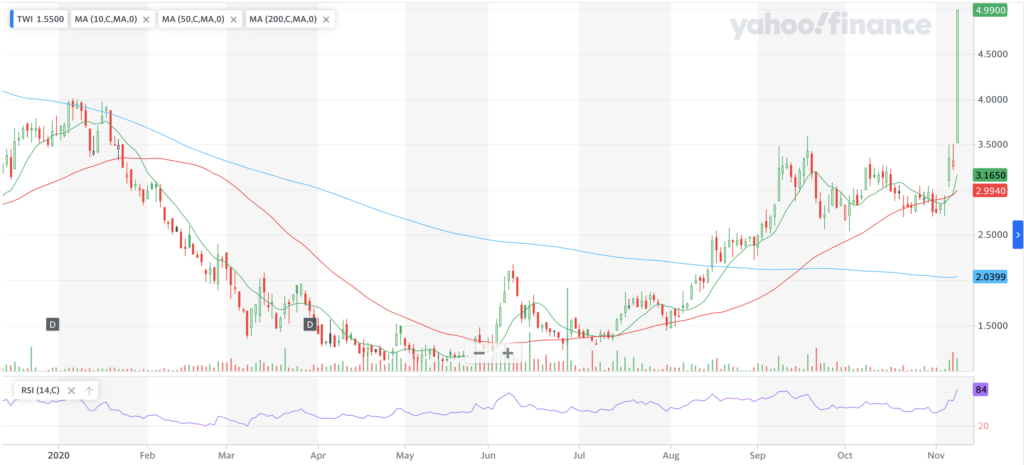
TWI Stock Price: $4.99

10 Day Moving-Average: $3.14

50 Day Moving-Average: $2.99

200 Day Moving-Average: $2.04

RSI: 82

With all of this in mind, it seems like there should be opportunity for short-term trading profits from the $5 strike price calls and puts for TWI stock.

*** I DO NOT OWN SHARES OF TWI STOCK ***

Cooper-Standard Holdings Inc. CPS Stock Analysis

Cooper-Standard Holdings Inc. stock trades under the ticker CPS, & had a sizable gap up on 11/6/2020.

CPS shares closed at $32.32 on 11/9/2020, as they continue to climb following that strong day of technical performance.

CPS stock has options, which I would be interested in looking at the $30 calls, as the next level up is a $35 strike price (I am looking at the 11/20/2020 expiration).

From a puts perspective, I would likely go with the inverse & purchase the $35 puts, as their delta is almost twice that of the $30 put options.

Cooper-Standard Holdings Inc. CPS Stock Technical Performance For The Past Year

CPS Stock Price: $32.32

10 Day Moving-Average: $18.13

50 Day Moving-Average: $16.10

200 Day Moving-Average: $14.73

RSI: 84

I will be looking at their options today, likely favoring the puts, while the RSI simmers down & a new range begins to be established, but that will all depend on how they open.

Looking at the spreads between moving-averages & Cooper-Standard Holdings Inc.’s stock price, there looks to be great opportunity for short-term traders in CPS.

For those who work more with common shares, I would be waiting to see how the price tapers off before finding my entry point, as the price is 78% higher than the 10 day moving-average.

*** I DO NOT OWN SHARES OF CPS STOCK ***

Snap Inc. SNAP Stock Analysis

Snap Inc. stock trades under the ticker SNAP & has recently displayed technical strength worth taking a loser look at for an options trade.

SNAP’s share price was $45.38 at the close of trading on 11/6/2020, making the $45 and $46 calls & puts the center of today’s focus (eyeing the 11/13/20 expiration date).

From a calls perspective, the $46 level has a bit more risk associated with it, as their Theta is a bit high, which is to be expected given that they’re not quite in-the-money.

Snap Corp. SNAP Stock Technical Performance For The Past Year

SNAP Stock Price: $45.38

10 Day Moving-Average: $41.82

50 Day Moving-Average: $29.86

200 Day Moving-Average: $20.97

RSI: 77

I’m not certain that they will have a lot of near-term strength, so I may think to purchase the already in-the-money $45 calls, and the $46 puts.

This could be particularly important as their RSI settles down & a new range is fully established.

The $45 calls are less risky in the event they fail, and the $46 puts are in the same boat.

SNAP is well worth a look by any near-term trader, and longer-term traders may think to look upwards if there are more lock-down measures implemented in the not too distant future.

*** I DO NOT OWN SHARES OF SNAP ***

Scholar Rock Holding Corporation, SRRK Stock Analysis

Scholar Rock Holding Corporation stock trades under the ticker SRRK, and has recently displayed technical strength that is worth taking a closer look at.

SRRK stock closed for trading at $42.10 on 11/6/2020, after going on a tear since 10/27/2020.

While Scholar Rock Holding Company’s stock does not have options, they are still showing enough strength that it may be worth looking to trade the shares for a short-to-mid-term play.

As a member of the NASDAQ index, SQQQ when ratio’ed properly could be seen as a good hedging opportunity.

Scholar Rock Holding Corporation, SRRK Stock Technicals For The Last Year

SRRK Stock Price: $42.10

10 Day Moving-Average: $38.28

50 Day Moving-Average: $20.28

200 Day Moving-Average: $16.54

RSI: 71

While the RSI is a bit high at the moment, the moving averages suggest that there is still near-term room to run for SRRK stock shares.

Traders might think to see how it functions in the pre-market tomorrow morning, before deciding to hop into a trade here.

Otherwise, given that levels that the moving-averages are at, there seems to be plenty of potential opportunities for dip-buying while the RSI settles down as there is still a lot of upwards pressure, courtesy of the trends.

Traders would be wise to eye the candlesticks while the figure out the entry point that they want to pursue, but SRRK is certainly something worth having on their radar at the moment.

*** I DO NOT OWN SHARES OF SRRK STOCK ***

Pinterest, Inc. PINS Stock Analysis

Pinterest, Inc. stock trades under the ticker PINS, and closed for trading at $59.58 on Tuesday 11/3/2020.

After gapping up on 10/29/2020, they have begun to establish a new range, after a very strong recovery from the depths of market lows in late February/March.

I have previous traded PINS call options over the summer months, and am seeing another opportunity to profit from calls & common shares of their stock again.

With the last few days showing a bit of weakness, there is a better shot for longer-term investors to get a better price as they continue to climb.

For a short-term trader using options, the $61 or $62 calls (they offer 11/6, 11/13 & 11/20 expiration) look most appealing, as currently in pre-market trading they are up another 3% from yesterday’s price, to $61.40.

Given that most traders aren’t able to buy yet for today, you can expect to see that go even higher in the early morning hours of today’s session.

Pinterest, Inc. PINS Stock Technical Performance For The Past Year

PINS Stock Price: $59.58

10 Day Moving-Average: $53.06

50 Day Moving-Average: $41.98

200 Day Moving-Average: $26.91

RSI: 68

Buying the $60 calls may be safer, but also be marked up to a premium not worth paying vs. the $61’s or $62’s.

Before buying any puts, I would look to see what their technical movement looks like intra-day, as the news regarding the election, COVID & international relations/terror may weigh on their price & begin to show where the top may be.

At the moment however, it looks like the $64-$65 short-term expiration (11/6) for puts may be the best bet for hedging.

This is a stock that will continue to benefit from COVID, and given other countries are resuming lockdowns again, they may be able to muster more strength with the “stay-at-home” economy, especially if there is another virus surge in the US, warranting more shutdowns.

*** I DO NOT OWN ANY SHARES OF PINS STOCK ***

Jumia Technologies JMIA Stock Analysis

Jumia Technologies stock trades under the ticker JMIA & has recently shown technical strength, making it a prime candidate for a short-to-medium-term trade.

JMIA stock closed at $16.05 on Monday 10/2/2020, and is up an additional 5.24% in pre-market trading on 10/3/2020.

Jumia Technologies stock has options for traders, where the $17 calls & $17 puts are about at-the-money.

Jumia Technologies JMIA Stock Technical Performance For The Last Year

JMIA Stock Price: $16.05

10 Day Moving-Average: $16.62

50 Day Moving-Average: $10.69

200 Day Moving-Average: $7.35

RSI: 58

I would be looking at the $17 calls for 11/20/20, and also $17 puts as a hedge. The $18 calls may also be worth buying in addition to the $17’s, but moving out to the 12/18/2020 expiration, as the $17 calls may open in the money.

The $18 calls may be aggressive for the near-term expiration, but owning them for another month out will give the stock the ability to establish itself a new range, with profits possible on the $17 puts as the price corrects & adjusts.

*** I DO NOT OWN SHARES OF JMIA STOCK ***

O2Micro International Limited, OIIM Stock Analysis

O2Micro International Limited trades under the ticker OIIM, and has recently shown solid growth worth taking a closer look at.

OIIM stock does not have options, so traders can only trade their common shares, which currently cost $6.42 (per 10/30/2020’s close), and are showing a bit of pre-market weakness (-0.2% at 8:30 am 11/2/2020).

After a correction from $6.23 on 10/22/2020, they’re now looking to establish a new range, and should have some more gas in them to run with.

O2Micro International Limited OIIM Stock Technical Performance For The Last Year

OIIM Stock Price: $6.42

10 Day Moving-Average: $5.67

50 Day Moving-Average: $3.90

200 Day Moving-Average: $2.22

RSI: 70

If O2Micro International Limited stock can break through $6.44, then traders should expect to see them continue to run.

As there are no options, and OIIM is a member of the NASDAQ, SQQQ shares or call options may be your best bet as a hedge against OIIM’s performance.

However, anyone using SQQQ as a hedge should be aware that it is a 3x inverse ETF and may decay faster than OIIM appreciates, so a trader would only want to do this for a short term, and using a ratio of OIIM:SQQQ.

*** I DO NOT OWN SHARES OF OIIM STOCK ***

NIO Limited NIO Stock Analysis

NIO Limited stock trades under the ticker NIO & has recently displayed technical traits worth taking a closer look at for a short-to-medium-term tade opportunity.

After a gap up on 10/14/2020 they have had an unstable performance, where the $28.48-$29.40 level is the resistance.

NIO stock has options available to traders, and I would be looking at the $28 puts for 10/30.

NIO Limited NIO Stock Technical Performance For The Last Year

NIO Stock Price: $28.44

10 Day Moving-Average: $26.87

50 Day Moving-Average: $20.35

200 Day Moving-Average: $9.54

RSI: 63

For NIO calls, the Delta of the $27 options is 0.76, while the $28’s is 0.59.

In pre-market trading they’re down 2.5% to $27.76 (at the time of writing this), making the $27 calls worth looking into for the near-term expiration date (10/30).

Looking out further, the puts will likely outperform in the following week to two weeks, given the expected volatility & unrest from the election.

*** I DO NOT OWN SHARES OF NIO STOCK ***

Bed, Bath & Beyond Inc. BBBY Stock Analysis

Bed, Bath & Beyond Inc. stock trades under the ticker BBBY & has recently displayed solid technical strength & is worth taking a look at for a short-term trade opportunity.

BBBY stock closed at $24.73 on 10/26/2020, coming off of two strong gap up days in October (10/1 & 10/14).

BBBY has options, so I may think to look at their $24.50 calls & puts (11/20/2020 expiration).

Buying the call that is slightly already in-the-money has a Delta of 0.56, with the put being a 0.44; both options will decay at a similar rate with thetas of -0.04.

Their vega is 0.026, which is helpful given that we are about to see a rise in volatility, so a trader can profit off of the calls faster, and as the market gets to be a little shakier cash out of them & sell a call that is just out0of-the-money, while keeping the put position to profit from during the turbulence.

Bed, Bath & Beyond Inc. BBBY stock technical performance for the last year.

BBBY Stock Price: $24.73

10 Day Moving-Average: $24.23

50 Day Moving-Average: $16.07

200 Day Moving-Average: $10.93

RSI: 82

Looking at BBBY’s stock chart, it appears as if they are beginning to lose some steam, hence the already in-the-money calls look more appealing to buy & sell for the quick profit, before selling an out-of-the-money call that will likely have a difficult time ever becoming worth anything.

Overall, there seems to be a lot of good opportunities for a short-term trader to capitalize on with BBBY stock & its options.

*** I DO NOT OWN SHARES OF BBBY STOCK ***

Marin Software Incorporated MRIN Stock Analysis

Marin Software Incorporated stock trades under the ticker MRIN & has recently shown a good deal of technical strength.

MRIN stock closed for trading on 10/23/2020 at $3.45/share, after gapping up a couple of days prior.

There are no options for MRIN stock, so the fact that they’re down 9.6% in pre-market trading (as of 9am on 10/26), paving the way for a potential attractive entry point.

As a member of the NASDAQ, a hedge agains them would be something like an SQQQ, an inverse NASDAQ ETN.

Marin Software Incorporated MRIN Stock Technical Performance For The Last Year

MRIN Stock Price: $3.45

10 Day Moving-Average: $1.85

50 Day Moving-Average: $1.43

200 Day Moving-Average: $1.42

RSI: 68

As the 50 Day Moving-Average just crossed the 200 Day & will continue to climb, there should still be some steam in MRIN from a short-term trade perspective, making it worth taking a closer look at for traders.

*** I DO NOT OWN SHARES OF MRIN STOCK ***