NVIDIA Corp. stock trades under the ticker NVDA & has been one of the most talked about companies in the world over the past year & for great reason.
Their stock has advanced +141.11% over that time, sitting -16.46% below its 52-week high set in June, but still +199.75% higher than their 52-week low that was set on Halloween of 2023 (all figures are ex-dividends).
While their earnings results beat expectations, there was weakness in their guidance which market participants were not pleased to see, leading to yesterday’s gap down session.
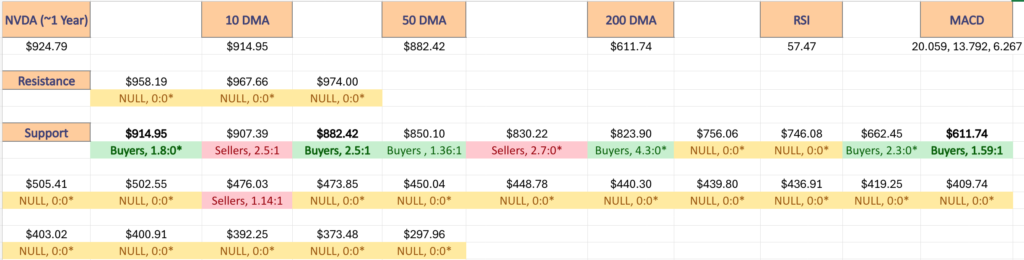
Between the negative sentiment from earnings & September’s historic month of poor performance & declines for stocks it is worth examining the strength of weakness of NVDA’s past year’s support & resistance levels.
Below is a brief review of NVDA’s recent technical performance, followed by the volume sentiments for each of the price levels that they have traded at over the past 1-2 years, in order to have an idea as to how they may behave again at these levels.
It is not intended to serve as financial advice, but rather as an additional tool to reference while performing your own due diligence on NVDA.
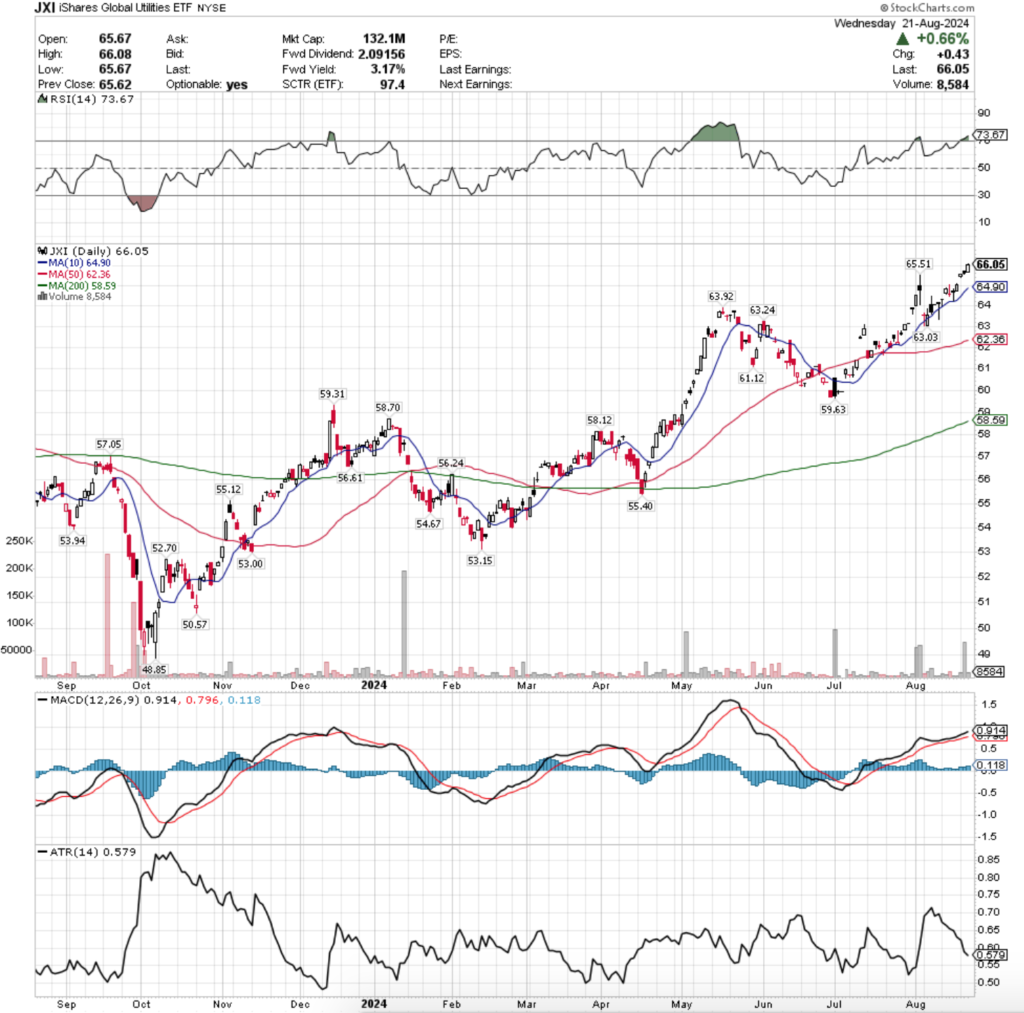
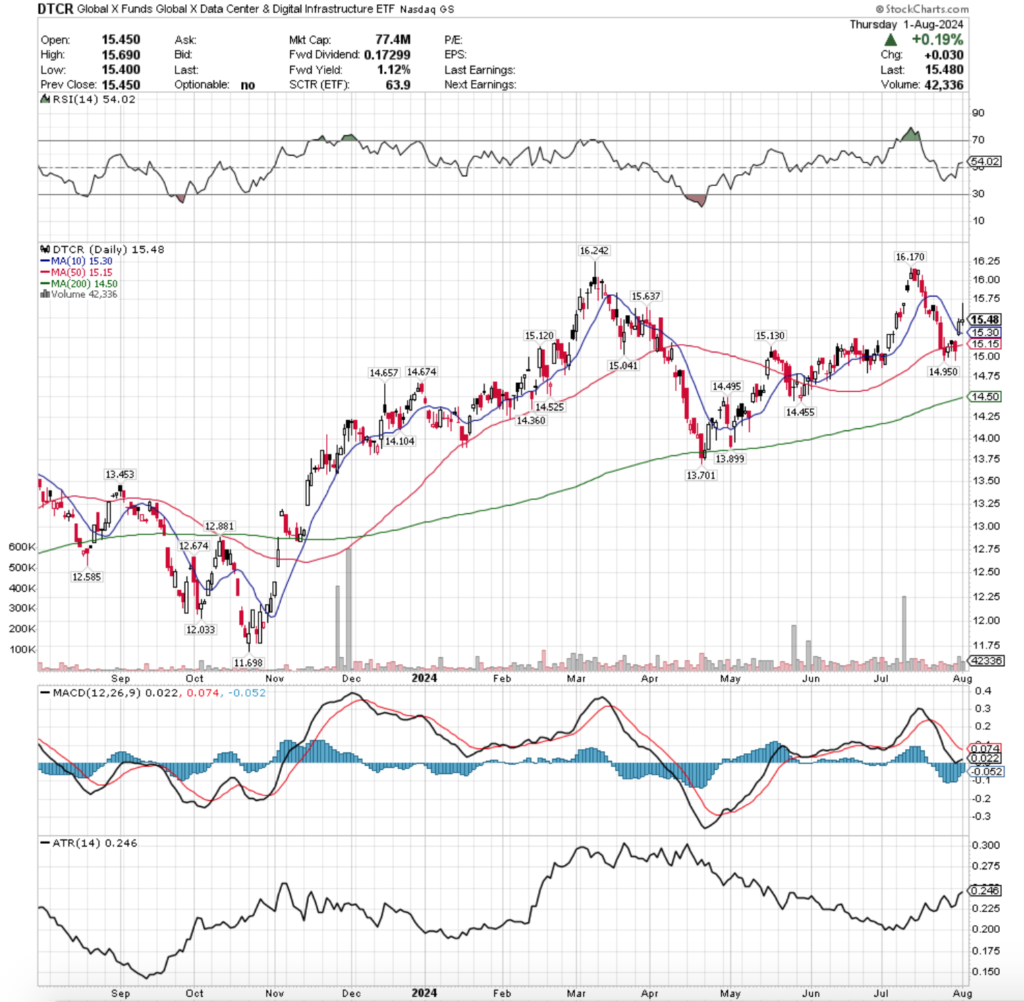
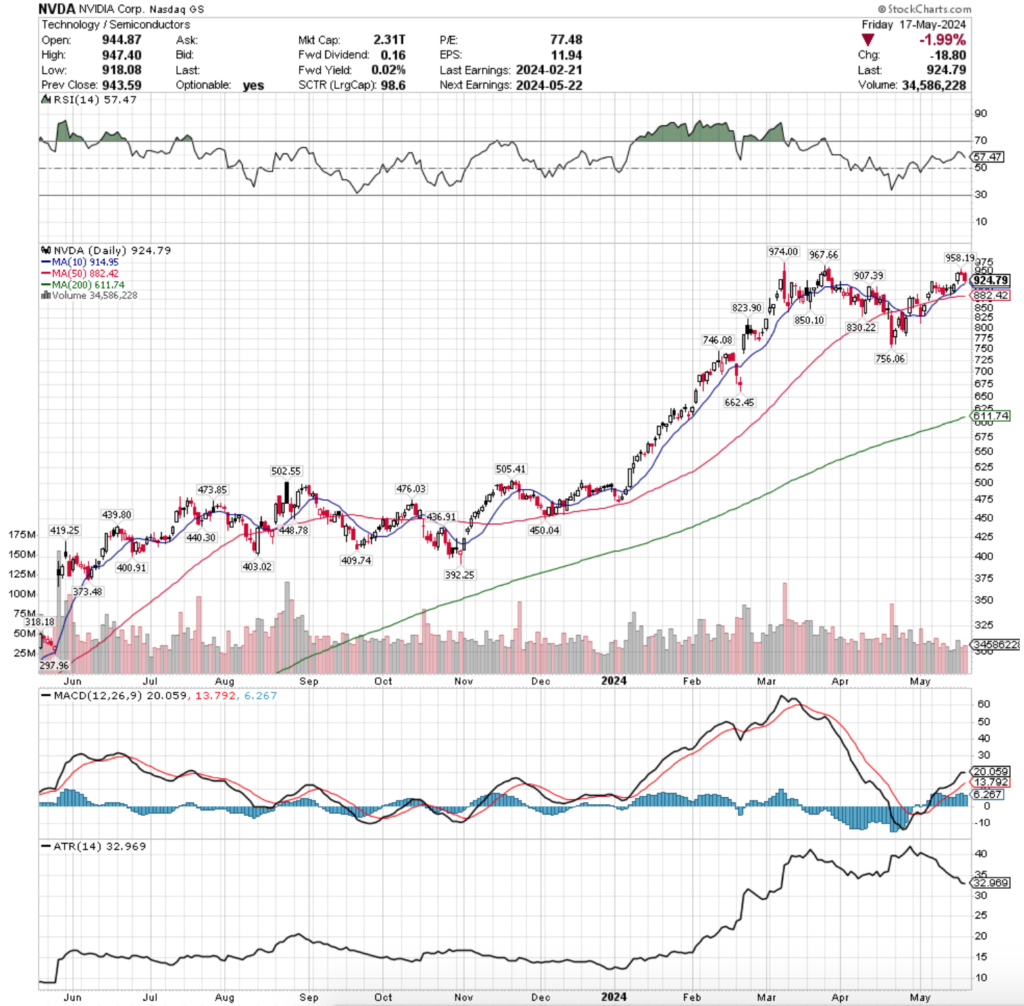
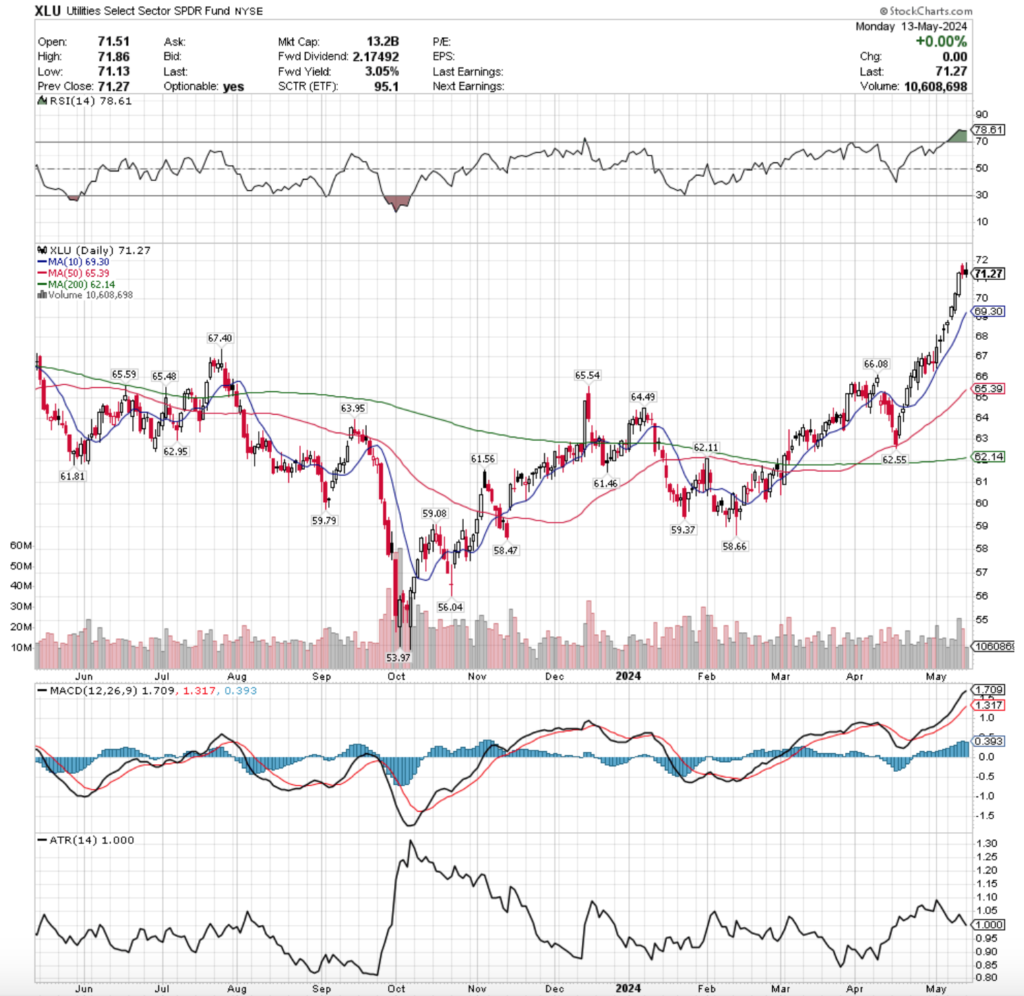
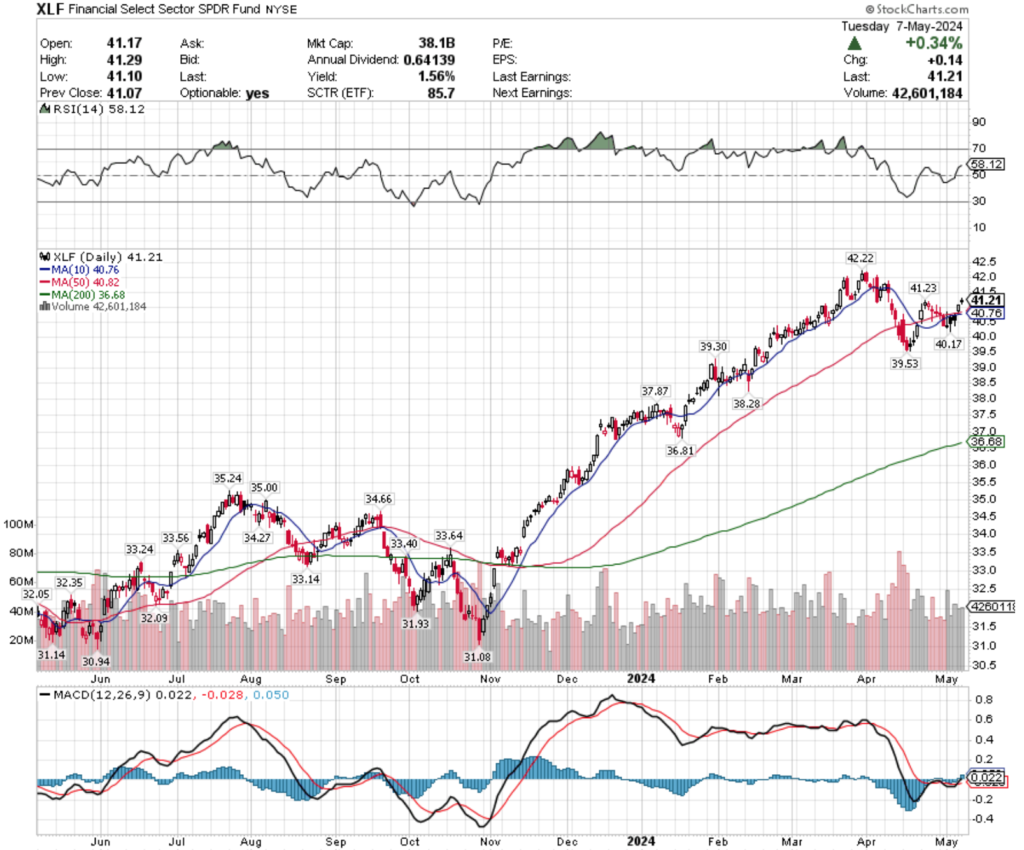
Technical Analysis Of NVDA, NVIDIA Corp. Stock
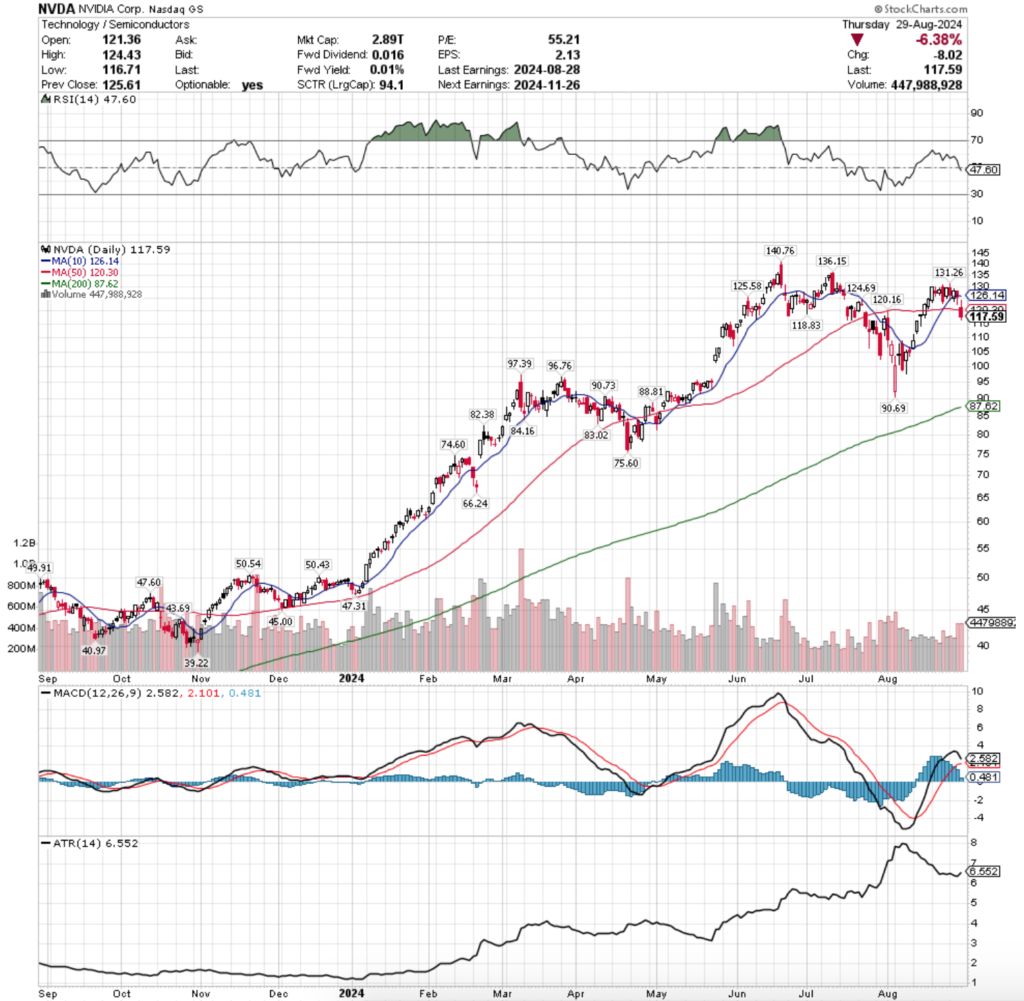
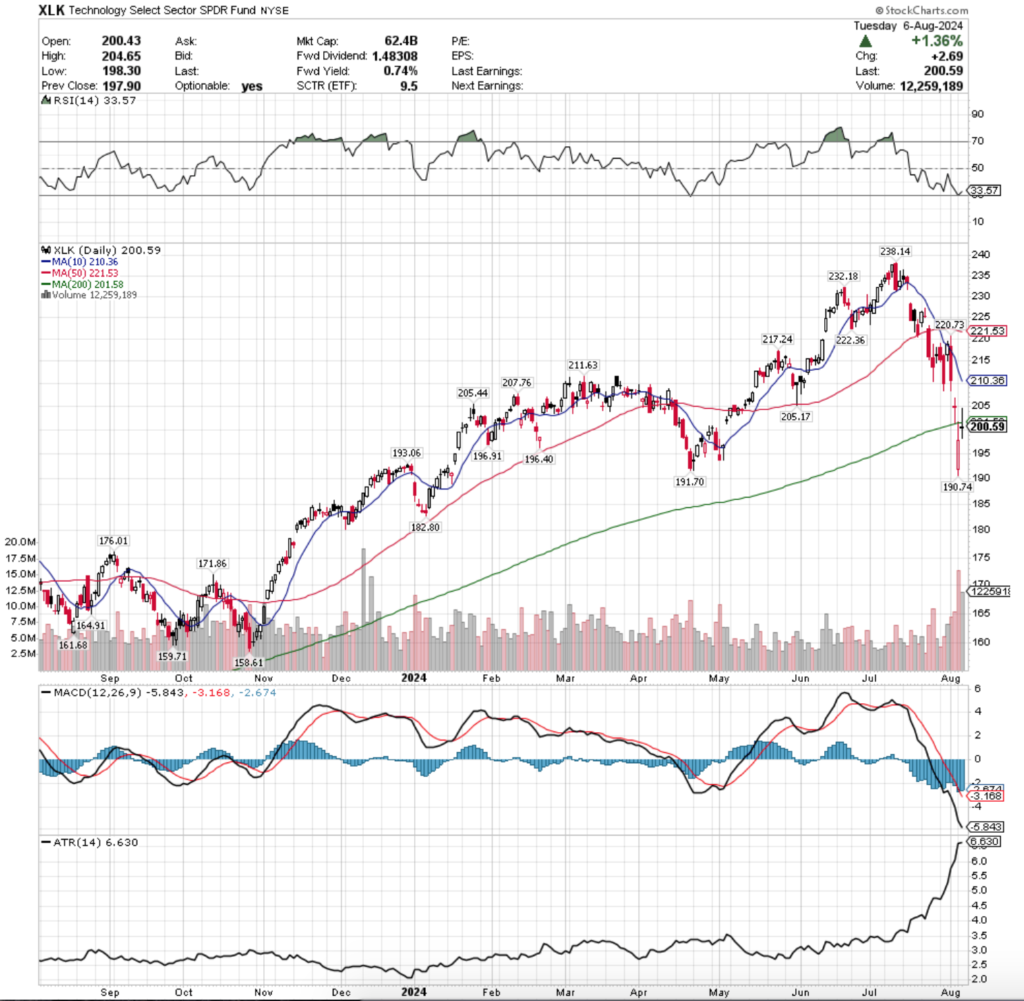
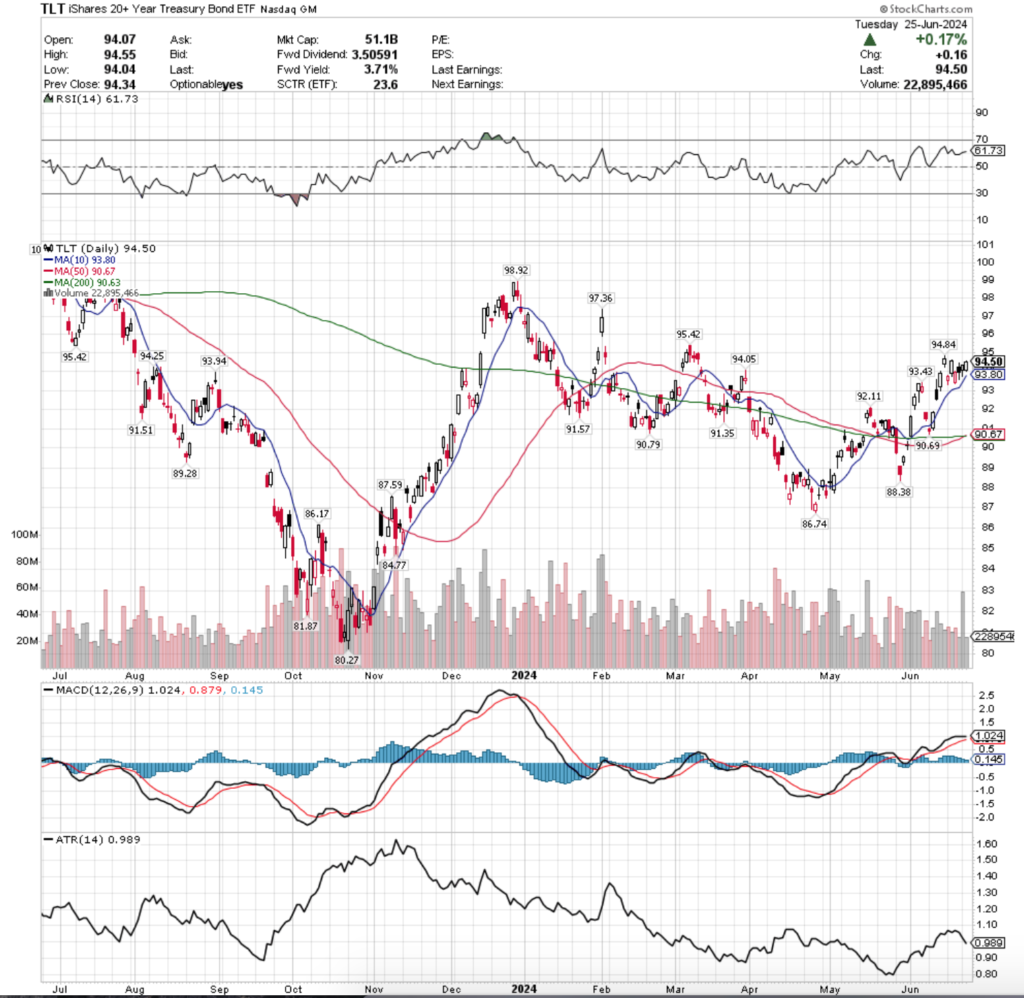
Their RSI is 47.6, while their MACD is bullish but ready to cross the signal line bearishly tomorrow or Monday, which will in turn begin showing more weakness in their current moving averages.
Over the past week, volumes have been -15.82% below average this past week despite their earnings call buildup vs. their previous year’s average (371,045,507.2 vs. 440,762,551.13).
However, over the past two trading sessions the average volume has been 448,448,968, only +1.74% above the year’s average despite the disappointing guidance they offered & the selling of the past two days.
Much like has been noted in the last few weekly market reviews, volume is going to be one of the primary areas to keep an eye on in the coming weeks, as it will depict what actual magnitude of market participants are forcing the volatility that we historically see in September.
Last Thursday is when the warning signs began flashing for NVDA, when the session ended with a bearish engulfing candle on high volume compared to the prior couple of weeks.
While there was a brief rally that Friday heading into the week’s close, it was on less volume than the day prior, indicating that uneasiness had begun to creep into their share price.
This Monday the week started off on weak footing with another declining session whose low tested the support of the ten day moving average, but that ultimately closed above it.
Tuesday opened at the 10 DMA, tested lower, but was able to rally higher & close at about the mid-way point of Monday’s candle, as investors gave them one last pump heading into earnings day.
Wednesday was the day of their earnings report, and despite their call not being until after the session’s close, there was bearish sentiment already in the air, as the day opened around Tuesday’s close & then ventured lower, breaking through the 10 DMA’s support by a greater magnitude than it had since the beginning of the month on a volume level that hadn’t been seen in weeks.
This continued into yesterday, where the open gapped down, the day’s high went up to & tested beyond Wednesday’s low, before the bears came out in droves & forced the price below the support of the 50 day moving average, with the day’s lower shadow signaling that there was more downside appetite than the close as well.
As noted earlier, the volume of the past two days was slightly above that of the average volume of the previously year, which indicates that there may be a more mass exodus from the pool in the coming weeks.
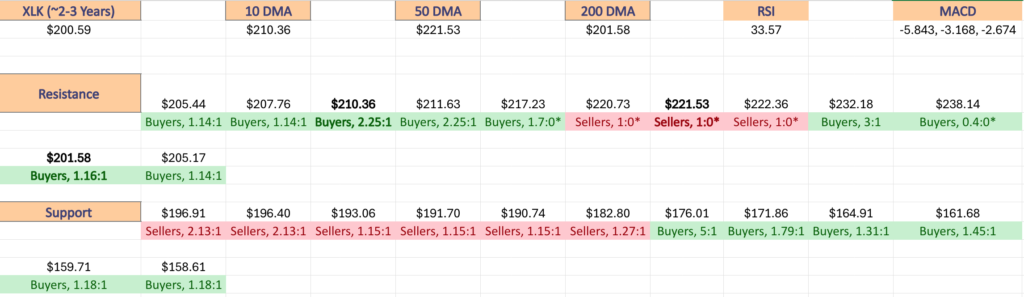
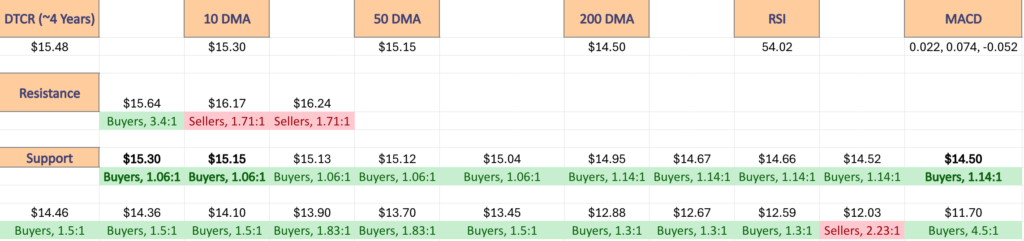
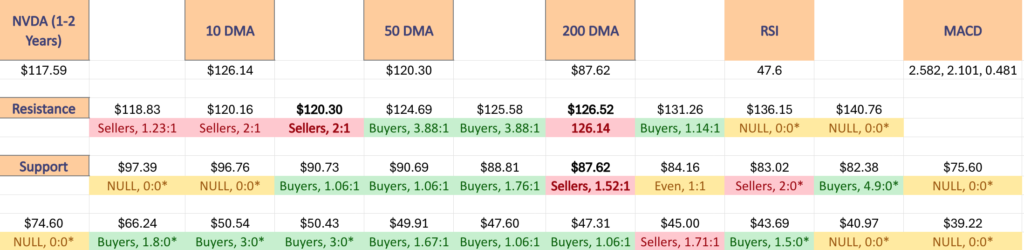
Now that the 50 DMA’s support has been breached NVDA’s next primary support level is at $97.39, a -17.18% decline from Thursday evening’s closing price.
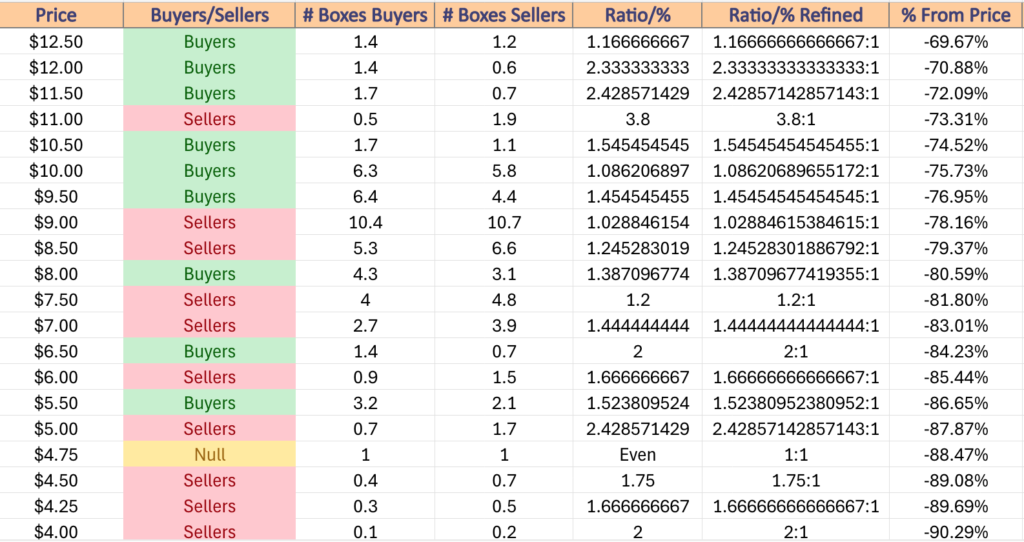
While there is a bit of a consolidation range that may provide support once that is reached, upon the $101.99/share point NVDA is either in seller dominated price zones or “NULL” zones (explanation in following section) until the buyers step back in at $95.99/share historically (table below), -18.37% below Thursday’s close.
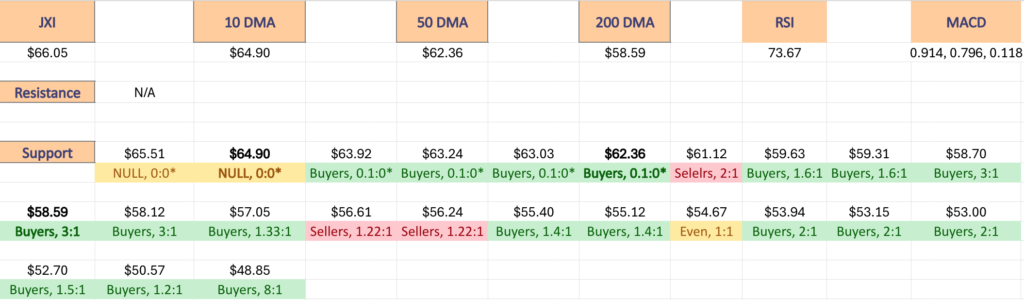
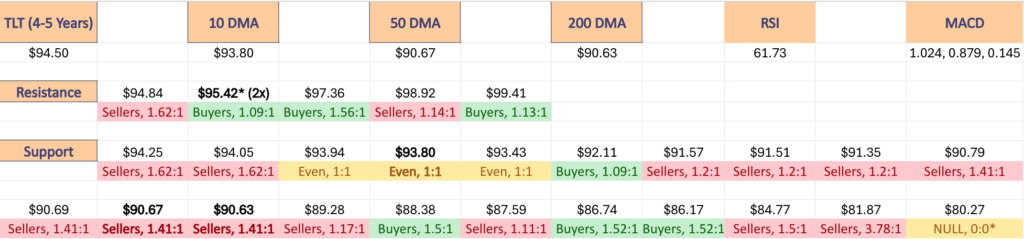
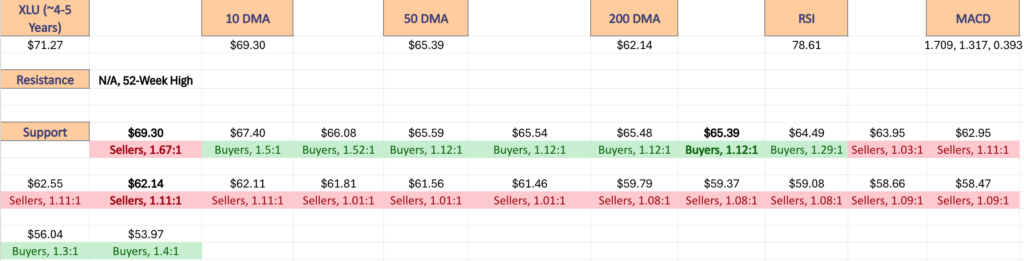
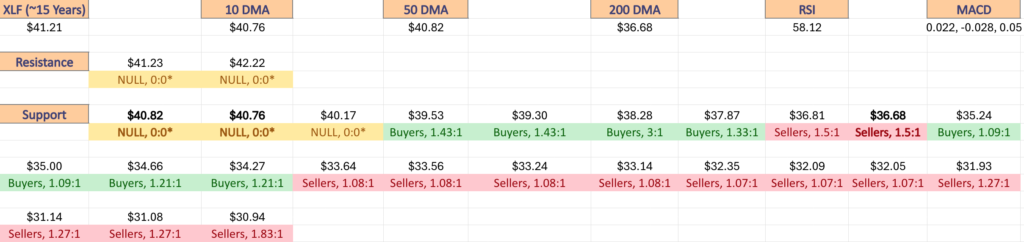
With that in mind, the next section outlines the volume sentiments for each price level NVDA has traded at over the past 1-2 years & the current price level, moving averages & support/resistance levels are also noted.
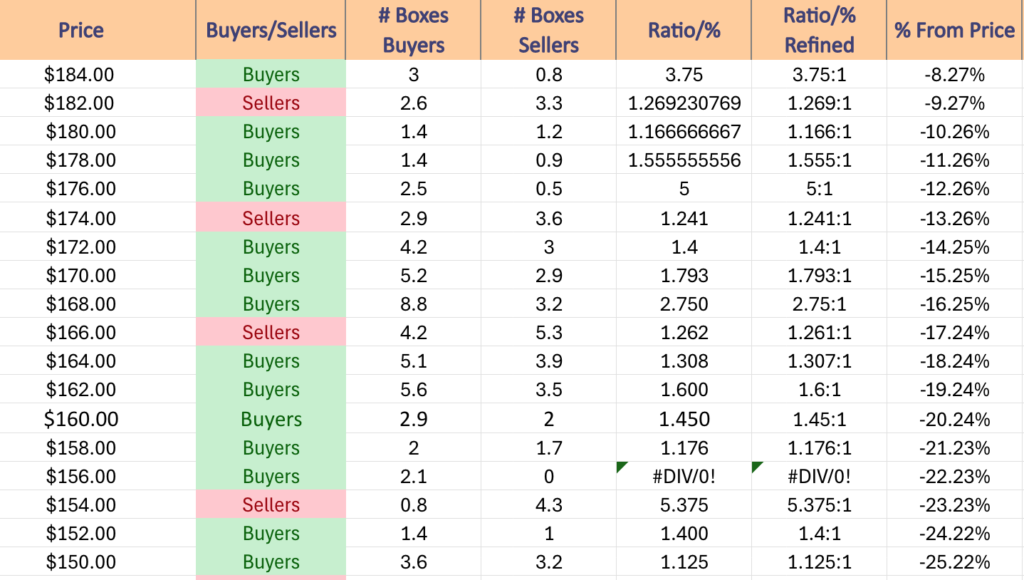
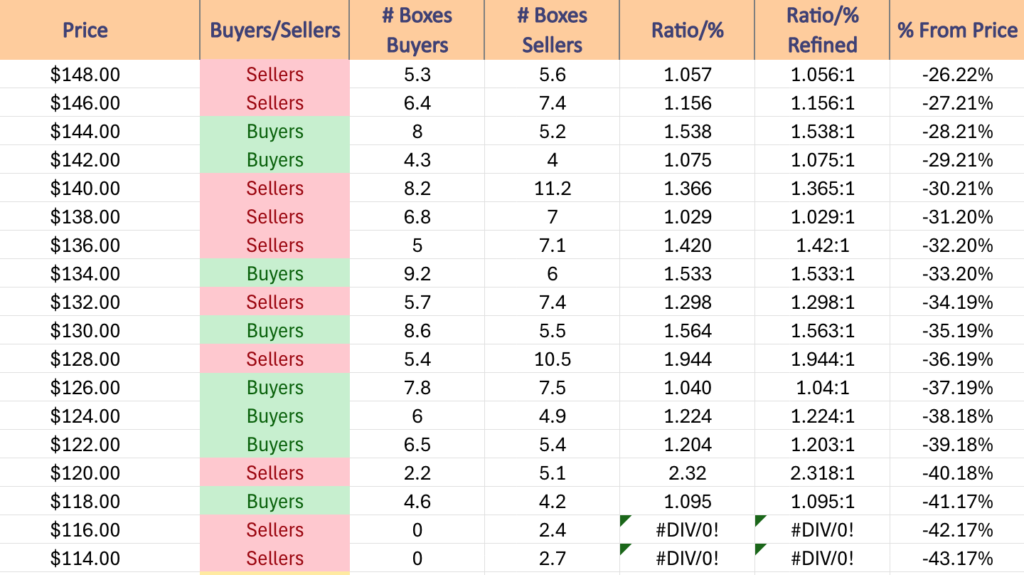
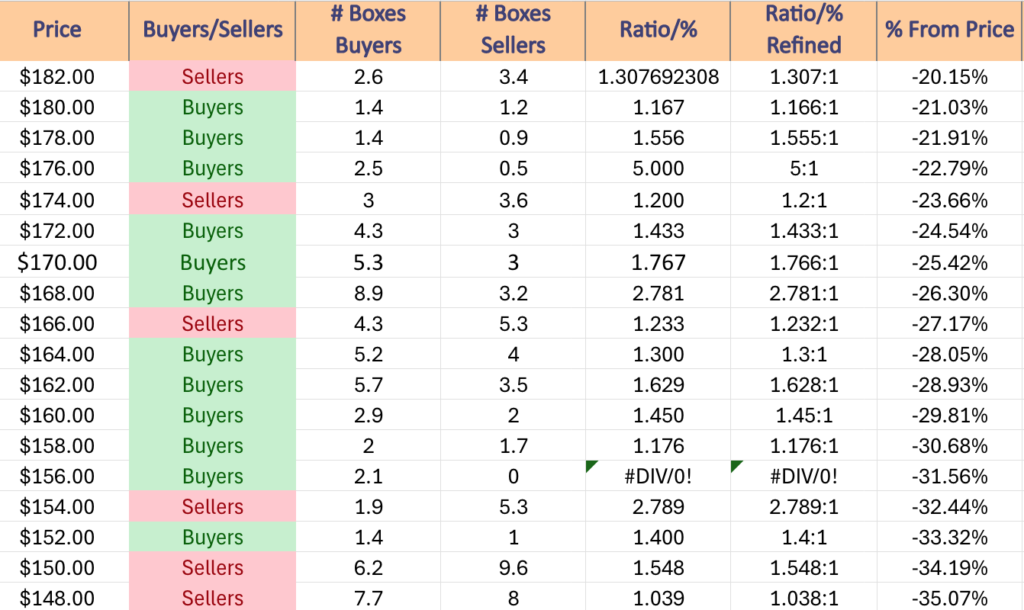
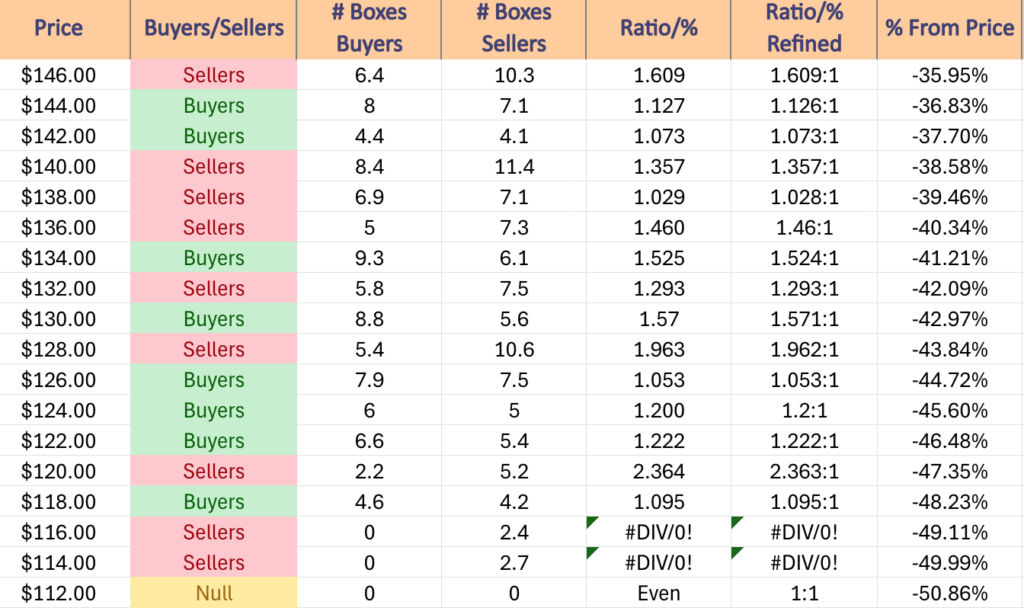
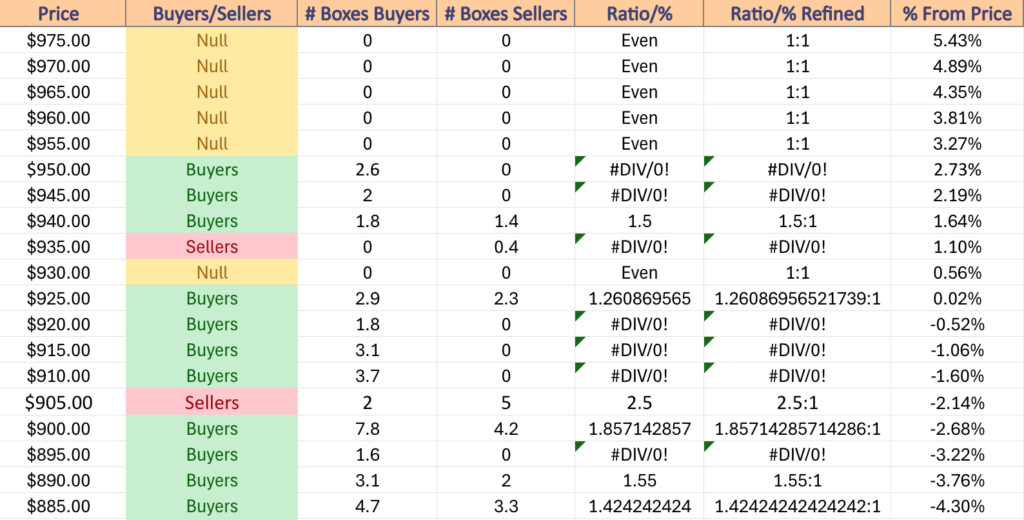
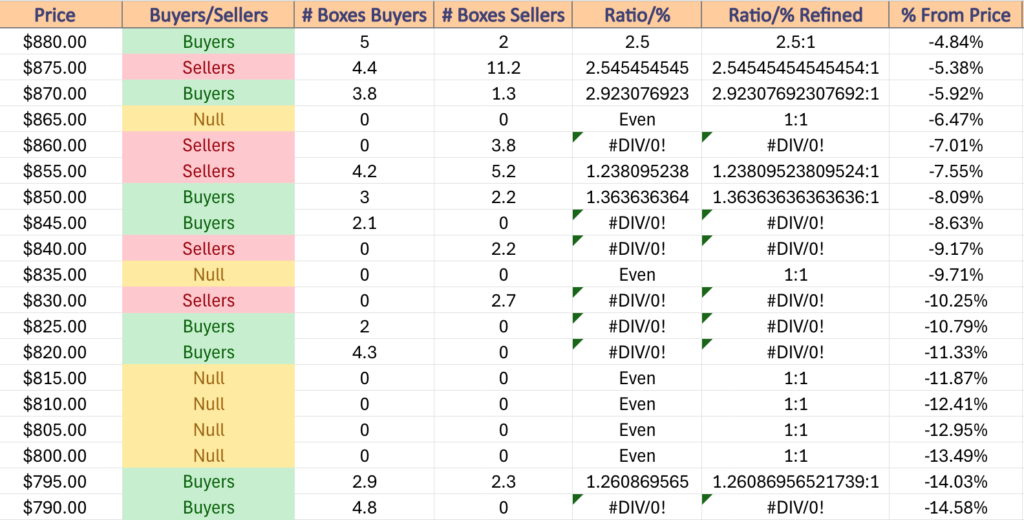
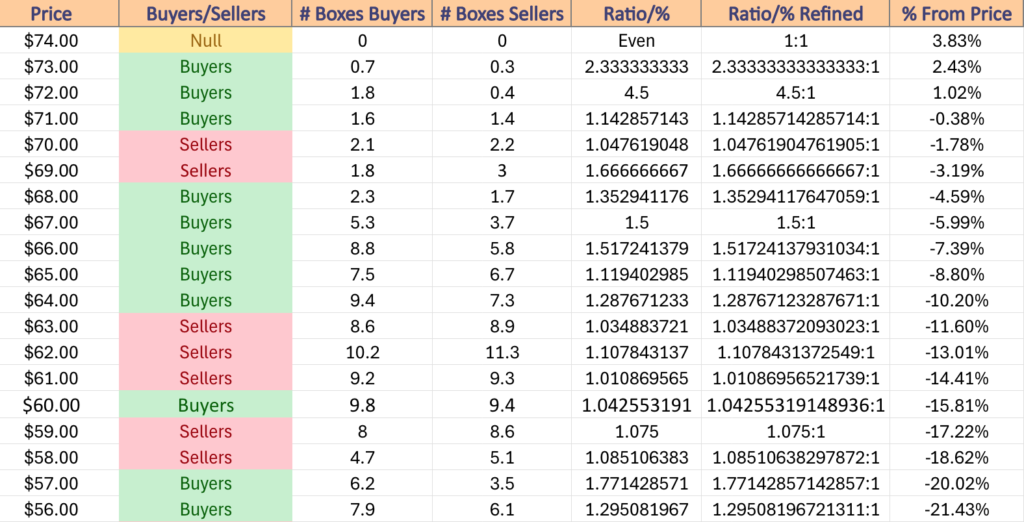
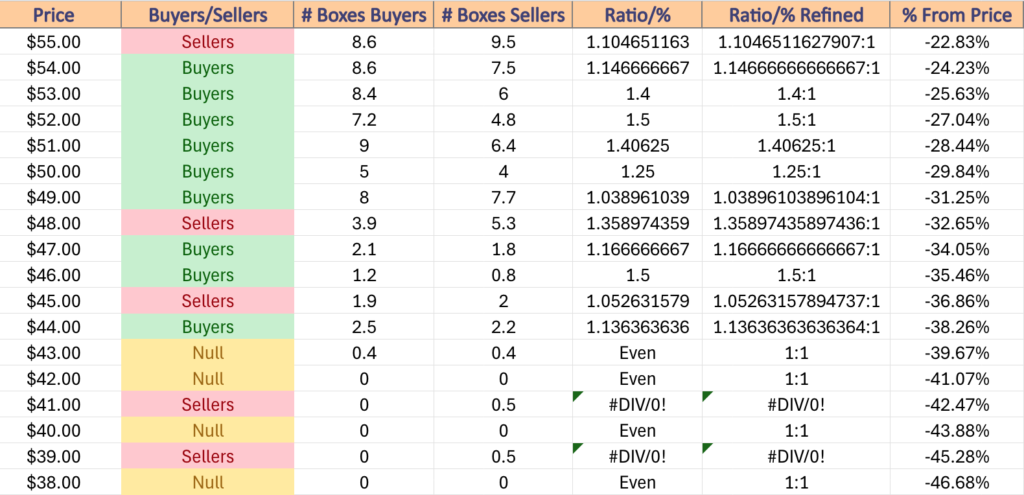
Price Level:Volume Sentiment Analysis For NVDA, NVIDIA Corp. Stock
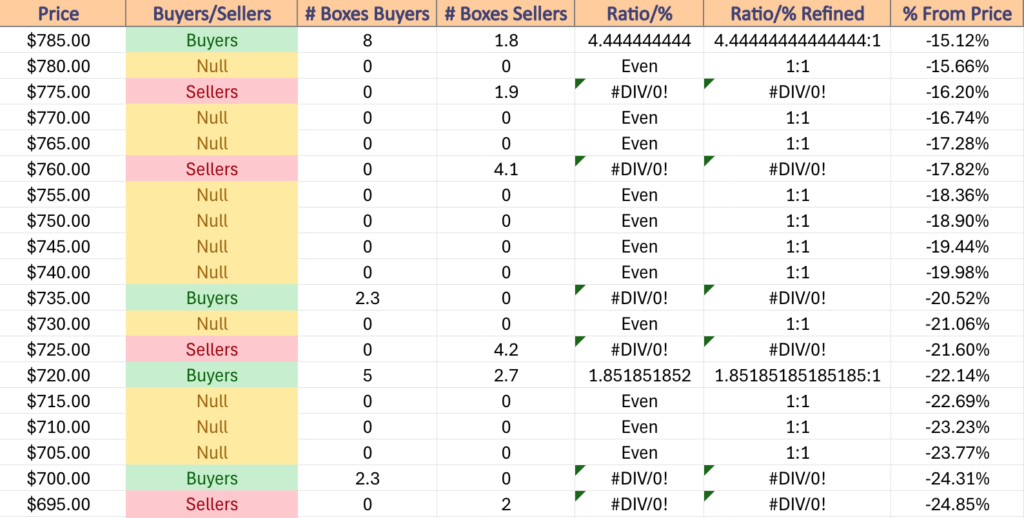
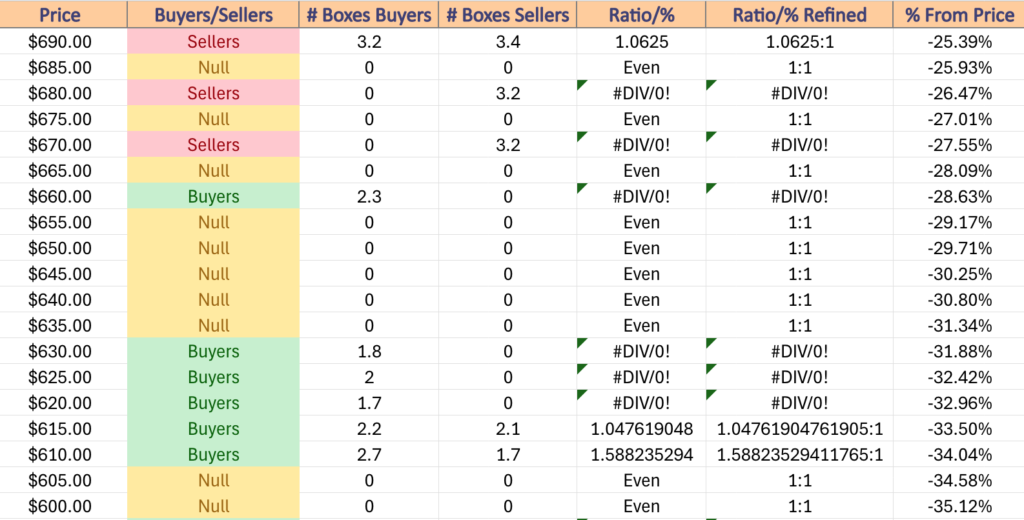
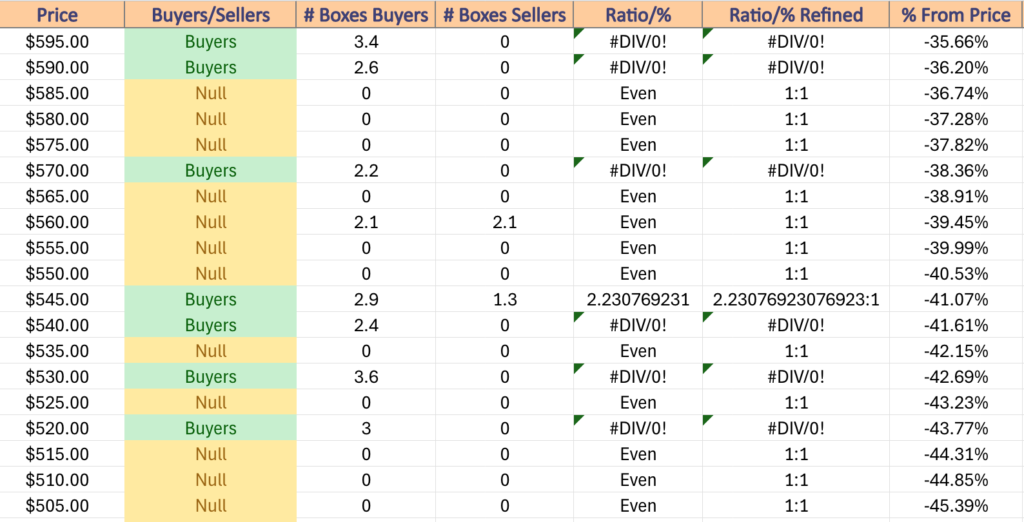
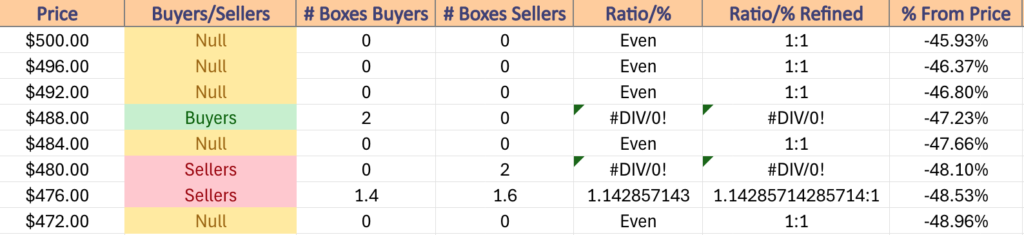
The top table below shows the support & resistance levels of NVDA from the past year’s chart, as well as their price level:volume sentiment at each, using Thursday 8/29/24’s closing price.
The moving averages are denoted with bold.
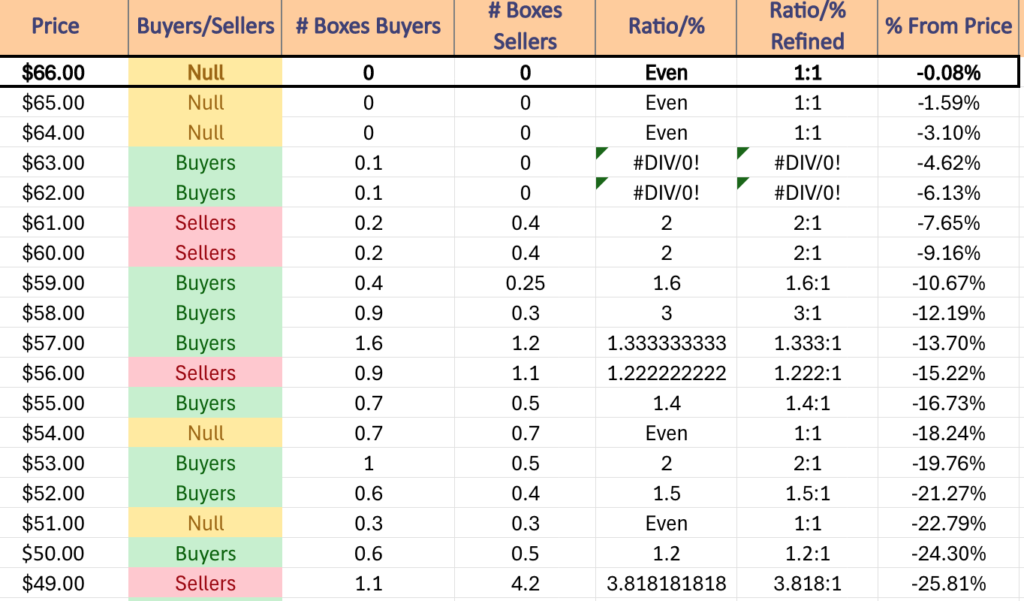
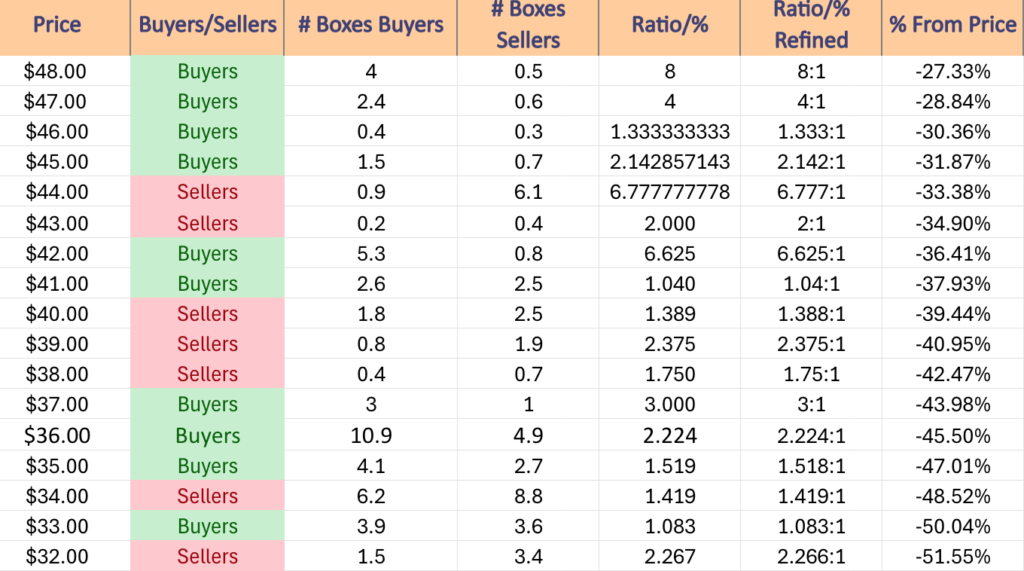
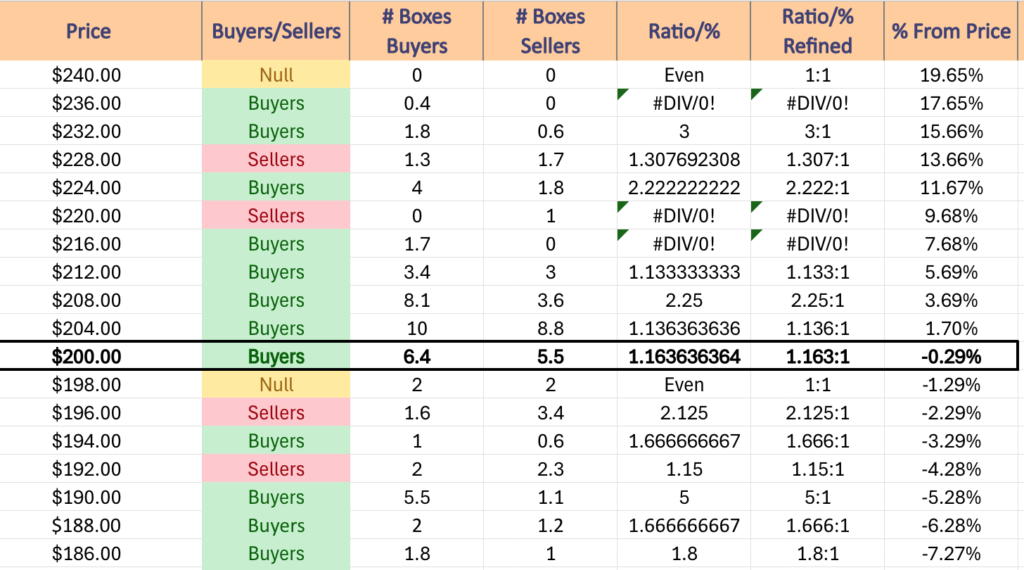
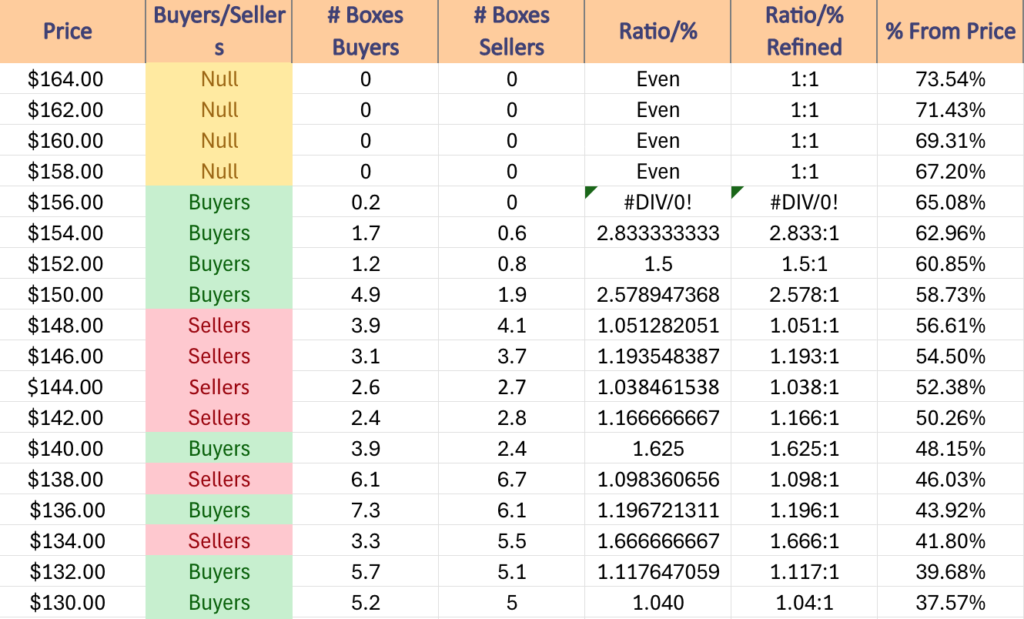
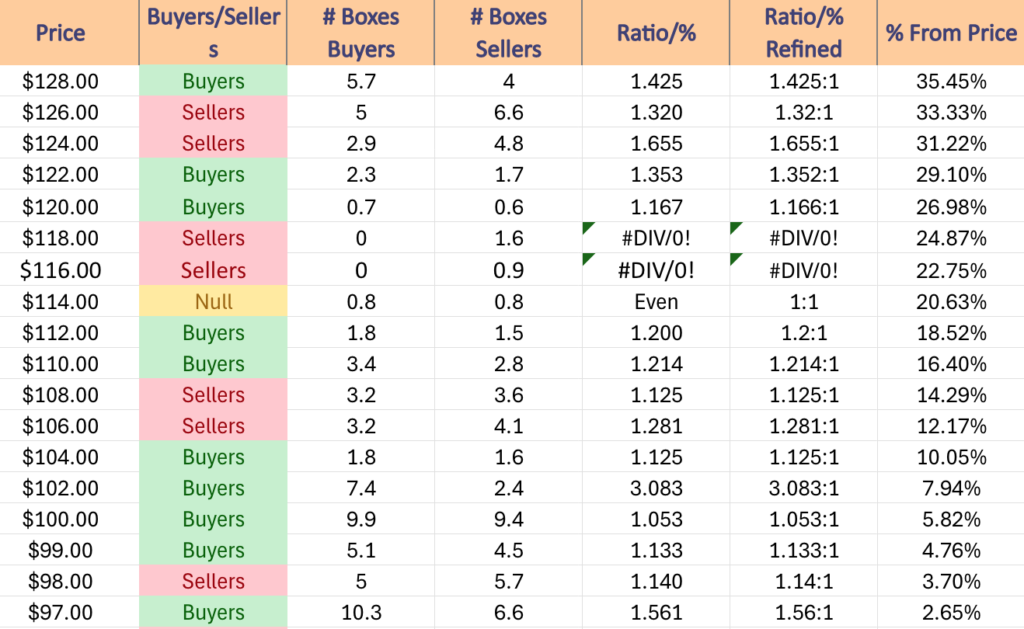
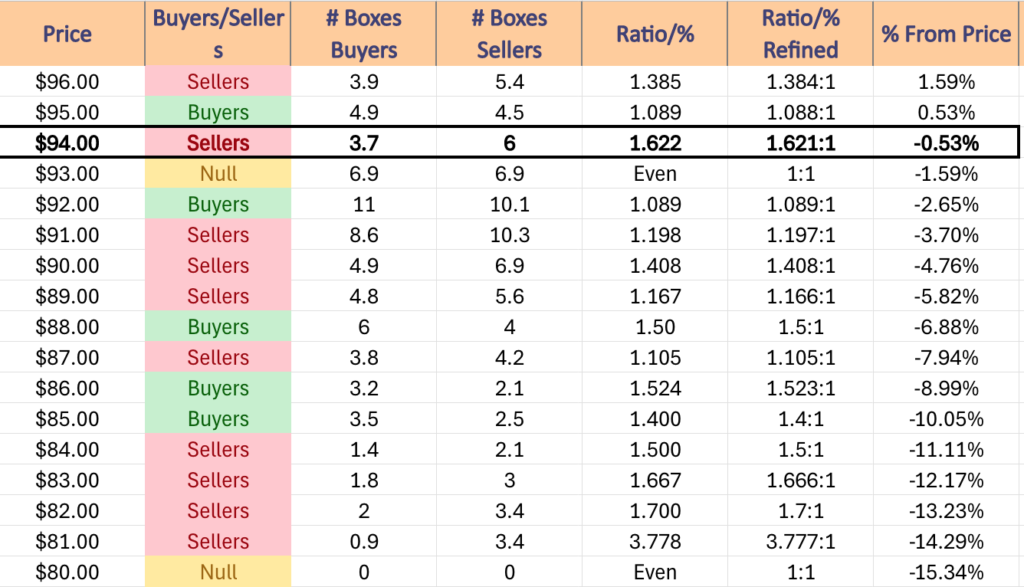
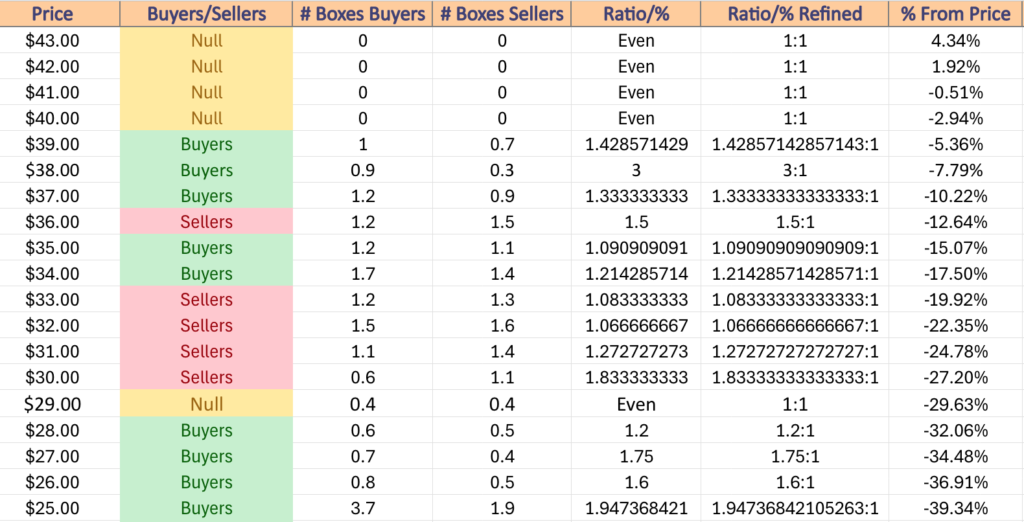
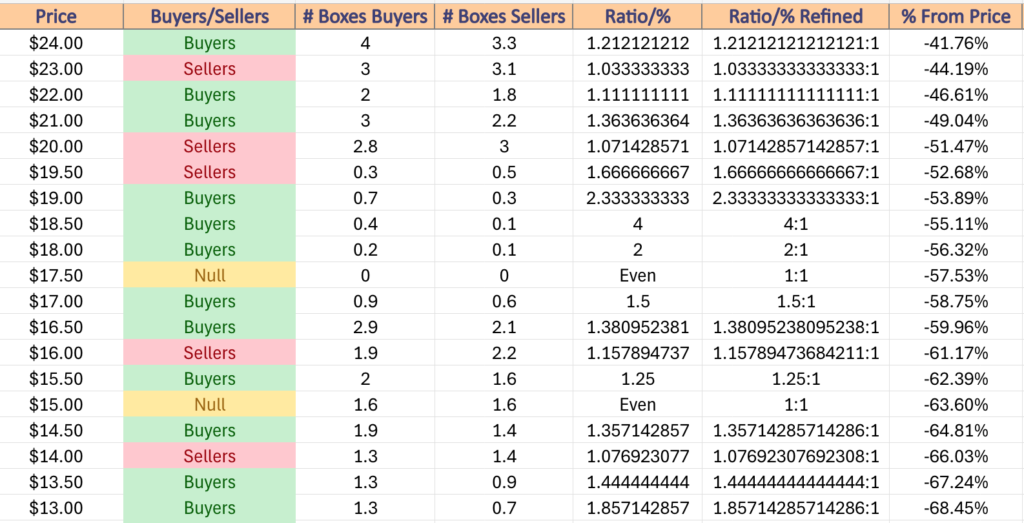
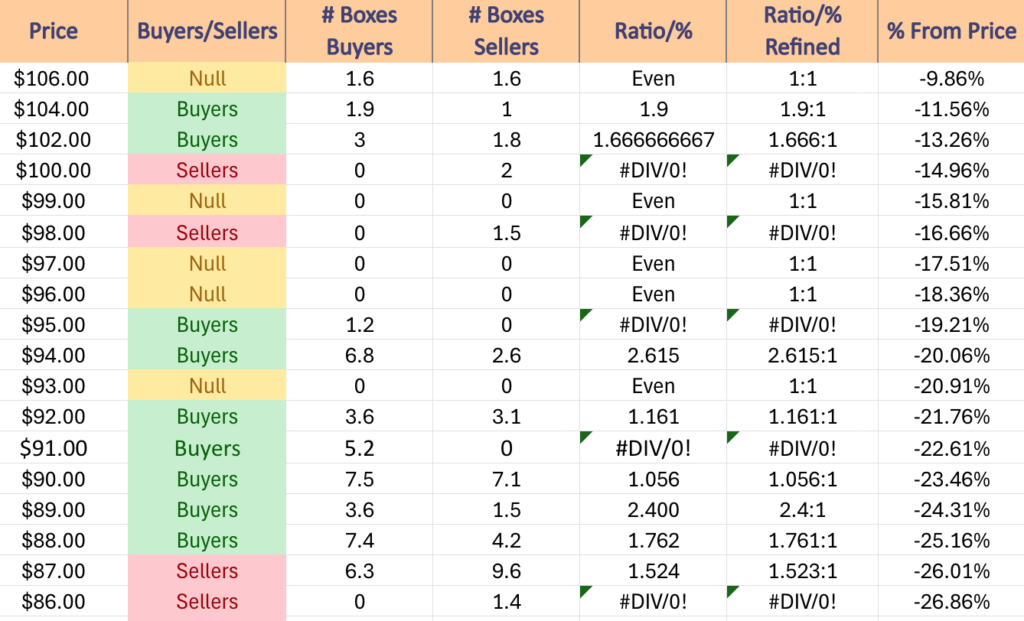
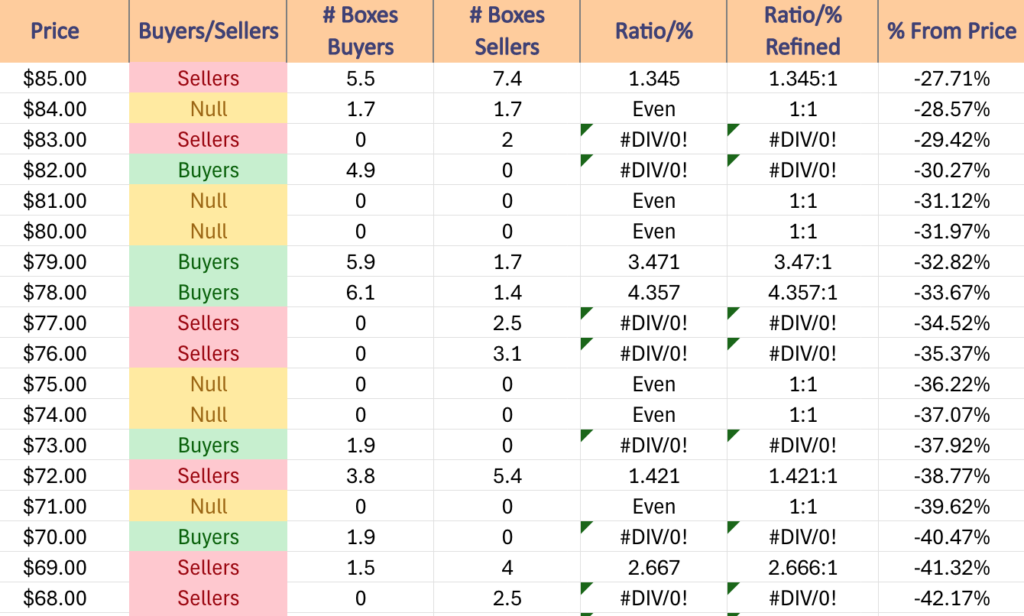
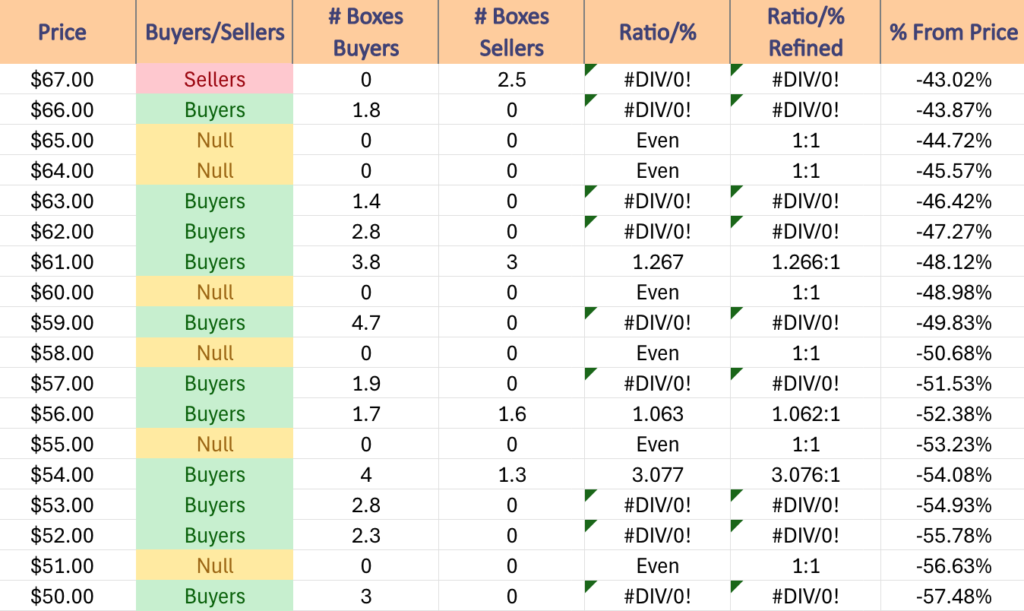
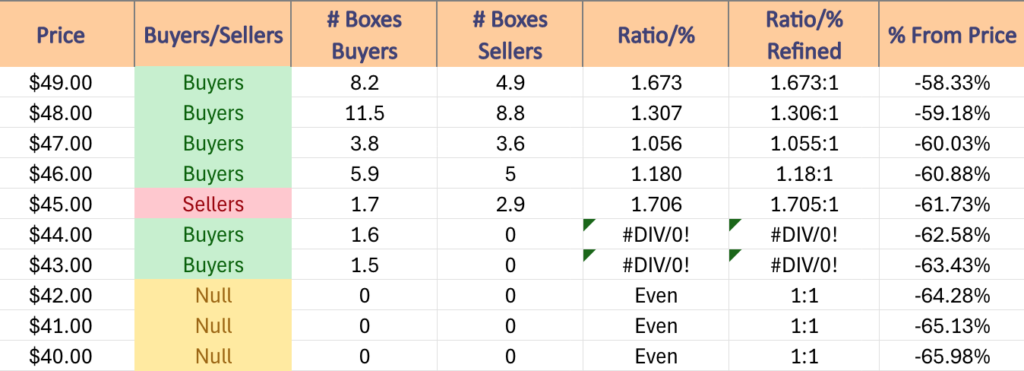
The next charts show the volume sentiment at each individual price level NVDA has traded at over the past 1-2 years.
Beneath them is a copy & pasteable list of the same data, where the support/resistance levels are denoted in bold.
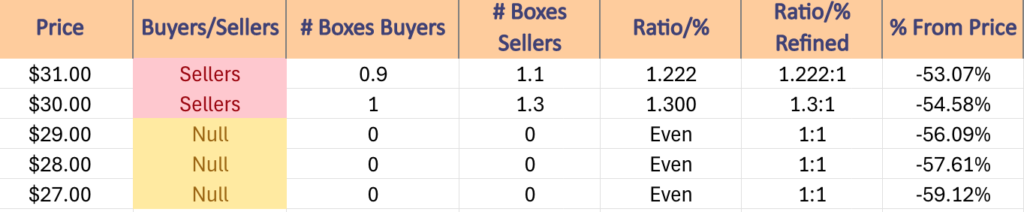
All ratios with “0” in the denominator are denoted with a “*”.
NULL values are price levels that had limited trading volume, whether it be due to gaps, quick advances or they are at price extremes; in the event that they are retested & there is more data they would have a distinct “Buyers”, “Sellers” or “Even” title.
This is not intended as financial advice, but rather another tool to consider when performing your own research & due diligence on NVDA stock.
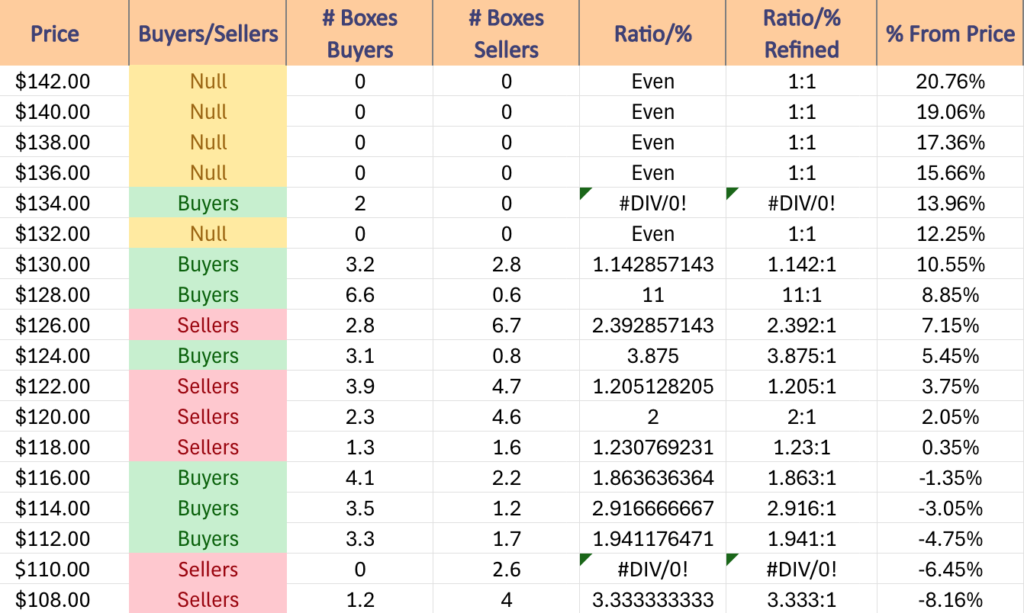
$142 – NULL – 0:0*, +20.76% From Current Price Level
$140 – NULL – 0:0*, +19.06% From Current Price Level
$138 – NULL – 0:0*, +17.36% From Current Price Level
$136 – NULL – 0:0*, +15.66% From Current Price Level
$134 – Buyers – 2:0*, +13.96% From Current Price Level
$132 – NULL – 0:0*, +12.25% From Current Price Level
$130 – Buyers – 1.14:1, +10.55% From Current Price Level
$128 – Buyers – 11:1, +8.85% From Current Price Level
$126 – Sellers – 2.39:1, +7.15% From Current Price Level – 10 Day Moving Average*
$124 – Buyers – 3.88:1, +5.45% From Current Price Level
$120 – Sellers – 2:1, +3.75% From Current Price Level – 50 Day Moving Average*
$118 – Sellers – 1.23:1, +2.05% From Current Price Level
$116 – Buyers – 1.86:1, +0.35% From Current Price Level – Current Price Level*
$114 – Buyers – 2.92:1, -1.35% From Current Price Level
$112 – Buyers – 1.94:1, -3.05% From Current Price Level
$110 – Sellers – 2.6:0*, -4.75% From Current Price Level
$108 – Sellers – 3.33:1, -6.45% From Current Price Level
$106 – Even – 1:1, -8.16% From Current Price Level
$104 – Buyers – 1.9:1, -9.86% From Current Price Level
$102 – Buyers – 1.67:1, -11.56% From Current Price Level
$100 – Sellers – 2:0*, -13.26% From Current Price Level
$99 – NULL – 0:0*, -14.96% From Current Price Level
$98 – Sellers – 1.5:0*, -15.81% From Current Price Level
$97 – NULL – 0:0*, -16.66% From Current Price Level
$96 – NULL – 0:0*, -17.51% From Current Price Level
$95 – Buyers – 1.2:0*, -18.36% From Current Price Level
$94 – Buyers – 2.62:1, -19.21% From Current Price Level
$93 – NULL – 0:0*, -20.06% From Current Price Level
$92 – Buyers – 1.16:1, -21.76% From Current Price Level
$91 – Buyers – 5.2:0*, -22.61% From Current Price Level
$90 – Buyers – 1.06:1, -23.46% From Current Price Level
$89 – Buyers – 2.4:1, -24.31% From Current Price Level
$88 – Buyers – 1.76:1, -25.16% From Current Price Level
$87 – Sellers – 1.52:1, -26.01% From Current Price Level – 200 Day Moving Average*
$86 – Sellers – 1.4:0*, -26.86% From Current Price Level
$85 – Sellers – 1.35:1, -27.71% From Current Price Level
$84 – Even – 1:1, -28.57% From Current Price Level
$83 – Sellers – 2:0*, -29.42% From Current Price Level
$82 – Buyers – 4.9:0*, -30.27% From Current Price Level
$81 – NULL – 0:0*, -31.12% From Current Price Level
$80 – NULL – 0:0*, -31.97% From Current Price Level
$79 – Buyers – 3.47:1, -32.82% From Current Price Level
$78 – Buyers – 4.36:1, -33.67% From Current Price Level
$77 – Sellers – 2.5:0*, -34.52% From Current Price Level
$76 – Sellers – 3.1:0*, -35.37% From Current Price Level
$75 – NULL – 0:0*, -36.22% From Current Price Level
$74 – NULL – 0:0*, -37.07% From Current Price Level
$73 – Buyers – 1.9:0*, -37.92% From Current Price Level
$72 – Sellers – 1.42:1, -38.77% From Current Price Level
$71 – NULL – 0:0*, -39.62% From Current Price Level
$70 – Buyers – 1.9:0*, -40.47% From Current Price Level
$69 – Sellers – 2.67:1, -41.32% From Current Price Level
$68 – Sellers – 2.5:0*, -42.17% From Current Price Level
$67 – Sellers – 2.5:0*, -43.02% From Current Price Level
$66 – Buyers – 1.8:0*, -43.87% From Current Price Level
$65 – NULL – 0:0*, -44.72% From Current Price Level
$64 – NULL – 0:0*, -45.57% From Current Price Level
$63 – Buyers – 1.4:0*, -46.42% From Current Price Level
$62 – Buyers – 2.8:0*, -47.27% From Current Price Level
$61 – Buyers – 1.27:1, -48.12% From Current Price Level
$60 – NULL – 0:0*, -48.98% From Current Price Level
$59 – Buyers – 4.7:0*, -49.83% From Current Price Level
$58 – NULL – 0:0*, -50.68% From Current Price Level
$57 – Buyers – 1.9:0*, -51.53% From Current Price Level
$56 – Buyers – 1.06:1, -52.38% From Current Price Level
$55 – NULL – 0:0*, -53.23% From Current Price Level
$54 – Buyers – 3.08:1, -54.08% From Current Price Level
$53 – Buyers – 2.8:0*, -54.93% From Current Price Level
$52 – Buyers – 2.3:0*, -55.78% From Current Price Level
$51 – NULL – 0:0*, -56.63% From Current Price Level
$50 – Buyers – 3:0*, -57.48% From Current Price Level
$49 – Buyers – 1.67:1, -58.33% From Current Price Level
$48 – Buyers – 1.31:1, -59.18% From Current Price Level
$47 – Buyers – 1.06:1, -60.03% From Current Price Level
$46 – Buyers – 1.18:1, -60.88% From Current Price Level
$45 – Sellers – 1.71:1, -61.73% From Current Price Level
$44 – Buyers – 1.6:0*, -62.58% From Current Price Level
$43 – Buyers – 1.5:0*, -63.43% From Current Price Level
$42 – NULL – 0:0*, -64.28% From Current Price Level
$41 – NULL – 0:0*, -65.13% From Current Price Level
$40 – NULL – 0:0*, -65.98% From Current Price Level
*** I DO NOT OWN SHARES OR OPTIONS CONTRACTS IN NVDA STOCK AT THE TIME OF PUBLISHING THIS ARTICLE ***