This weekend I had a look at United Parcel Service, Inc. stock, which trades under the ticker UPS. UPS closed for trading at $156.90/share on 8/7/2020, after experiencing a solid gap up at the end of July.
United Parcel Service, Inc. $UPS’s Fundamentals Broken Down
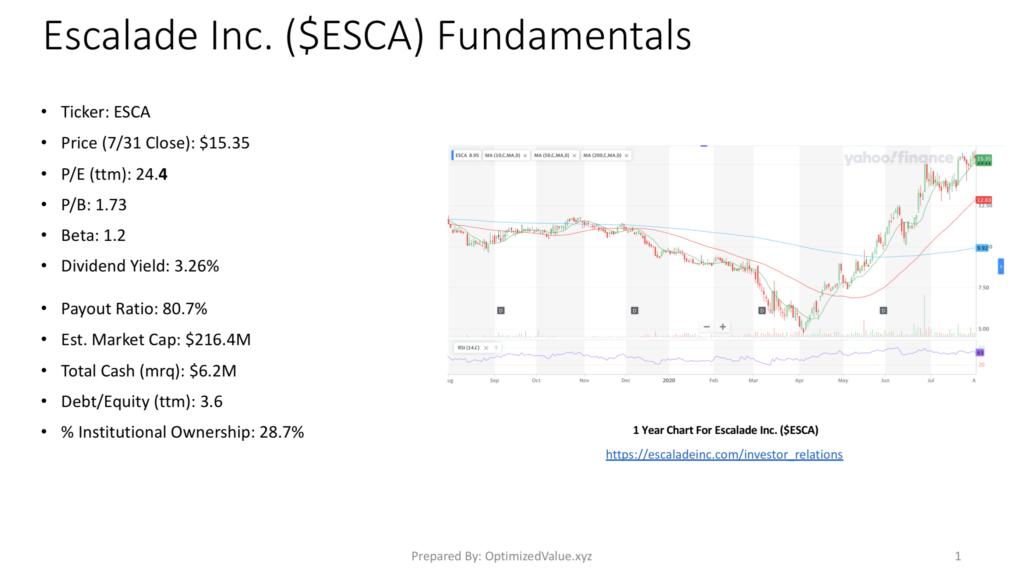
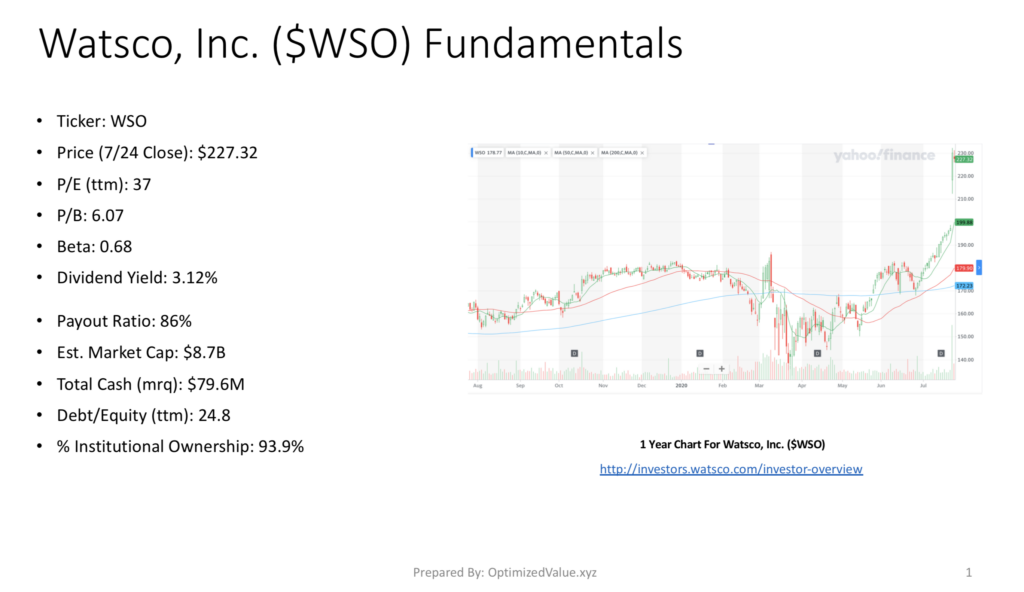
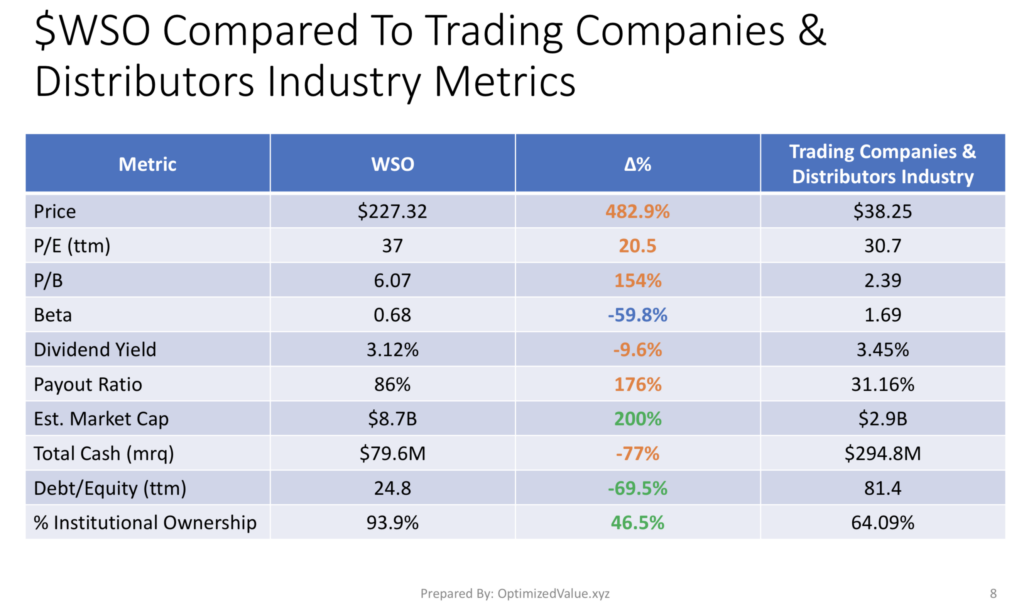
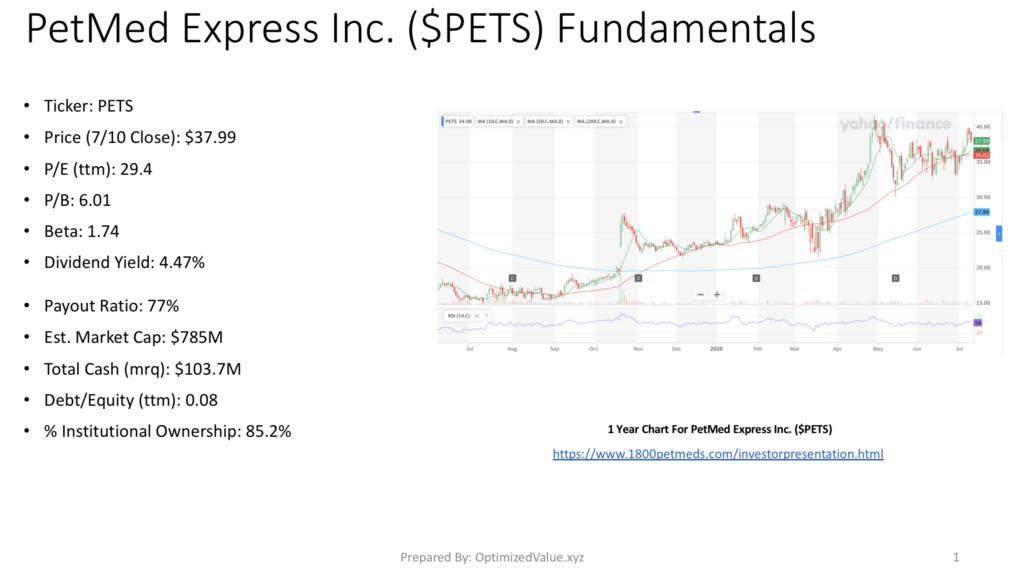
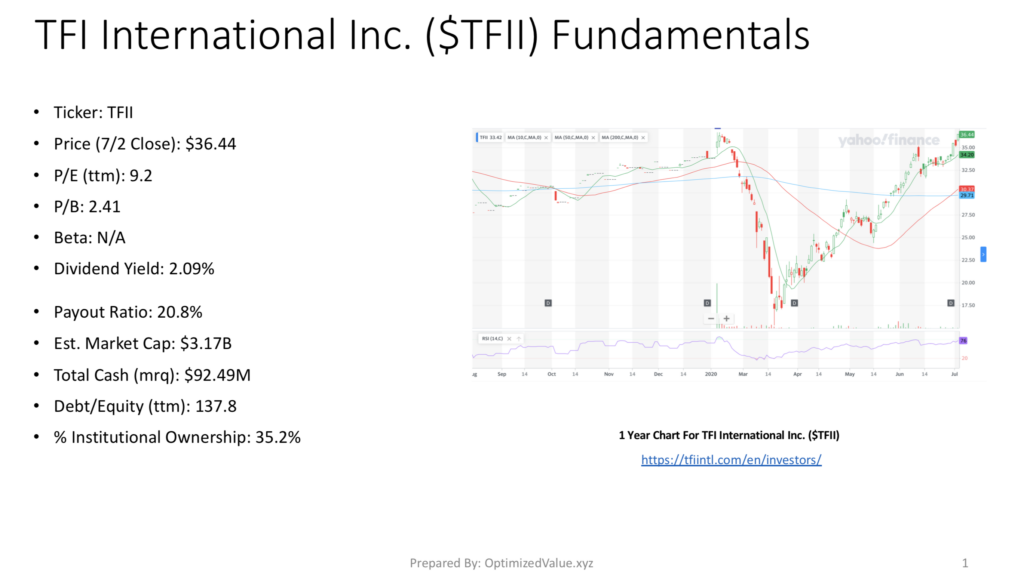
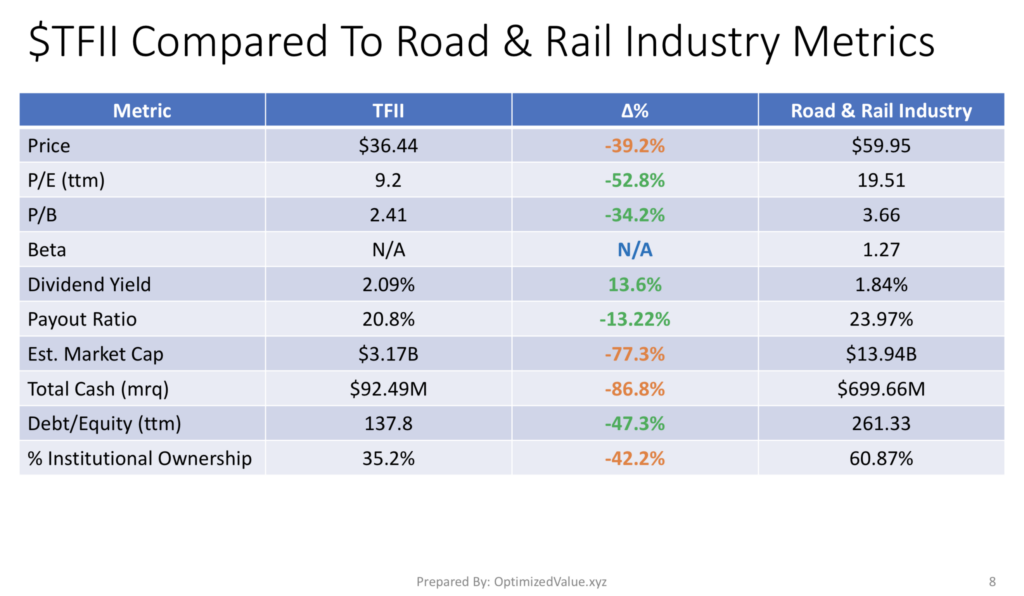
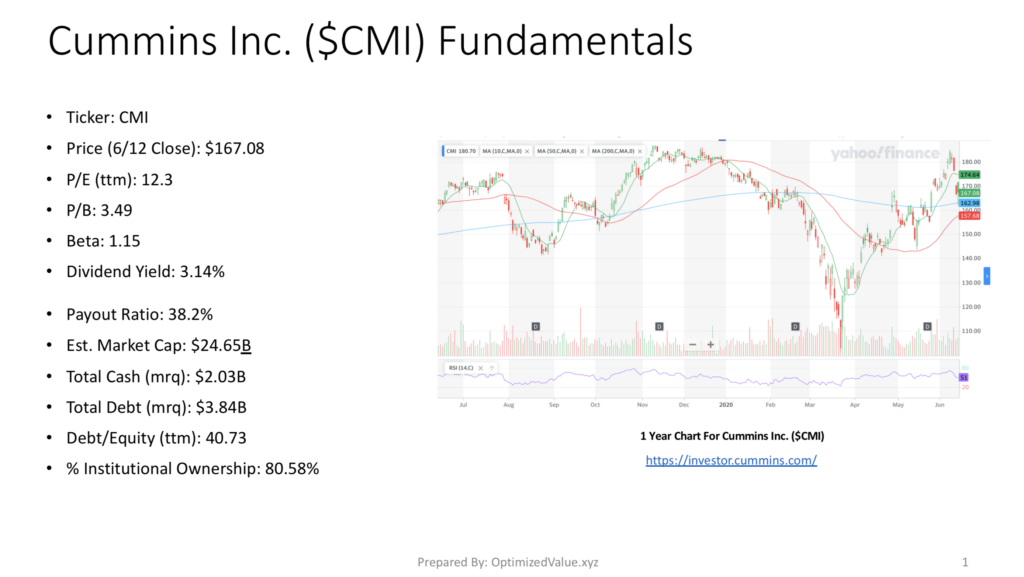
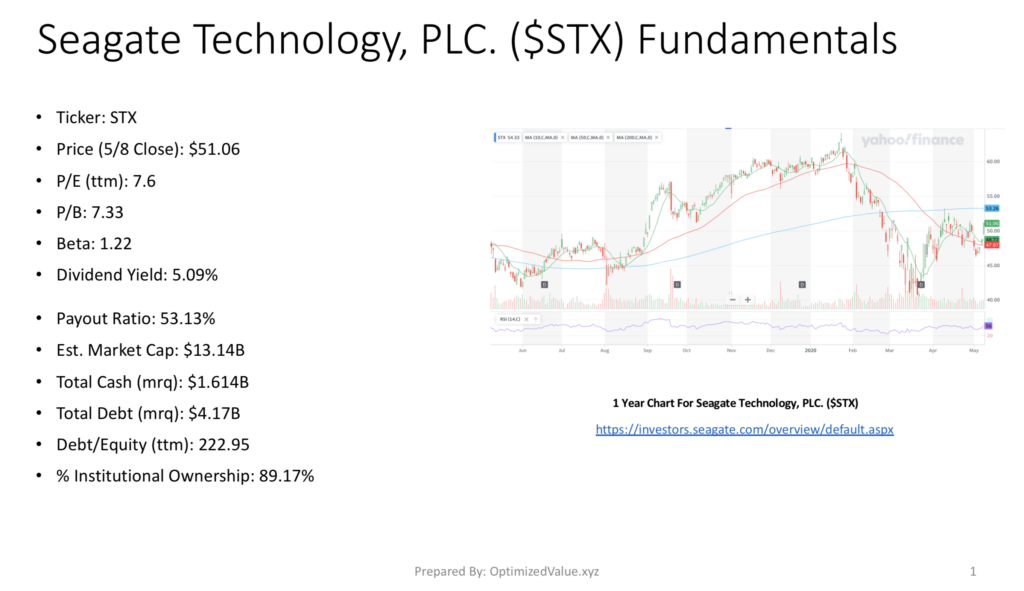
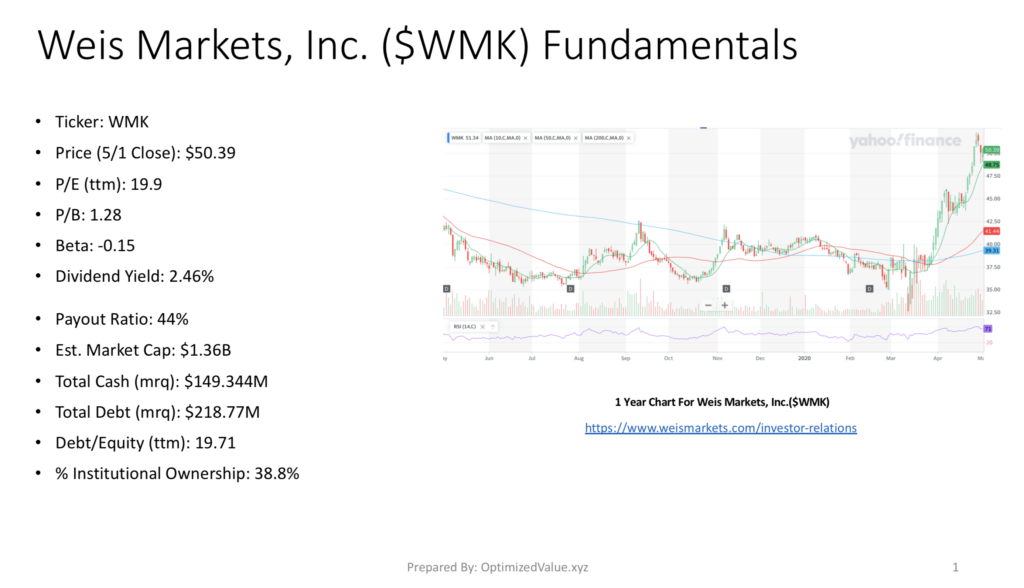
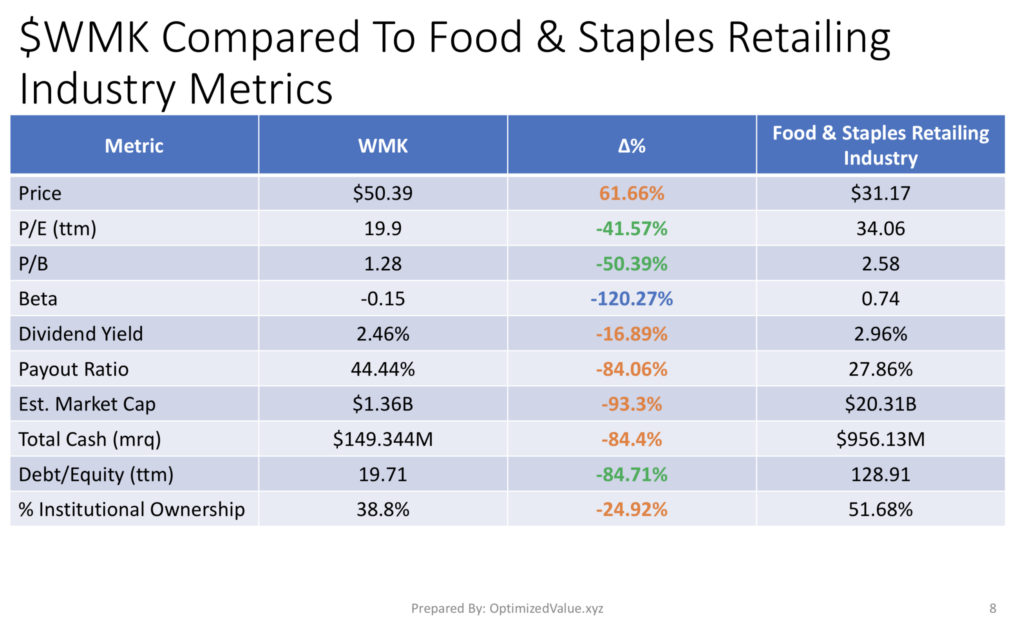
United Parcel Service, Inc.’s stock has a P/E (ttm) of 31.2, with a P/B of 31.02 and a 2.57% Dividend Yield.
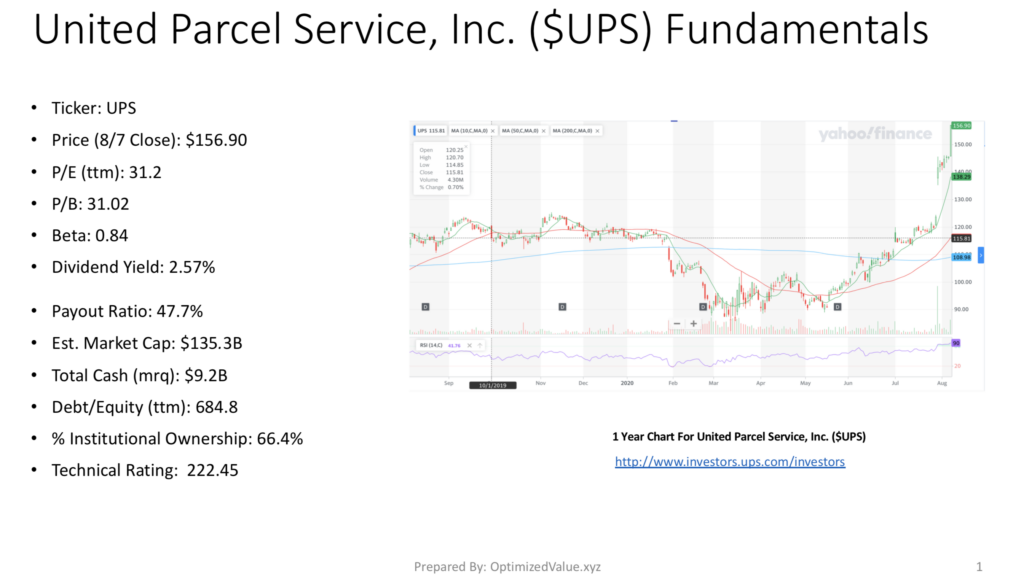
UPS has a Beta of .84, making it less volatile than the general market, with a 66.4% % Institutional Ownership. UPS sports a Market Cap of $135.3B, with $9.2B in Total Cash (mrq) & a Debt/Equity (ttm) of 684.8.
Given the nature of their line of work, it makes sense that UPS’s Price to Book Value & Debt/Equity (ttm) are much higher than the typical stocks we post about here. UPS does not need as many resources to operate as most other companies, given that they are transporting goods, and with their high amount of cash & responsible debt rating we can feel safe with their higher Debt/Equity (ttm) compared to other companies that may have a similar level.
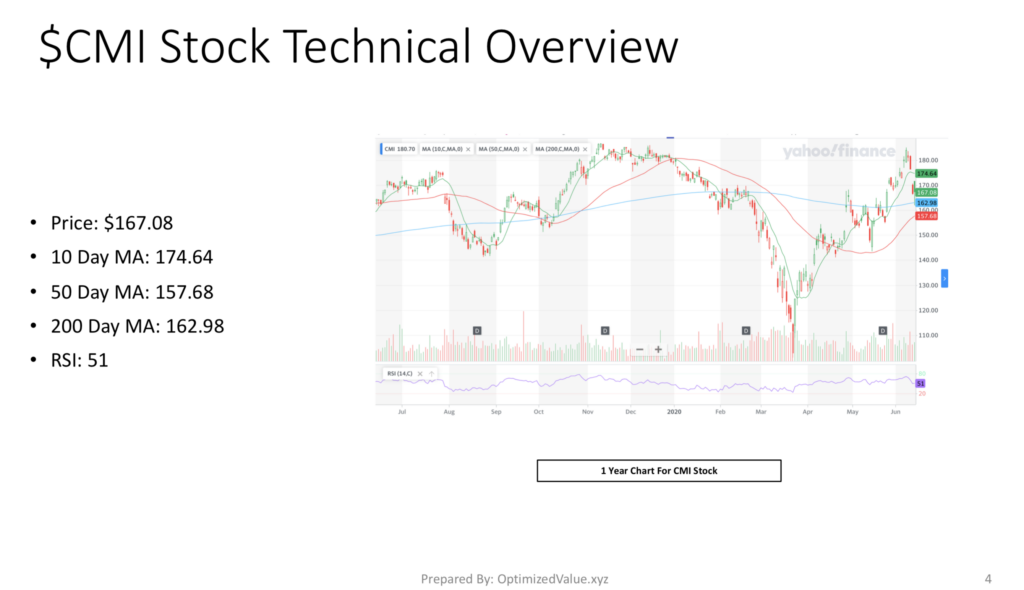
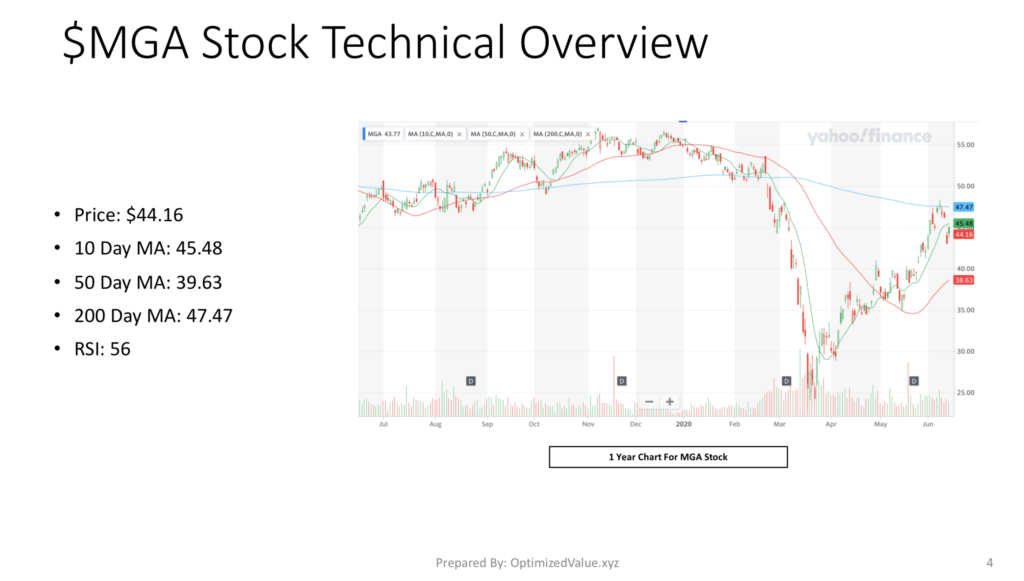
United Parcel Service, Inc. UPS Stock’s Technicals Look Strong
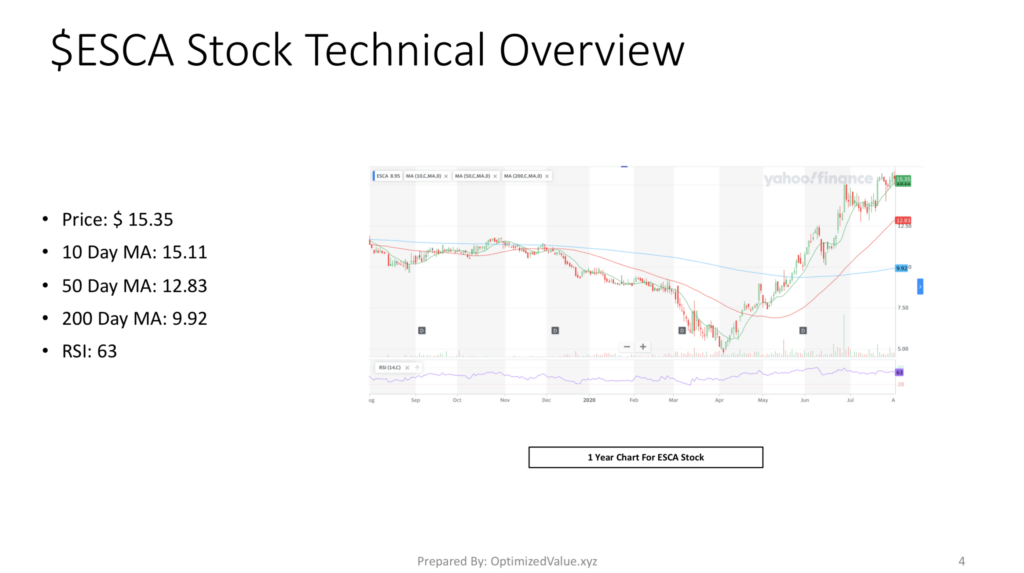
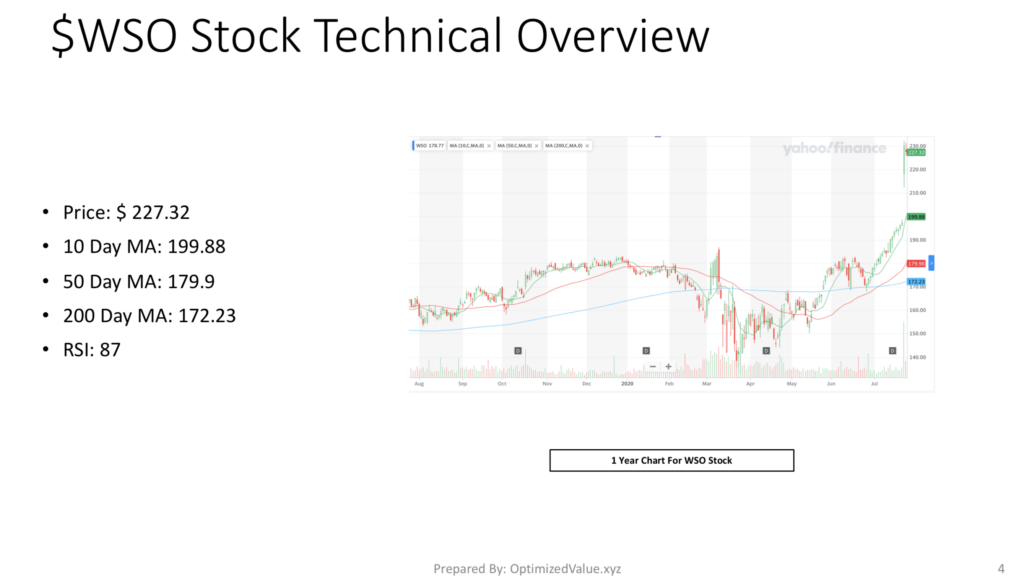
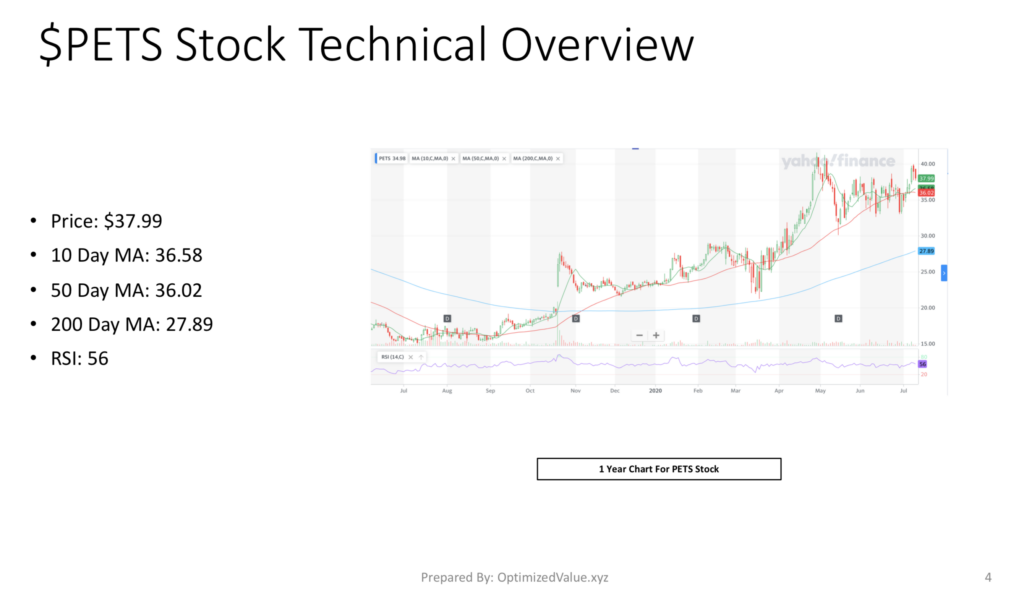
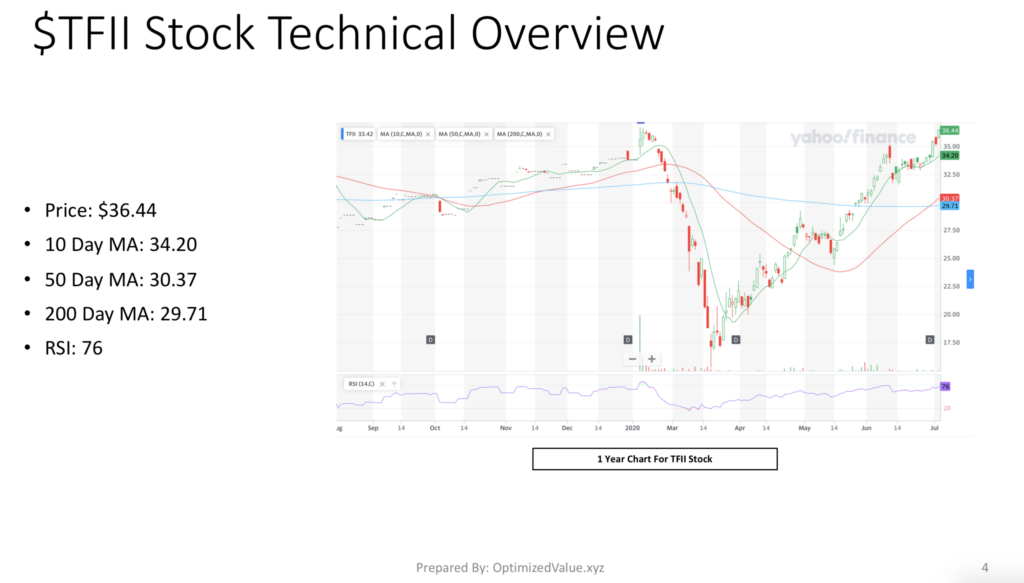
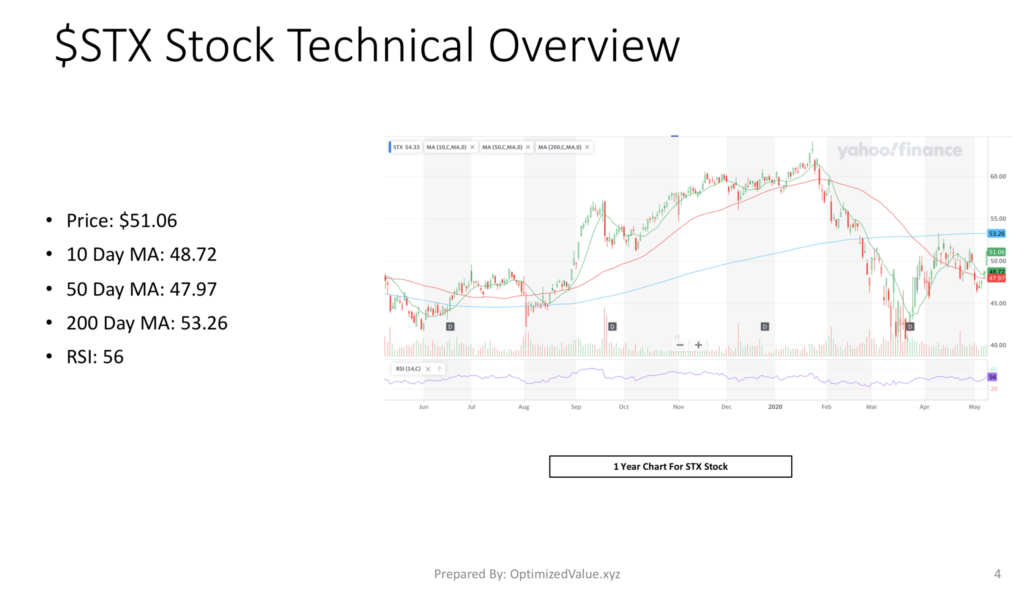
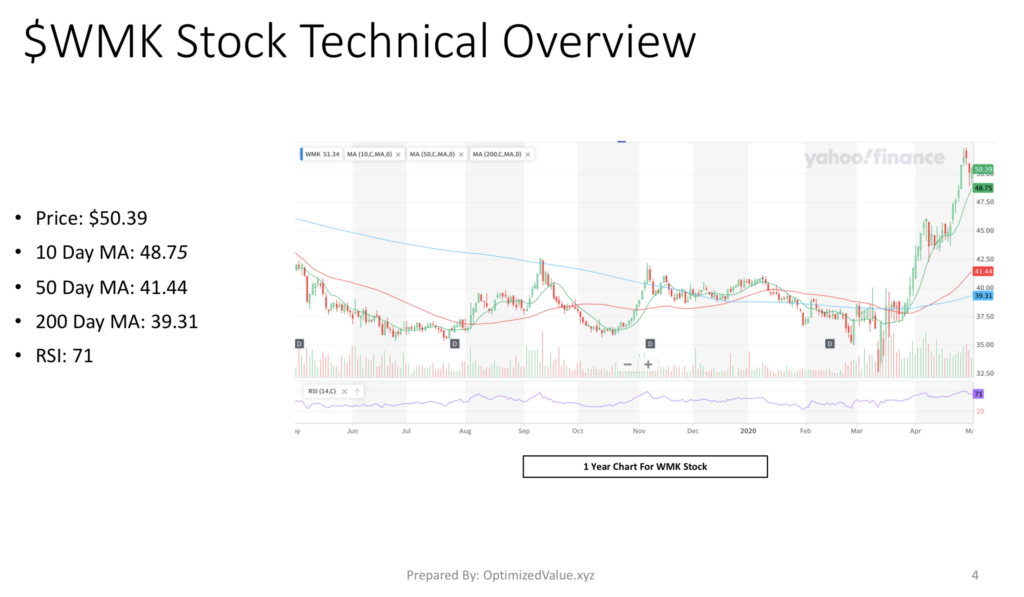
UPS’s stock price is currently $156.90, much higher than its 10-Day Moving Average of 138.29, its 50-Day Moving Average of 116.09 and its 200-Day Moving Average of 108.98.
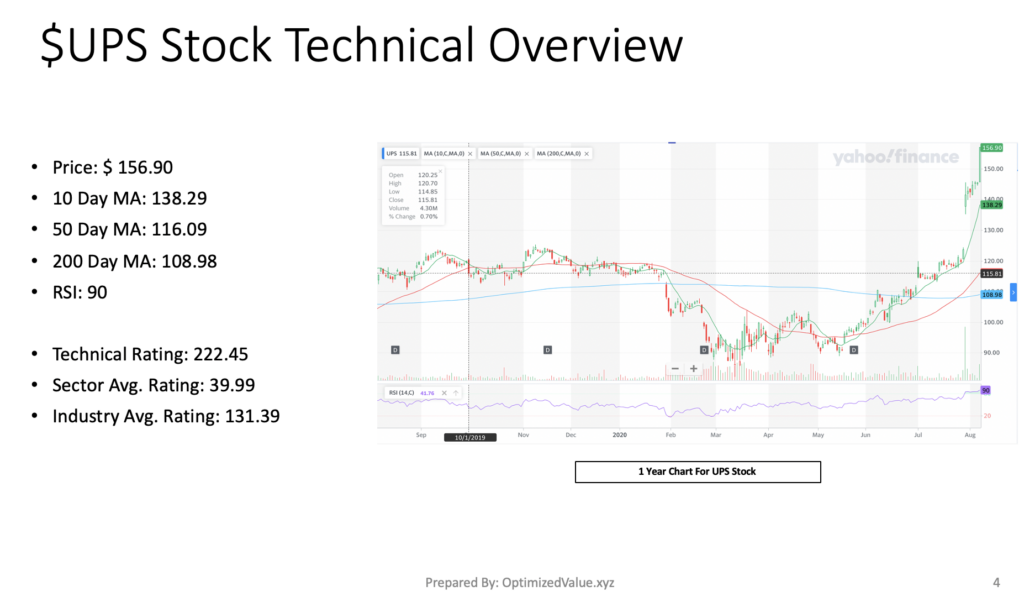
After a bullish gap up at the end of July and further growth into August, their RSI is currently 90, which shows signs of being overbought. However, this is temporary, as while they establish their new trading range their RSI will come back to a more reasonable level.
Using our technical analysis rating formula, UPS scores 222.45, outperforming their sector peers’ average of 39.99, and their industry peers’ average of 131.39.
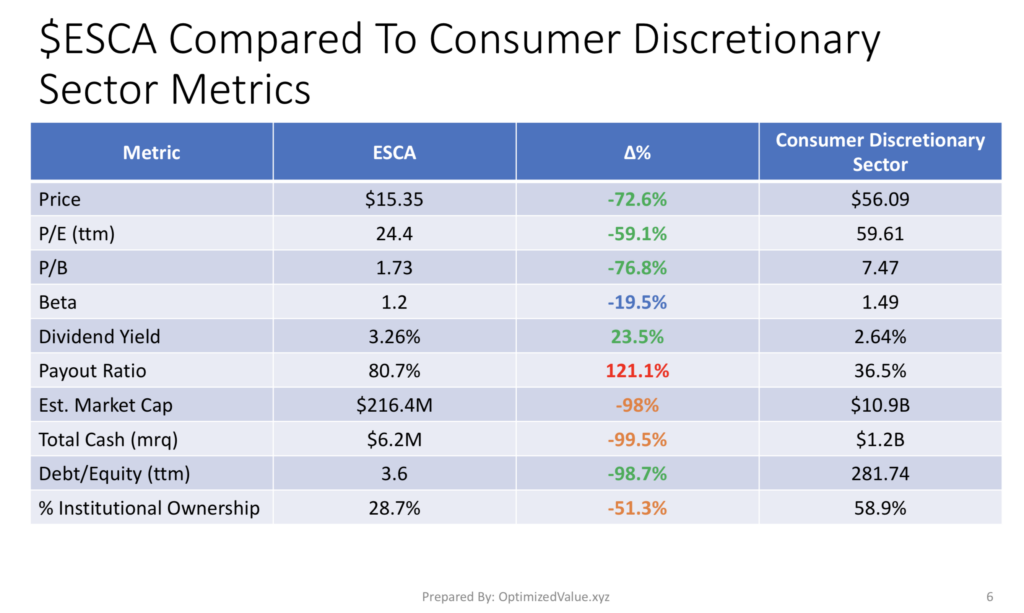
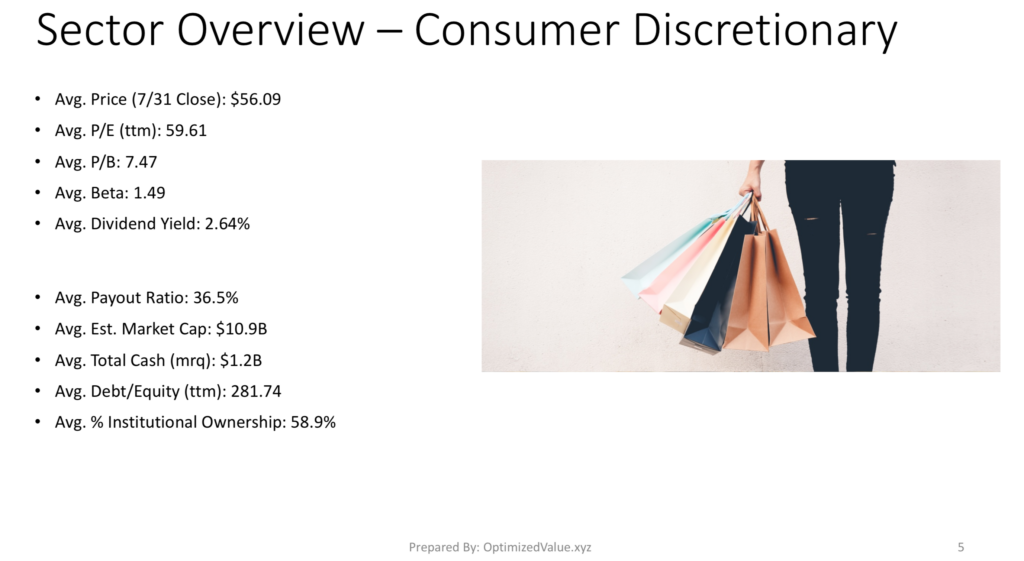
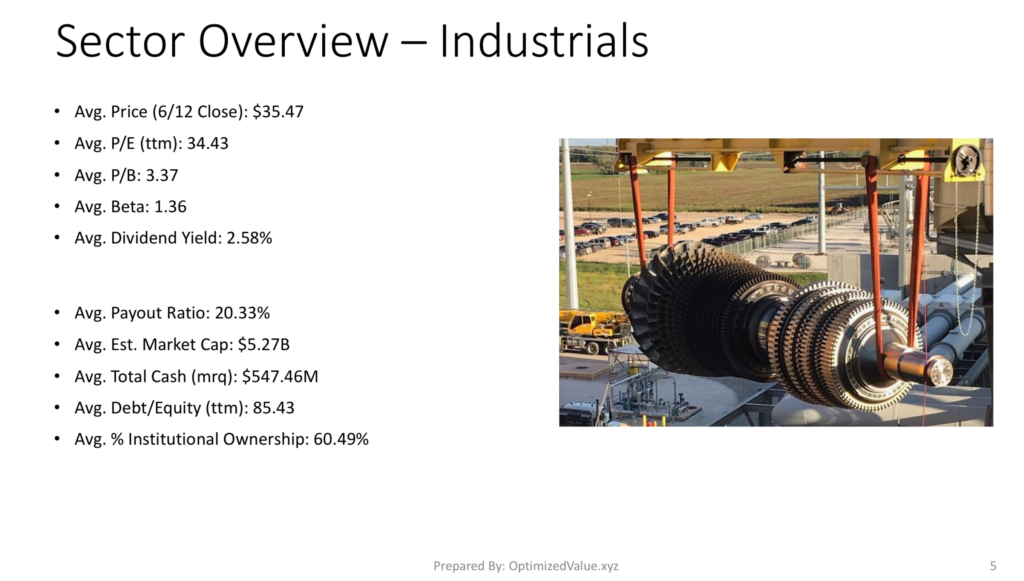
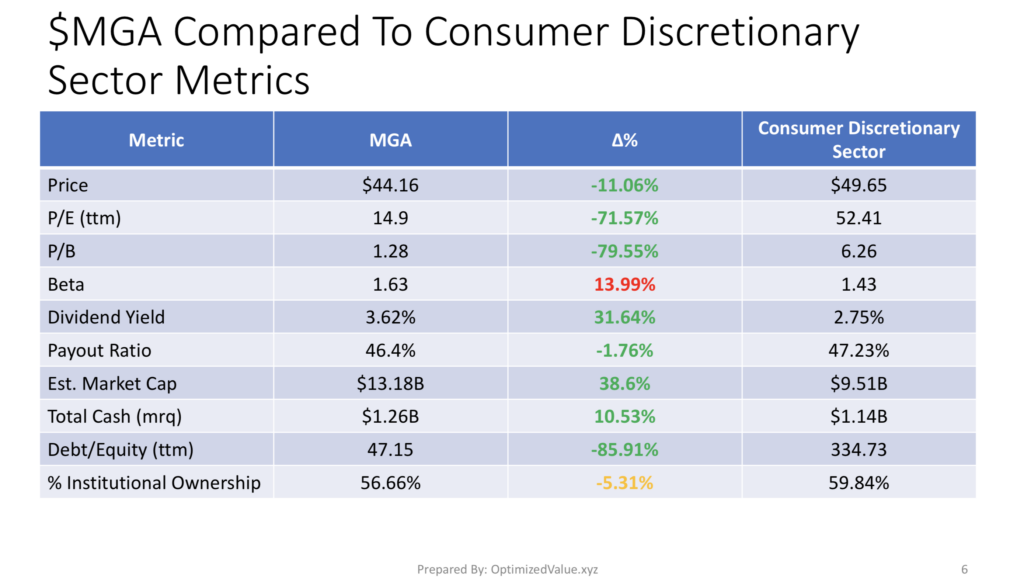
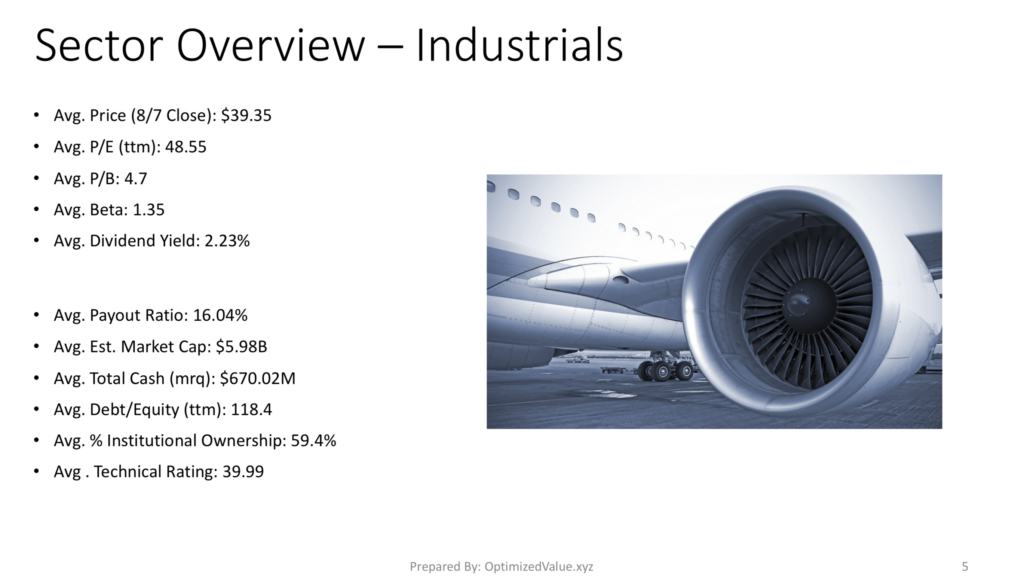
United Parcel Service, Inc. UPS’s Stock Fundamentals Vs. The Industrials Sector Averages
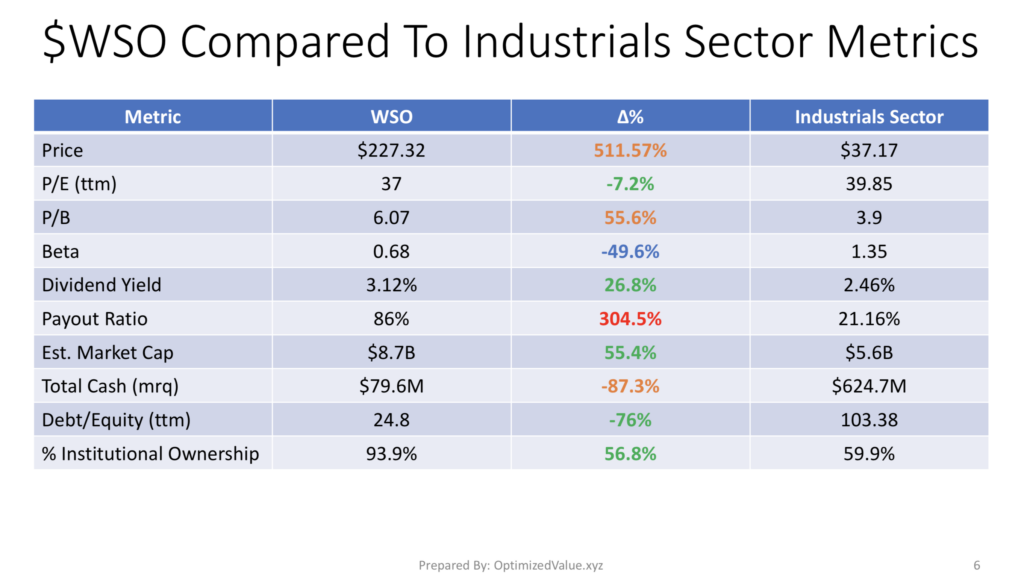
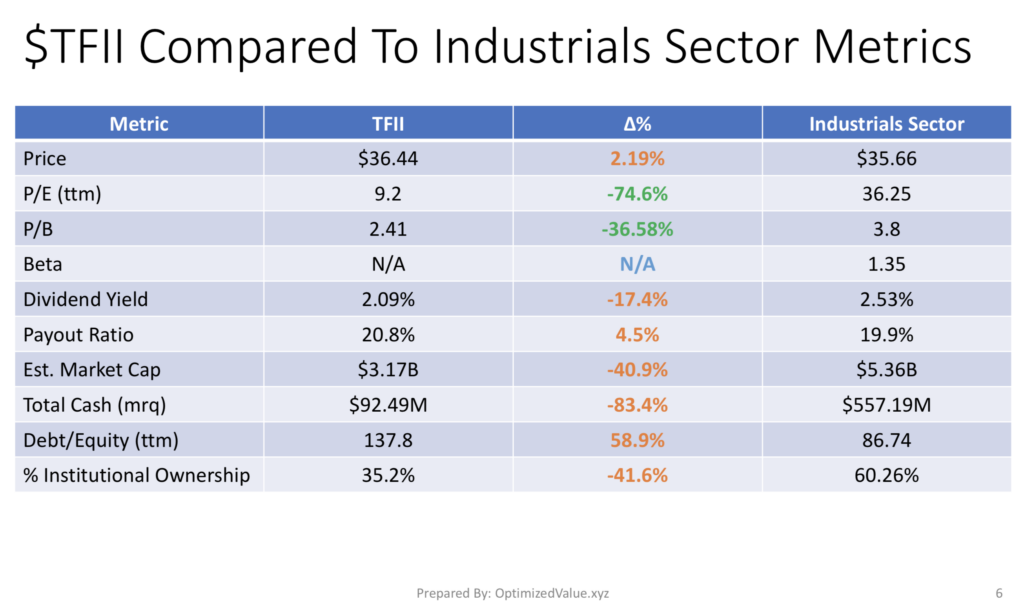
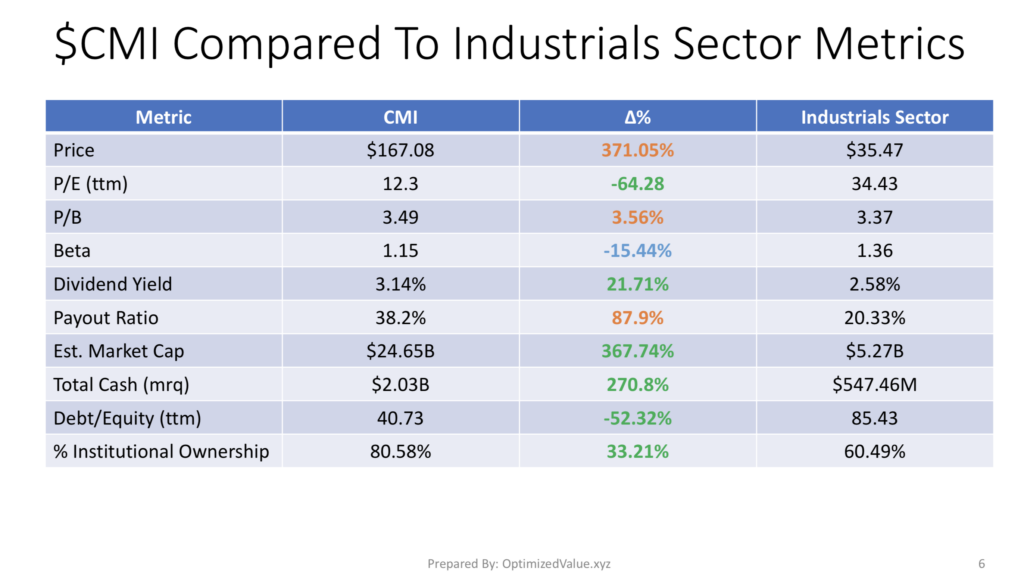
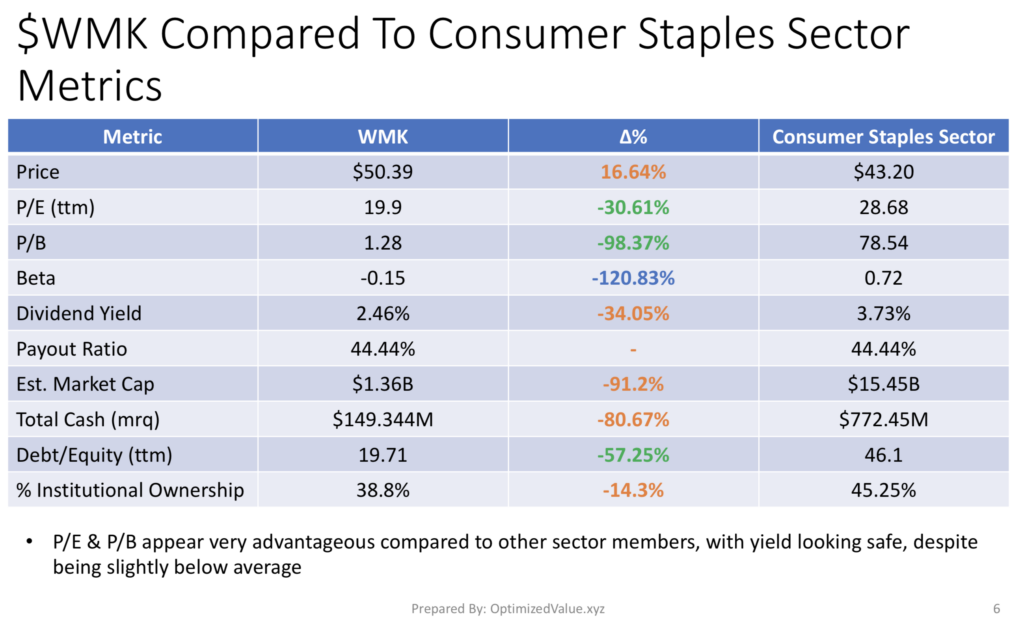
UPS stock’s P/E (ttm) is almost 36% lower than their average Industrials Sector peer, with a 15% better than average Dividend Yield.
While their Payout Ratio is 197% higher than average, at 47.7% it is still a safe & healthy dividend.
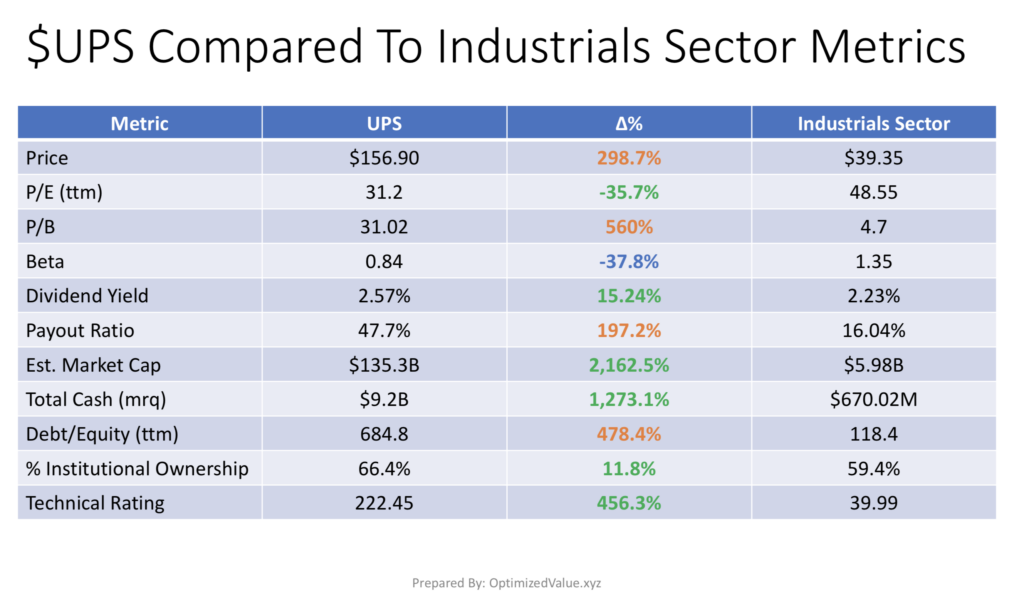
UPS’s Market Cap is 2,162.5% higher than the industrials sector average, and their Total Cash (mrq) is 1,273% higher than average.
Their % Institutional Ownership is 11.8% higher than average, with a 456% advantage over their average peer in our Technical Rating.
As mentioned prior, their Debt/Equity (ttm) is above average (+478%) & their P/B is 560% higher than average.
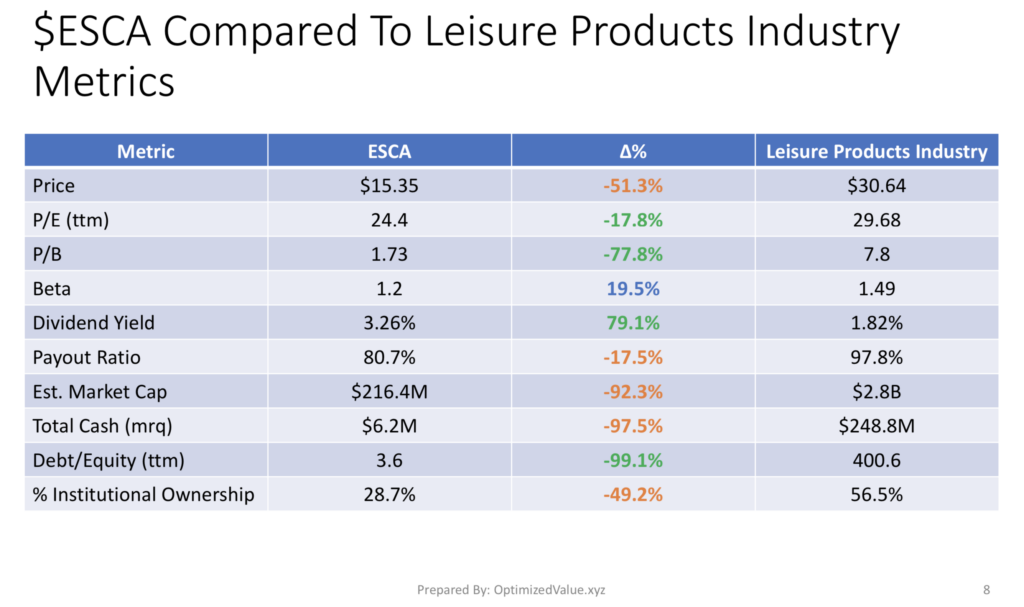
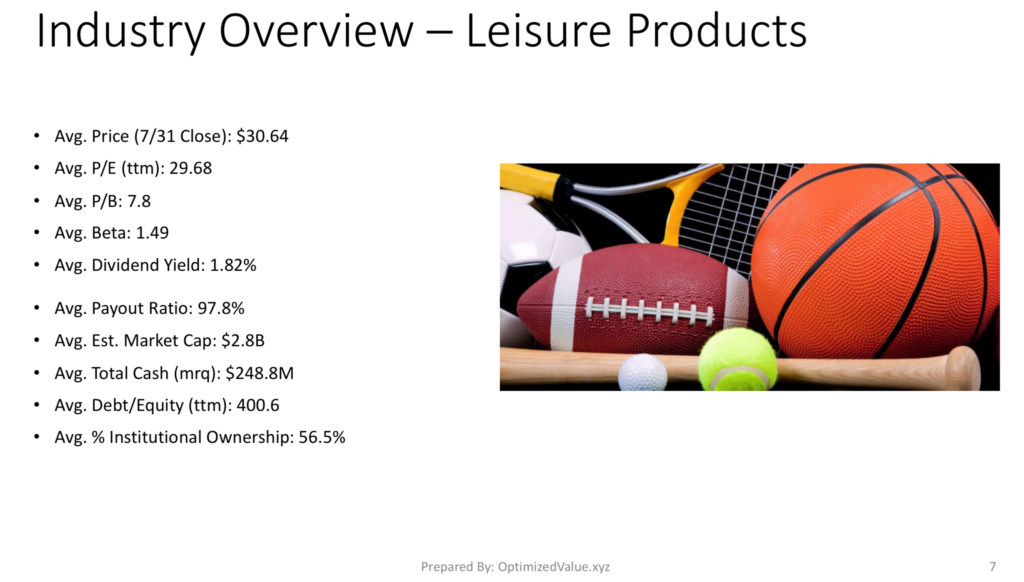
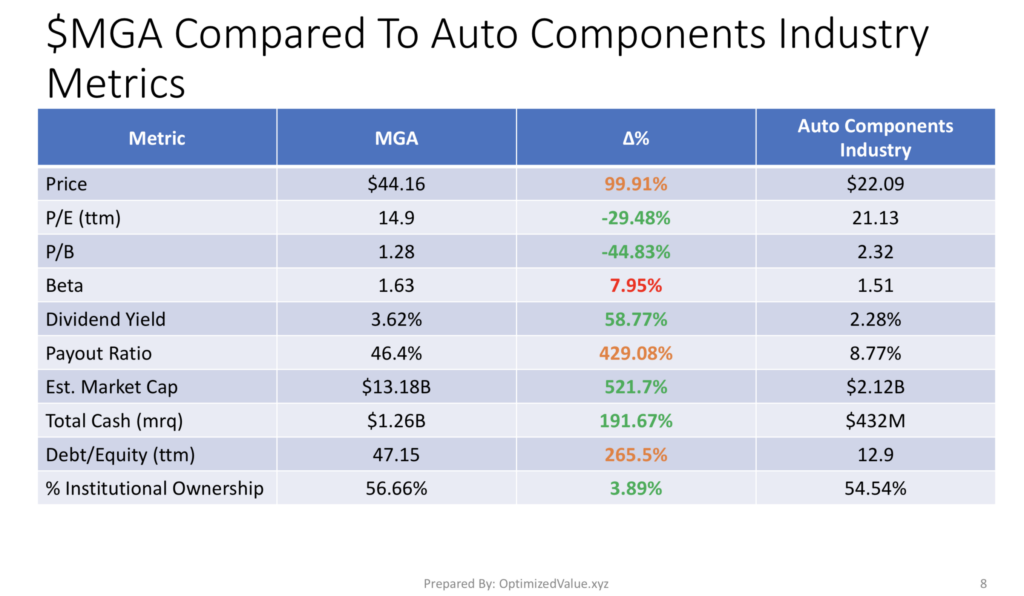
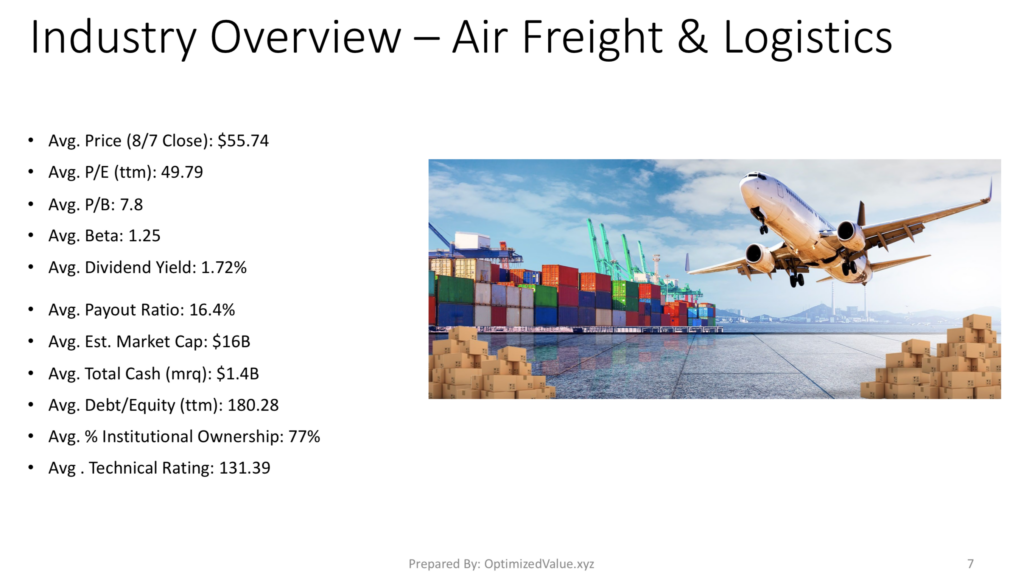
United Parcel Service, Inc. $UPS’s Stock Vs. The Air Freight & Logistics Industry Average Fundamentals
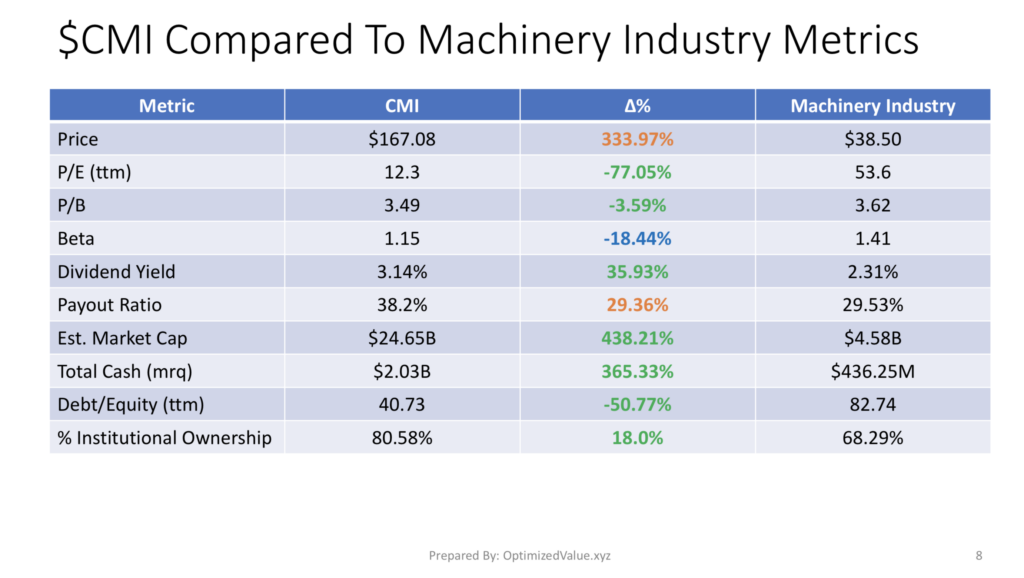
United Parcel Service, Inc.’ stock has a 37% lower P/E (ttm) than their average Air Freight & Logistics Industry peer, and a 49% higher than average Dividend Yield.
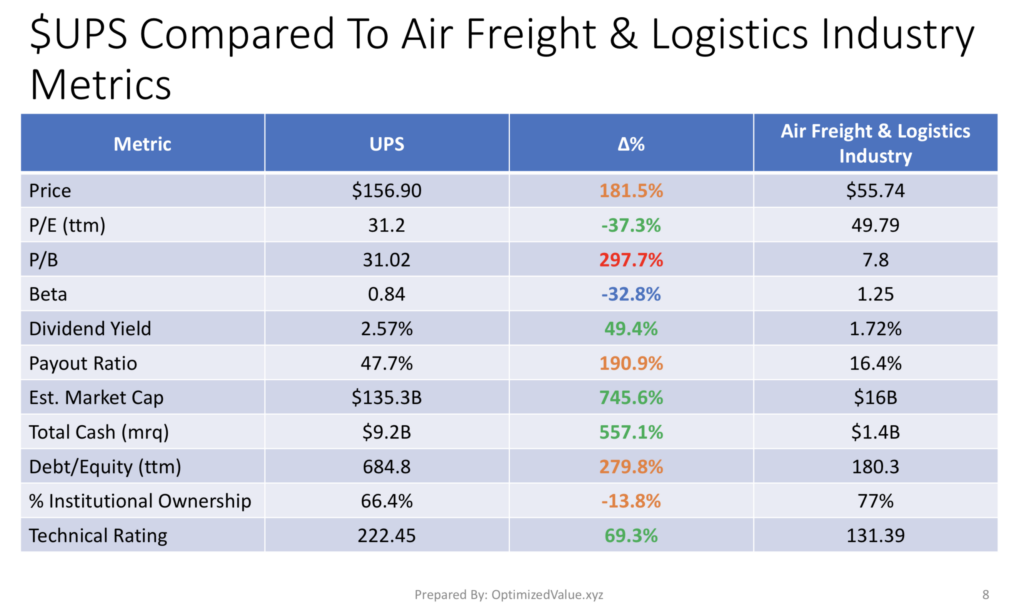
UPS’s Market Cap is 745.6% higher than their average Air Freight & Logistics peer, and they have a 557% higher than average Total Cash (mrq) .
UPS’s Technical Rating is 69% above average for the Air Freight & Logistics Industry.
Their Debt/Equity (ttm) is 279.8% higher than average, with a 14% lower than average % Institutional Ownership.
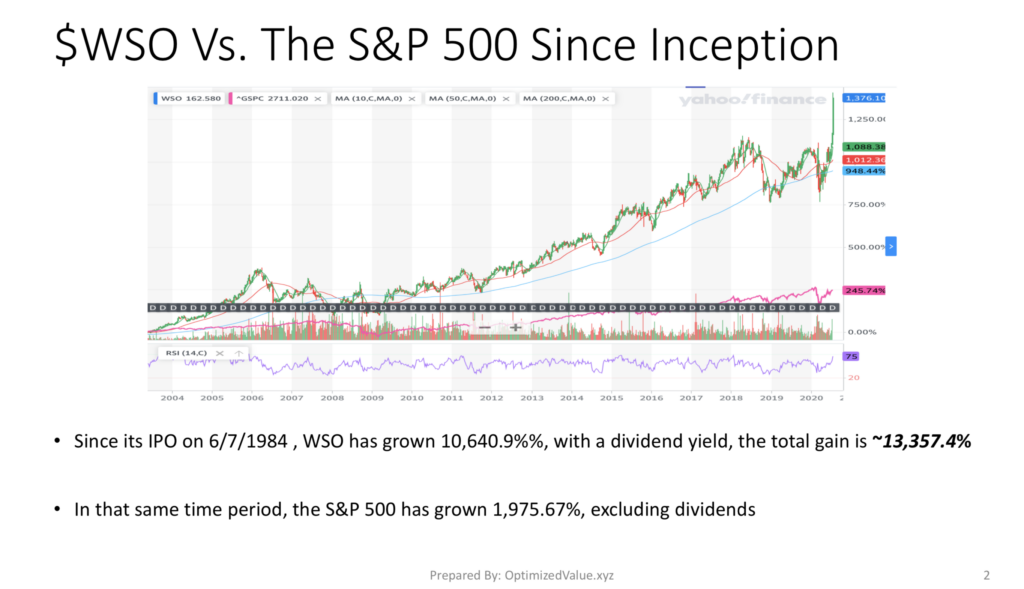
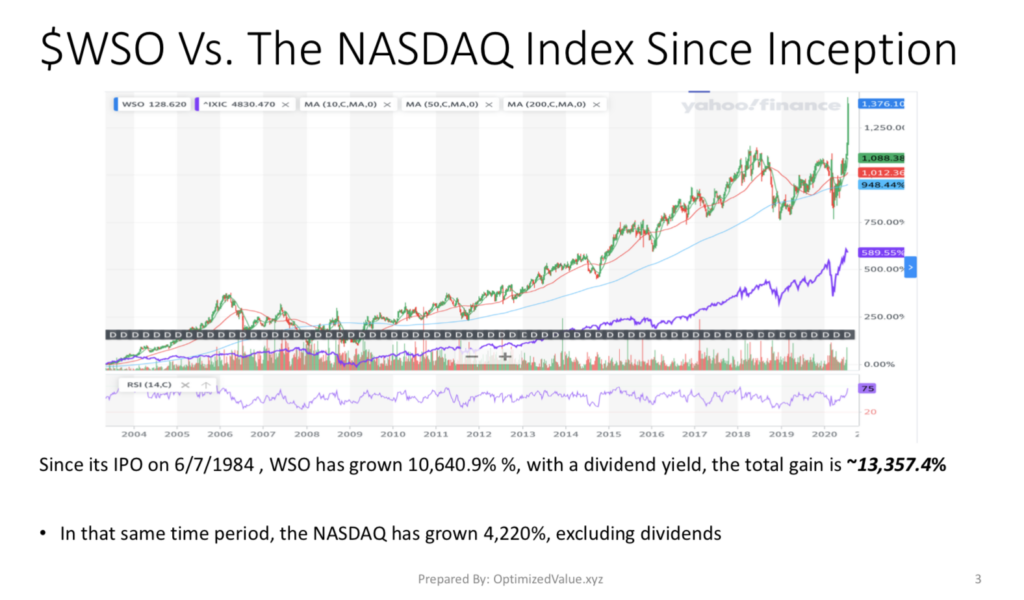
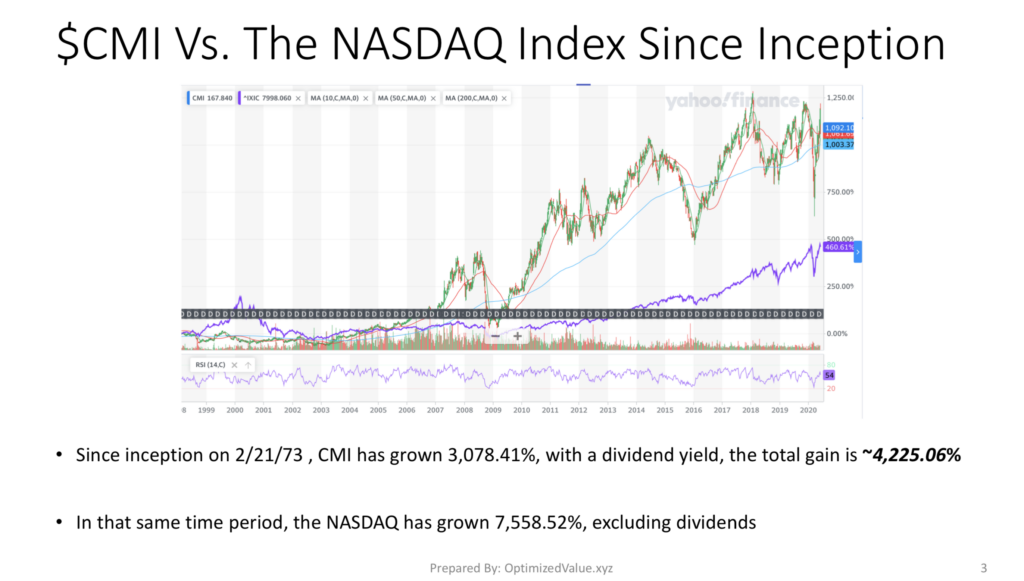
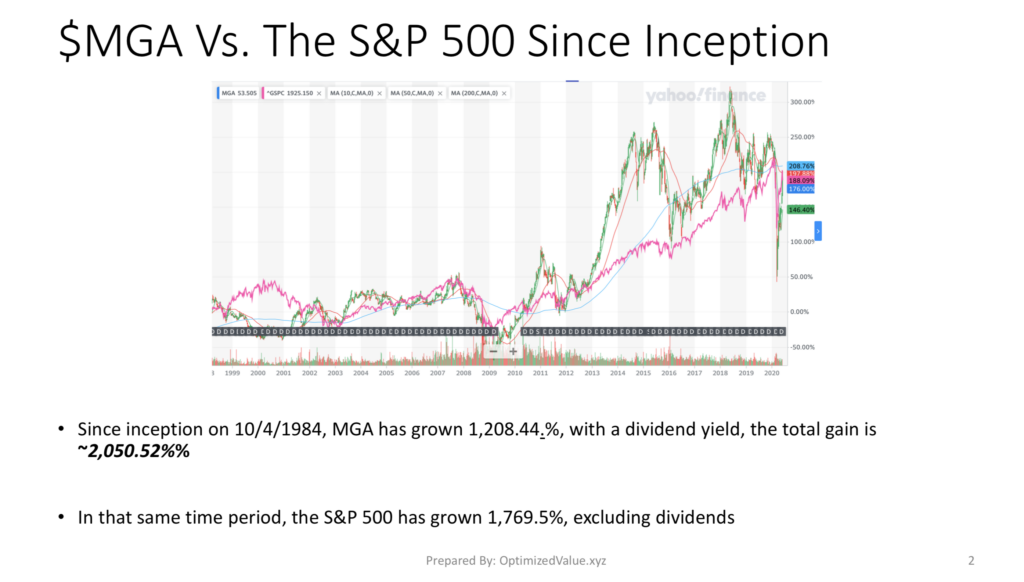
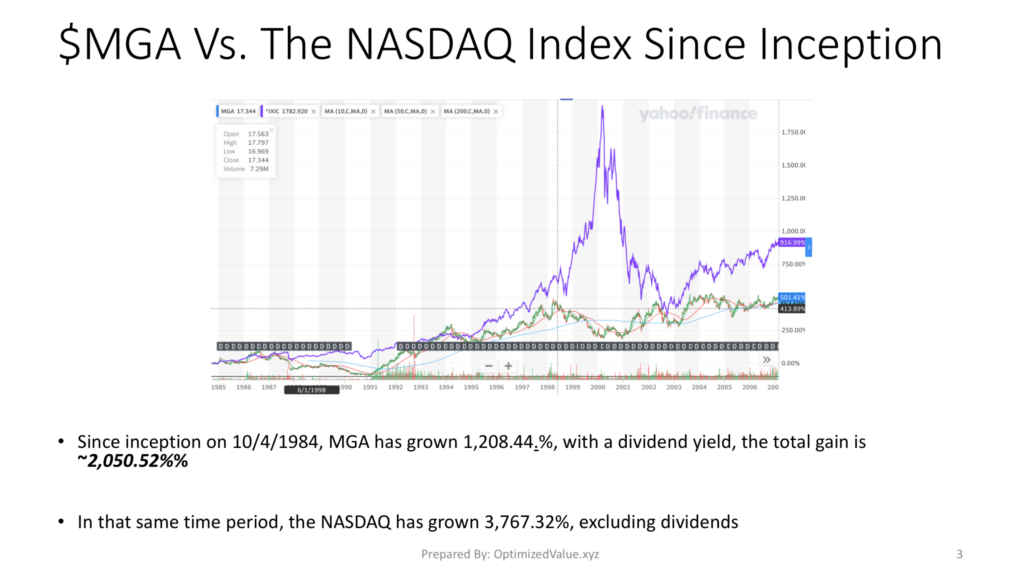
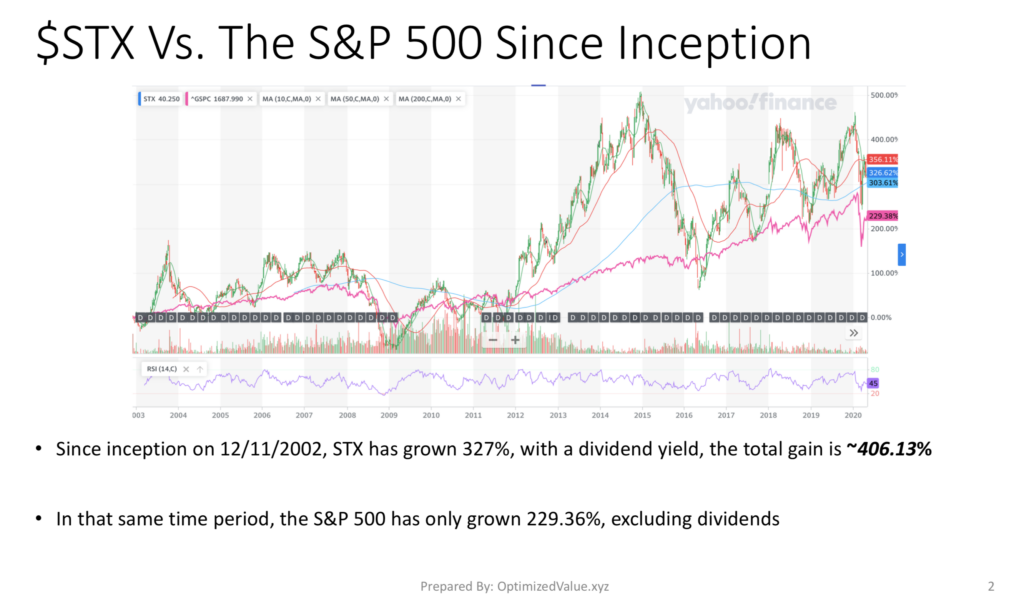
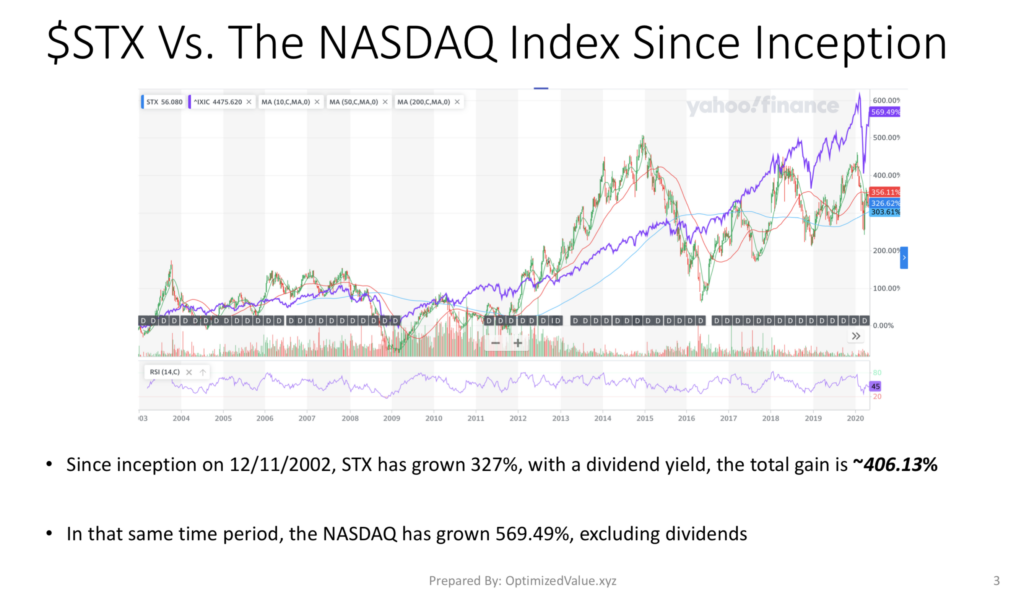
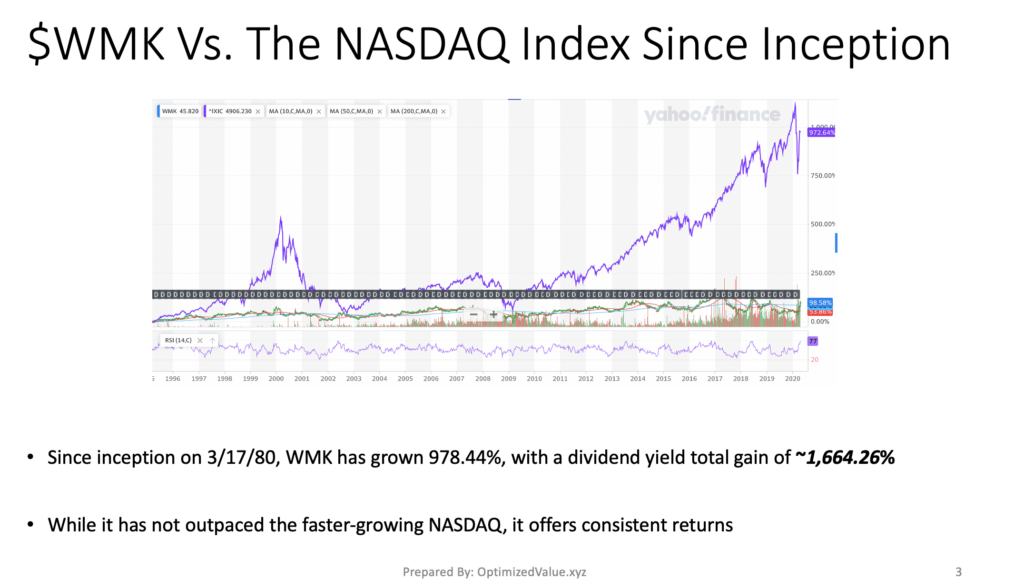
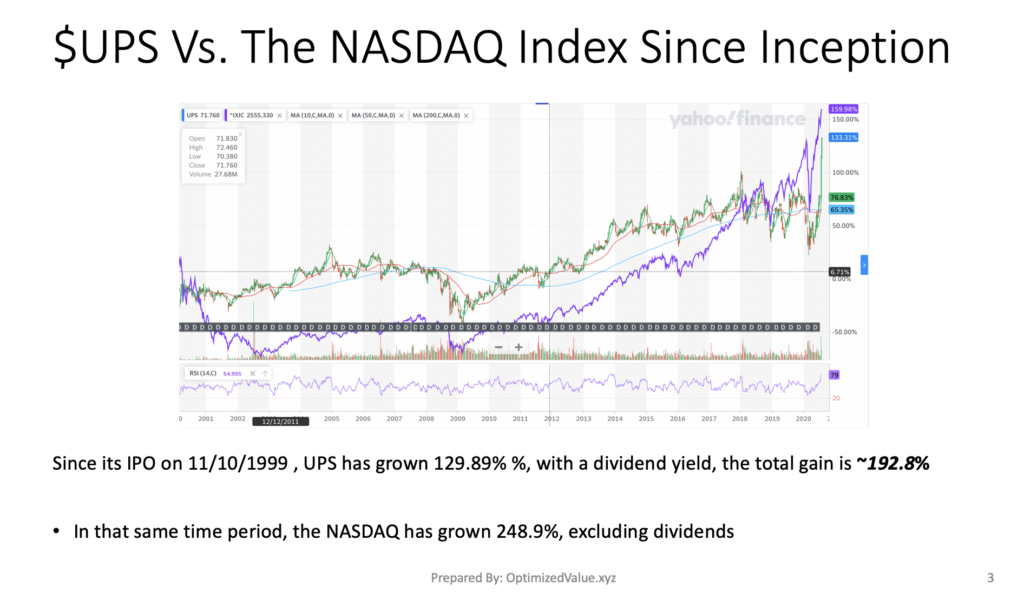
United Parcel Service, Inc. $UPS’s Stock Performance Vs. The S&P 500 & NASDAQ Since Its IPO
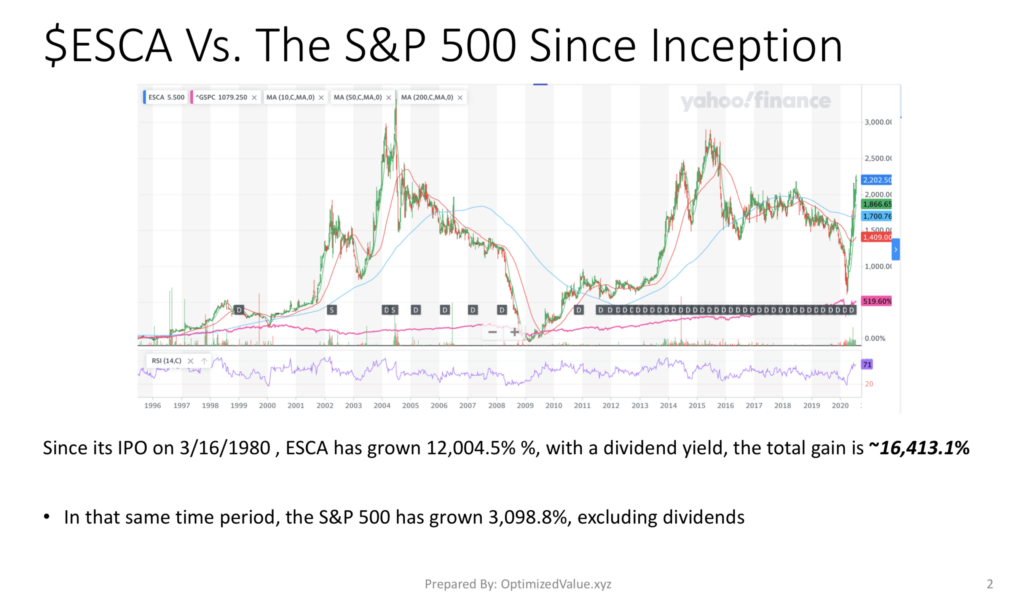
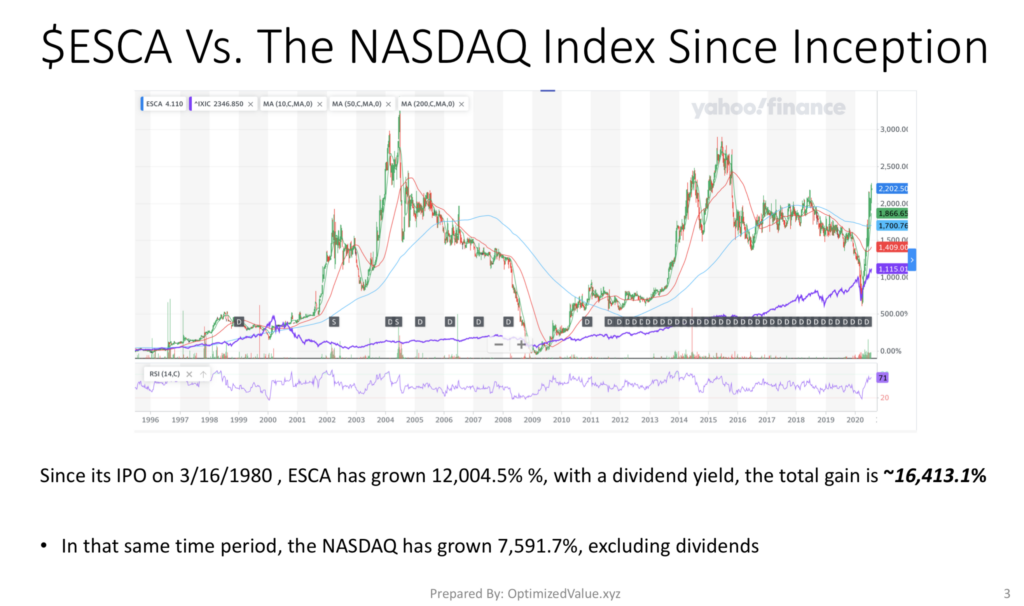
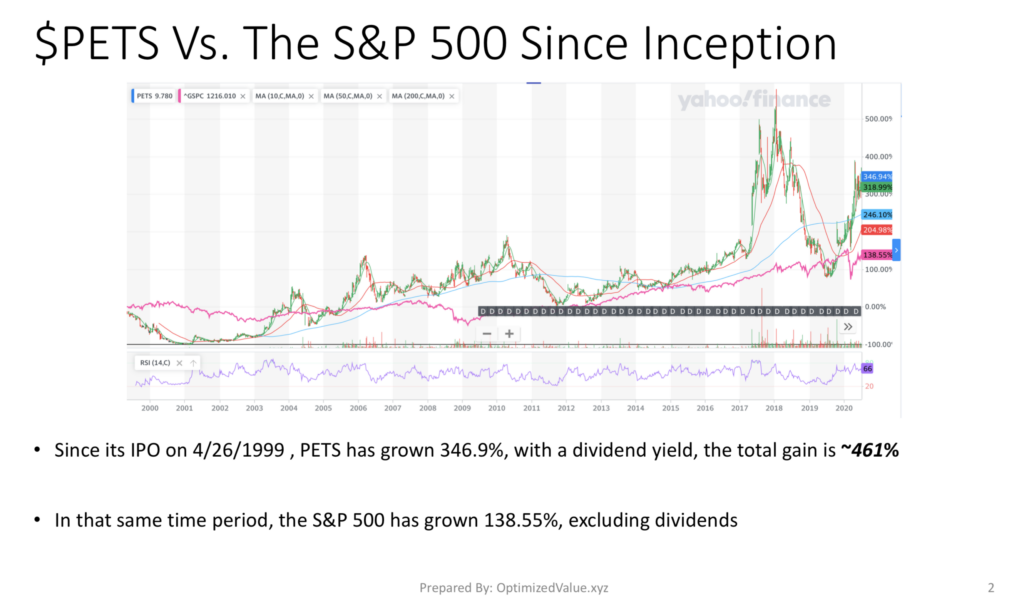
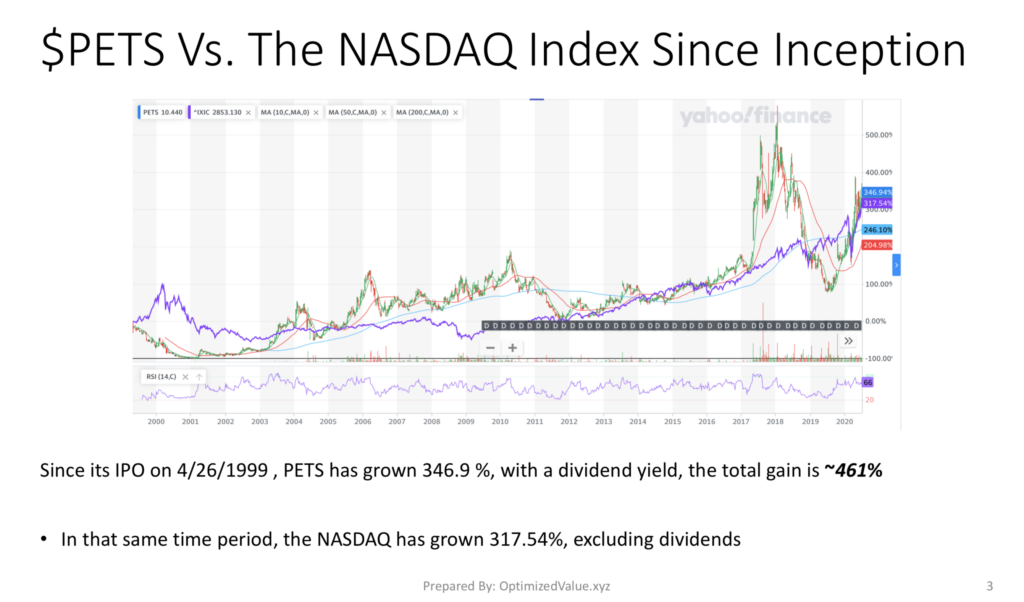
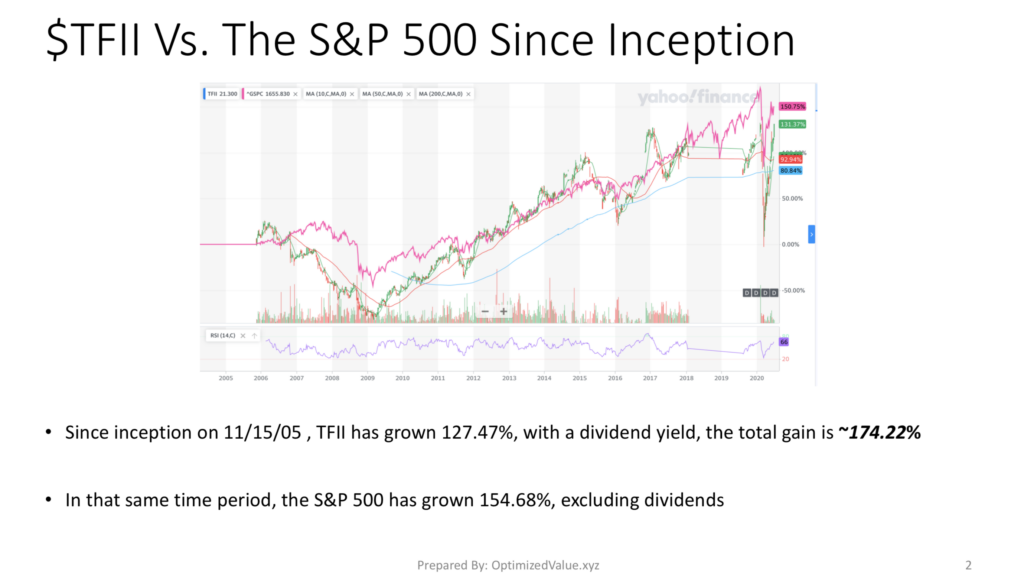
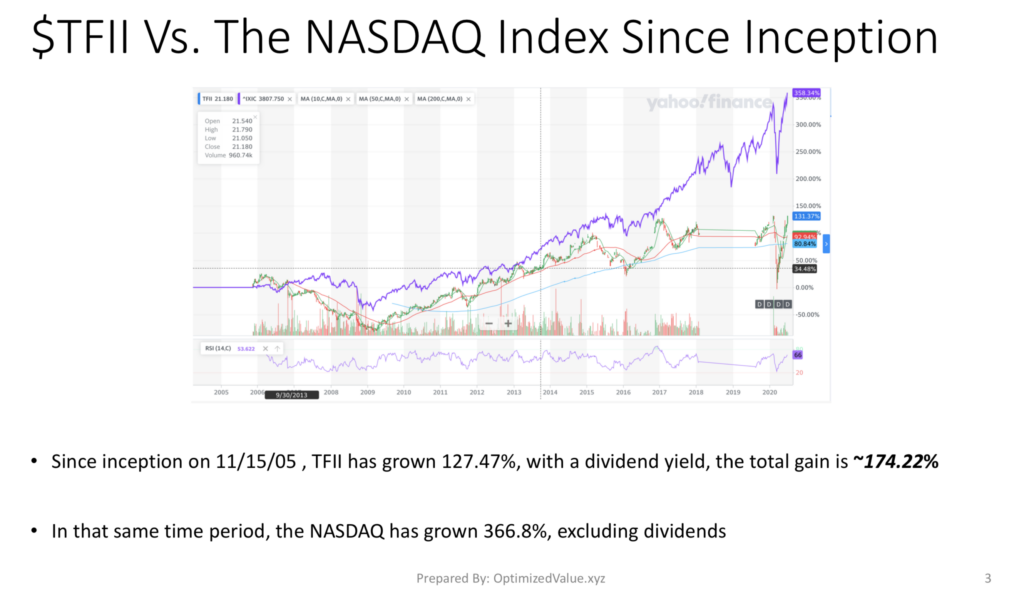
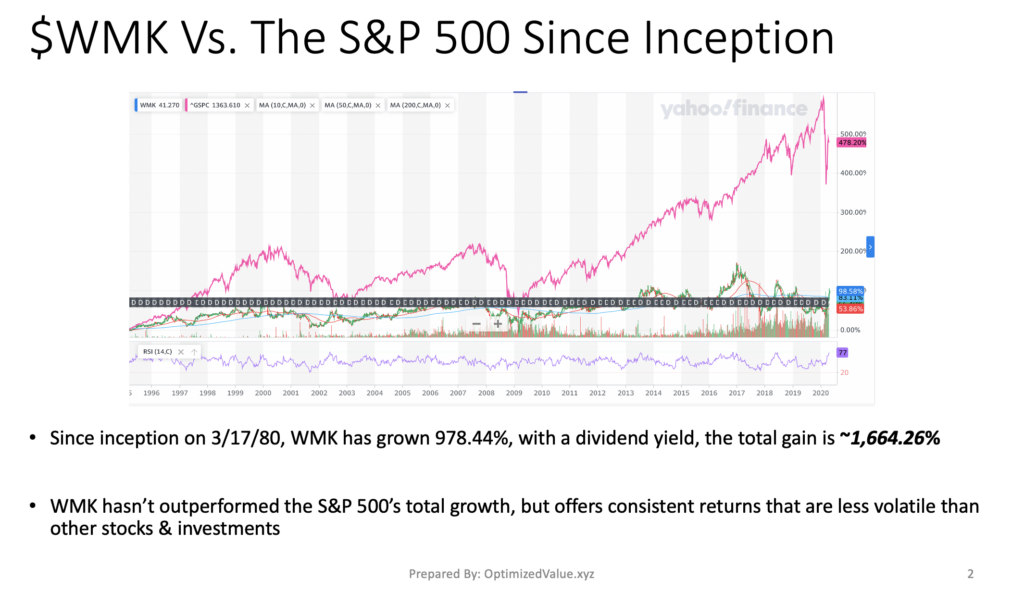
UPS’s stock first began trading on 11/10/1999, and has since grown by 129.89%. When we add in the dividends that were paid over that time, the total gain becomes 192.8%.
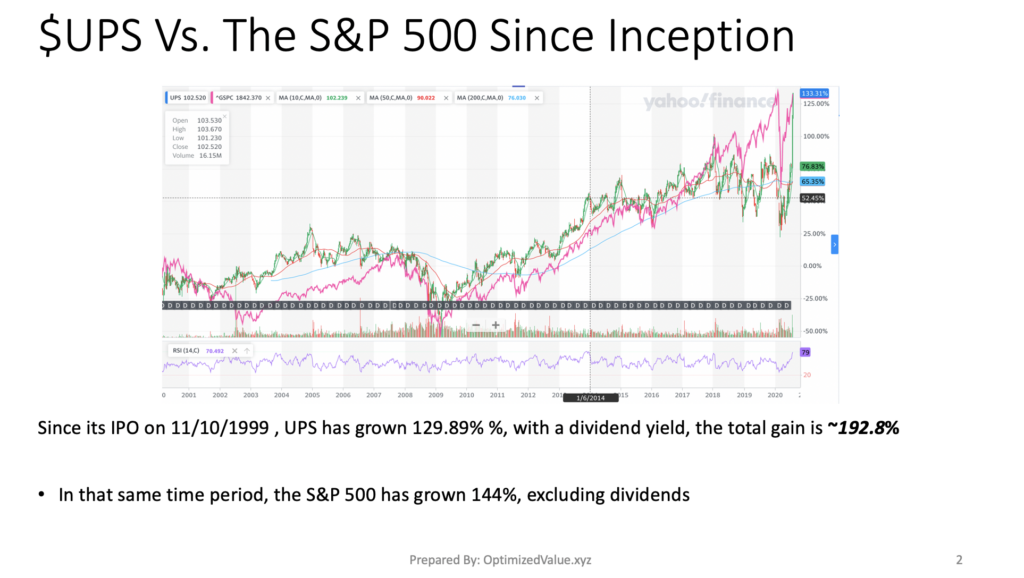
In that time the S&P 500 has only grown 144% excluding dividends, while the NASDAQ has grown 248.9% in that same time period (also excluding dividends).
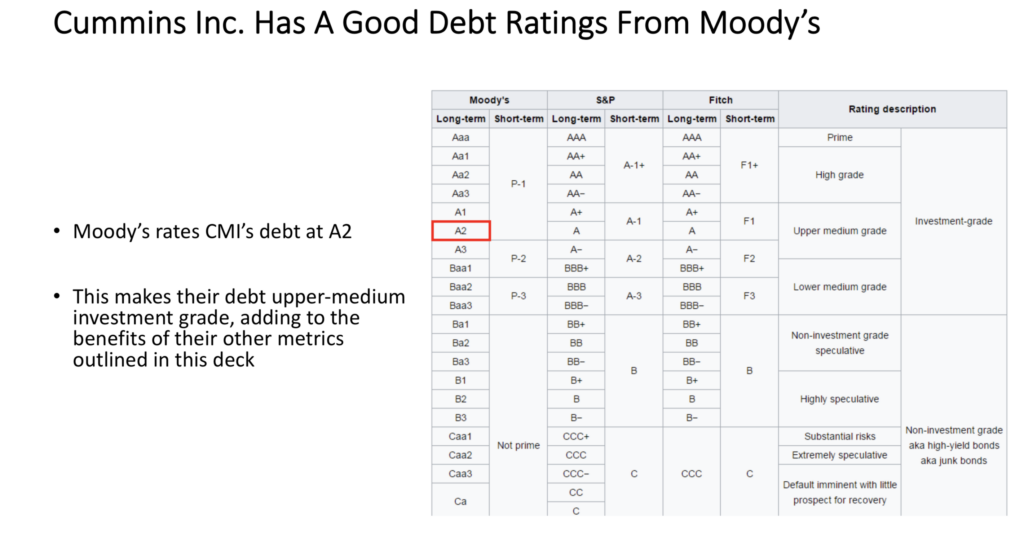
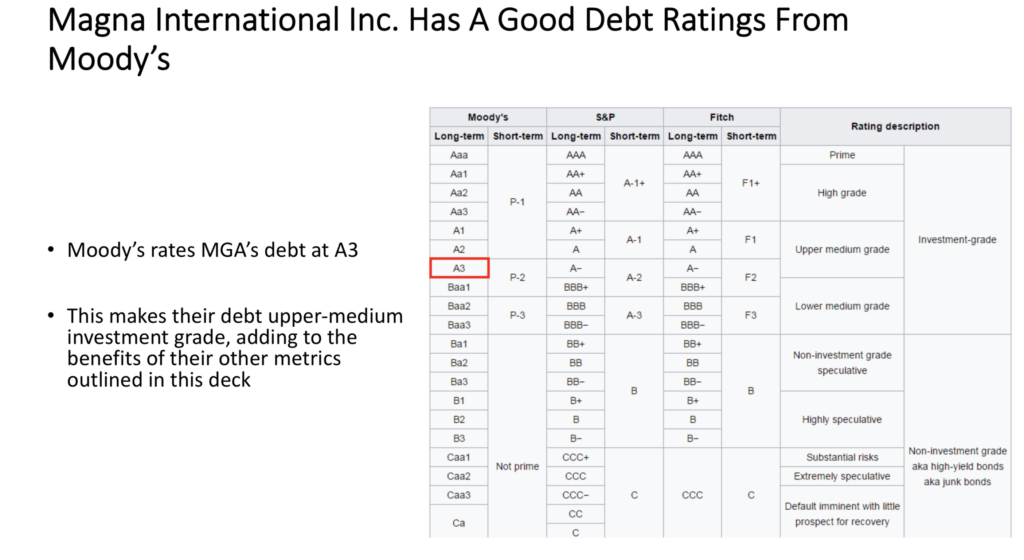
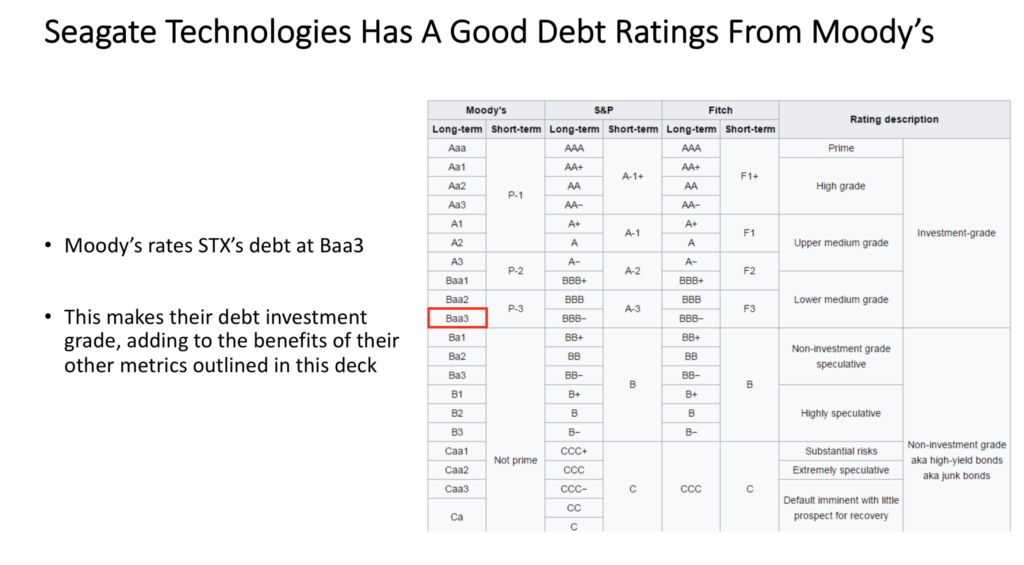
United Parcel Service, Inc. $UPS Has A Solid Debt Rating From Moody’s
Moody’s rates United Parcel Service, Inc.’s Debt Rating an A2, which is considered Upper Medium Investment Grade.
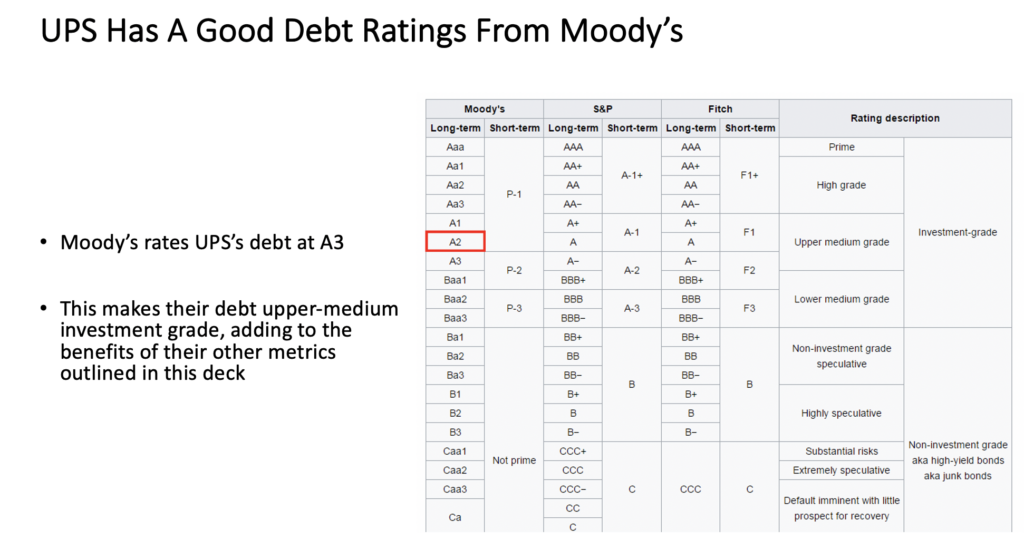
This is an additional sign of strength, especially given that we have been discussing their Debt/Equity (ttm) being higher than what we would like to see. Moody’s sees UPS as being able to service its debt obligations.
Tying It All Together
UPS stock offers many advantages both from a trading & investing perspective. Their growth has been in line with the general market indexes since they IPO’d, and they have some solid fundamental advantages over many of their peers.
As they just experienced a large surge in price growth, I’ll be keeping my eyes out to see what new range they establish, where I can find an advantegeous entry point to build a position.
For A Full PDF Report:
*** I DO NOT OWN SHARES IN UPS STOCK ***