JETS, the U.S. Global Jets ETF has had a volatile year, climbing +17.81% from their 52-week low in September of 2022, but declining -22.67% from their 52-week high in July of 2023 (ex-distributions).
The ETF is composed of Southwest Airlines Co. (LUV, 9.98%), Delta Air Lines Inc. (DAL, 9.96%), United Airlines Holdings Inc. (UAL, 9.8%), American Airlines Group Inc. (AAL, 9.77%), Hawaiian Holdings Inc. (HA, 3.11%), Alaska Air Group Inc. (ALK, 3.07%) & more.
As broader market volatility heats up it’s worth checking in to see how buyers:sellers have interacted at the various prices that JETS has traded at in recent history (4-5 years) in order to better anticipate how they may behave in the near-future & to have an understanding of how strong support & resistance levels may be.
The Price:Volume analysis below seeks to display the volume at specific share-price levels from over the past one-to-two years & is intended to serve as a reference point for how investors viewed JETS ETF’s value at each level.
It also includes a list of moving averages, as well as support & resistance levels, which will be marked in bold.
Breaking Down The Technicals & Price:Volume Sentiment For JETS, The U.S. Global Jets ETF
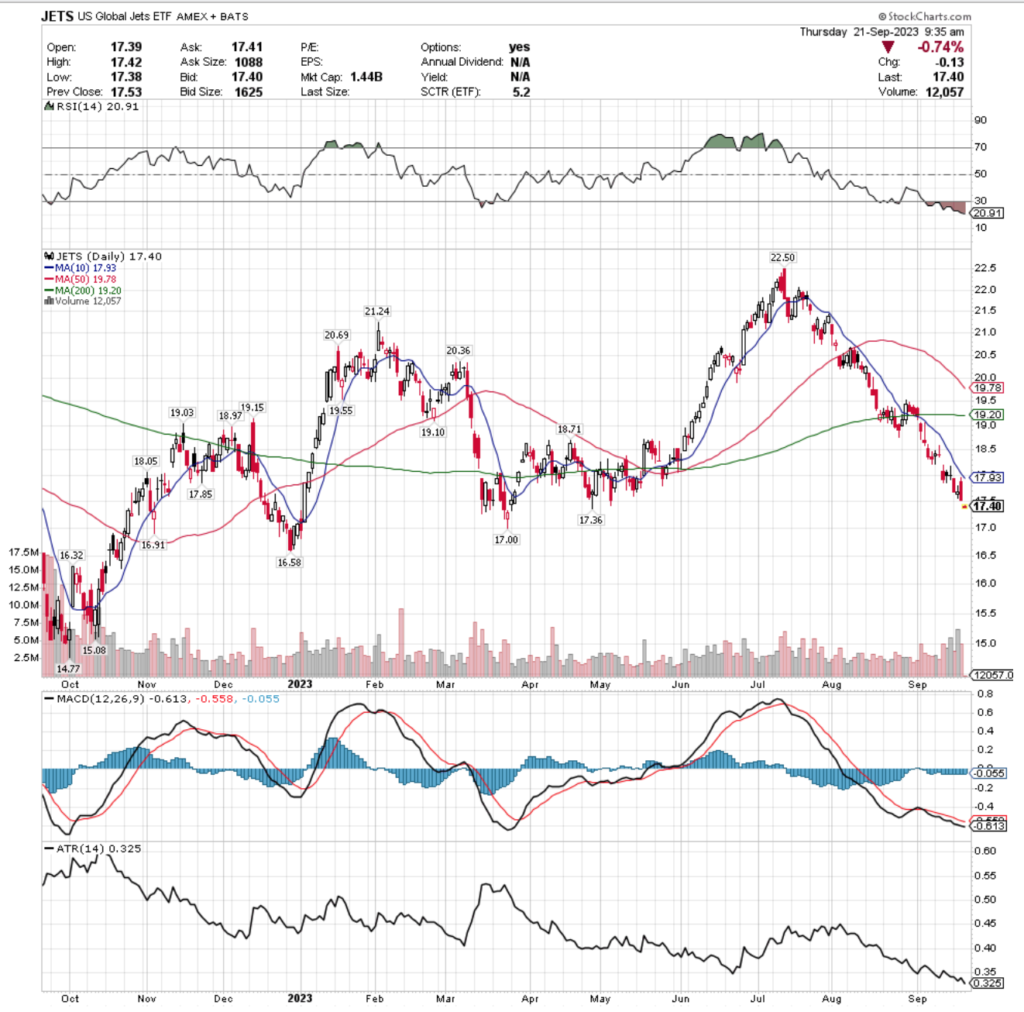
Their RSI is deeply oversold at 20.91, while their MACD is bearish but flattening out to attempt a bullish crossover in the coming week.
Unlike the major indexes & many of the other names that we have dug into this week, JETS has traded at +13.1% higher than average volume over the past week & a half compared to the year prior (4,314,025 vs. 3,814,177.29).
Sellers have dominated the battle since mid-July when they began a steep decline from their 52-week high, although 2 of the heaviest volume sessions in the past week & a half favored buyers.
JETS’s moving averages all are telling a foreboding message, with the 200 day moving average beginning to curl over bearishly & the 50 day moving average ready to make a death cross through it in the coming week.
The candlesticks of the past week & a half have been primarily bearish.
Last Monday the week kicked off with a spinning top signaling indecision among investors, followed by a gravestone doji on Tuesday which carries bearish implications.
Sure enough, Wednesday’s session was a gap down with a wide range & Thursday’s session opened higher than Wednesday’s, but it was barely able to break out above the prior day’s real body, tested the lows of it & ended up closing lower than it opened.
Friday resulted in another doji on higher than average volume within the past week & a half, but the mood was risk off as the close was narrowly lower than the open going into the weekend.
The decline continued on Monday, with the highest volume day of the past week & a half on a spinning top candlestick Tuesday.
Yesterday confirmed the indecision of the Tuesday when prices made a break upwards but were unable to match the resistance of the 10 DMA & the session closed out below the low of Tuesday.
Today appears to be following a similar track, as the price has declined & is sitting atop the lower Bollinger Band.
JETS’s Average True Range is moving away from its mean still, but after today’s session will take into account a larger price decline from the first week of September & we will likely see a brief consolidation range while indicators revert to their means before the decline continues.
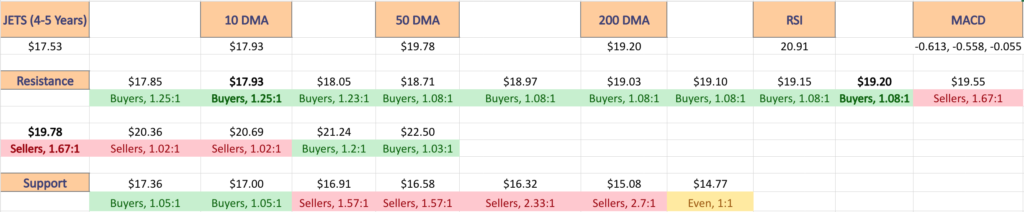
The bold prices on the image below denote the moving average levels just listed & the bold entries in the list form of the analysis under the images include other levels of support.
Each corresponding price level using a ratio of Buyers:Sellers (or Sellers:Buyers), NULL values denote that there was not enough data, so the ratio would’ve been 0:0.
Ratios with a 0 for the denominator/constant are denoted with an *, but are reported as is, as we are accounting for volume/sentiment.
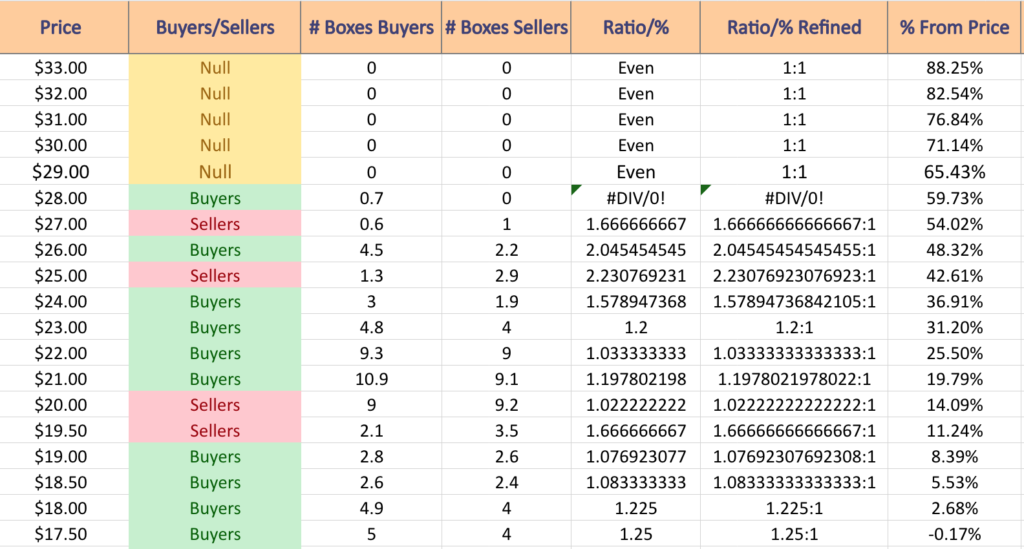
JETS, The U.S. Global Jets ETF’s Volume By Price Level Over The Past 4-5 Years
$33 – NULL – 0:0*; +88.25% From Current Price Level
$32 – NULL – 0:0*; +82.54% From Current Price Level
$31 – NULL – 0:0*; +76.84% From Current Price Level
$30 – NULL – 0:0*; +65.43% From Current Price Level
$29 – NULL – 0:0*; +65.43% From Current Price Level
$28 – Buyers – 0.7:0*; +59.73% From Current Price Level
$27 – Sellers – 1.67:1; +54.02% From Current Price Level
$26 – Buyers – 2.05:1; +48.32% From Current Price Level
$25 – Sellers – 2.23:1; +42.61% From Current Price Level
$24 – Buyers – 1.58:1; +36.91% From Current Price Level
$23 – Buyers – 1.2:1; +31.2% From Current Price Level
$22 – Buyers – 1.03:1; +25.5% From Current Price Level
$21 – Buyers – 1.2:1; +19.79% From Current Price Level
$20 – Sellers – 1.02:1; +14.09% From Current Price Level
$19.50 – Sellers – 1.67:1; +11.24% From Current Price Level – 50 Day Moving Average
$19 – Buyers – 1.08:1; +8.39% From Current Price Level – 200 Day Moving Average
$18.50 – Buyers – 1.08:1; +5.53% From Current Price Level
$18 – Buyers – 1.23:1; +2.68% From Current Price Level
$17.50 – Buyers – 1.25:1; -0.17% From Current Price Level – Current Price Level & 10 Day Moving Average
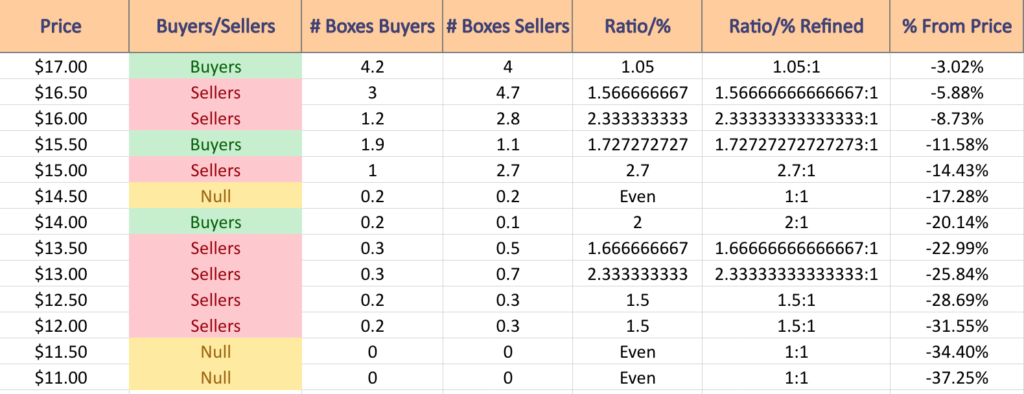
$17 – Buyers – 1.05:1; -3.02% From Current Price Level – Current Price Level
$16.50 – Sellers – 1.57:1; -5.88% From Current Price Level
$16 – Sellers – 2.33:1; -8.73% From Current Price Level
$15.50 – Buyers – 1.73:1; -11.58% From Current Price Level
$15 – Sellers – 2.7:1; -14.43% From Current Price Level
$14.50 – Even – 1:1; -17.28% From Current Price Level
$14 – Buyers – 2:1; -20.14% From Current Price Level
$13.50 – Sellers – 1.67:1; -22.99% From Current Price Level
$13 – Sellers – 2.33:1; -25.84% From Current Price Level
$12.50 – Sellers – 1.5:1; -28.69% From Current Price Level
$12 – Sellers – 1.5:1; -31.55% From Current Price Level
$11.50 – NULL – 0:0*; -34.4% From Current Price Level
$11 – NULL – 0:0*; -37.25% From Current Price Level
Tying It All Together
The list & image above paint the picture as to how investors & traders have behaved at various price levels that JETS has been at over the past four-to-five years.
It is not meant to serve as investment/trading advice, and is simply a way to visualize what investor/trader sentiment has been like at each of the price levels mentioned, as well as what it was at levels of support & resistance that are denoted in the image & list.
As always, do your own due diligence before making investing/trading decisions.
For more on the methodology on how the data was collected & put together, please refer to our original Price:Volume analysis.
*** I DO NOT OWN SHARES OR OPTIONS CONTRACT POSITIONS IN JETS AT THE TIME OF PUBLISHING THIS ARTICLE ***