SPY, the SPDR S&P 500 ETF declined -2.98% over the past week, in a week that saw lots of risk-off behavior among market participants.
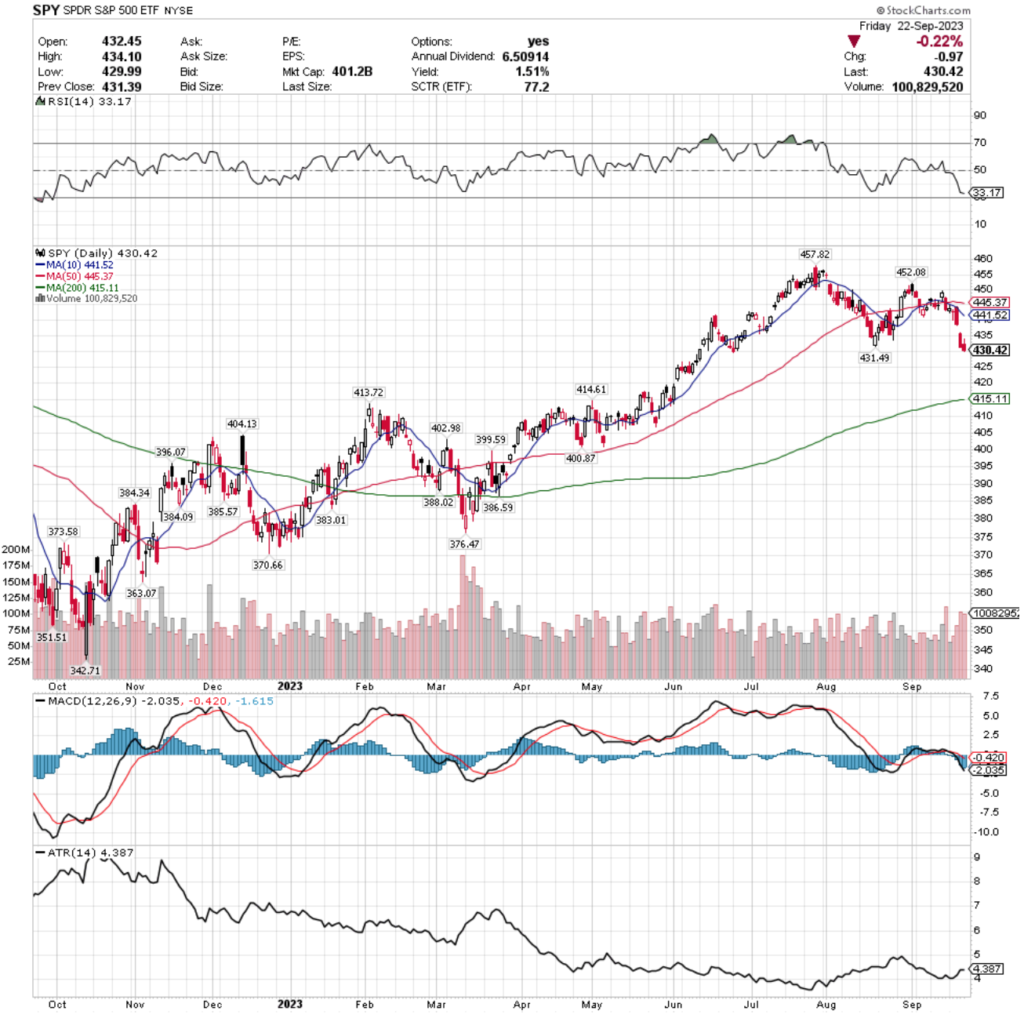
Their RSI is currently hovering above oversold territory at 33.17, but their MACD is in bearish freefall following last week’s declines.
Volumes were -6.23% below average compared to the year prior (78,641,179 vs. 83,867,006), which is mostly attributed to the first two sessions of the week.
Monday the week kicked off on a spinning top that couldn’t penetrate the resistance of the 10 & 50 day moving averages as the week kicked off on a note of uncertainty.
Tuesday resulted in a dragonfly doji & Wednesday opened higher at the 10 DMA’s resistance level, but was a day of declines for the S&P 500, closing lower than Tuesday’s candle’s lower shadow indicating that market participants were feeling more cautious & risk off.
Thursday this sentiment was confirmed as SPY gapped down with hardly much upper shadow on the day’s candlestick on the highest volume of the week, as investors were eager to hop out of the pool. following the Federal Reserve announcement & Chariman Powell’s Press Conference.
Friday the declines continued as market participants did not want to carry much risk into the weekend, which was confirmed by the day’s volume being just lower than that of Thursday’s.
SPY’s Average True Range indicates that there may be a period of consolidation in the coming week at these new recent lows, however this is hard to judge due to the limited support that they have at these price levels, having just broken below the major level that was holding up the price action of the previous month.
It will be all eyes on the 200 Day Moving Average moving forward as SPY looks to find some footing for support.
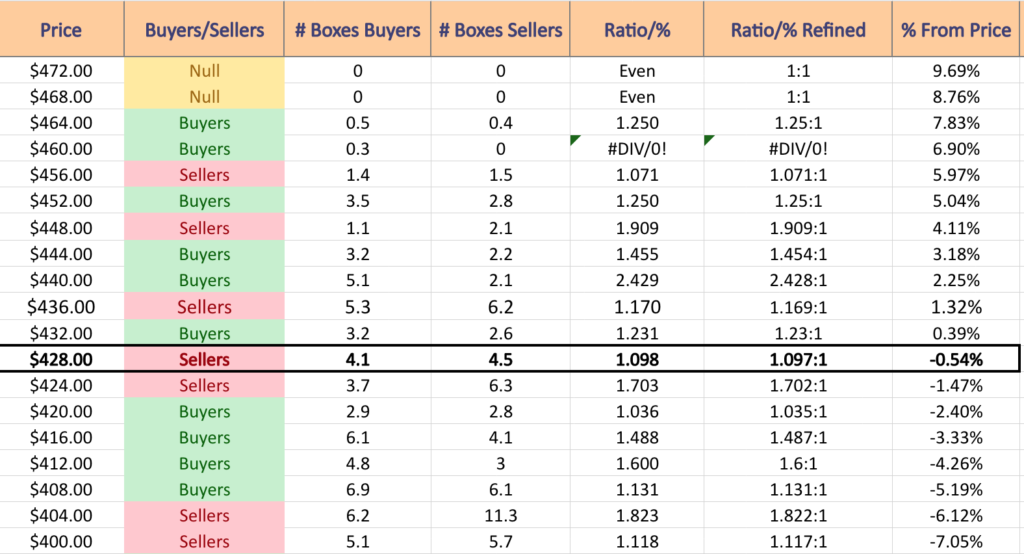
SPY has support at the $415.11 (200 Day Moving Average; Volume Sentiment: Buyers, 1.6:1), $414.61 (Volume Sentiment: Buyers, 1.6:1), $413.72 (Volume Sentiment: Buyers, 1.6:1) & $404.13/share (Volume Sentiment: Sellers, 1.82:1) price levels, with resistance at the $431.49 (Volume Sentiment: Sellers, 1.1:1), $441.52 (10 Day Moving Average; Volume Sentiment: Buyers, 2.43:1), $445.37 (50 Day Moving Average; Volume Sentiment: Buyers, 1.45:1) & $452.08/share (Volume Sentiment: Buyers, 1.25:1) price levels.
QQQ, the Invesco QQQ Trust ETF fell -3.44% over the past week, as the risk-off sentiment struck the tech-heavy NASDAQ index the hardest.
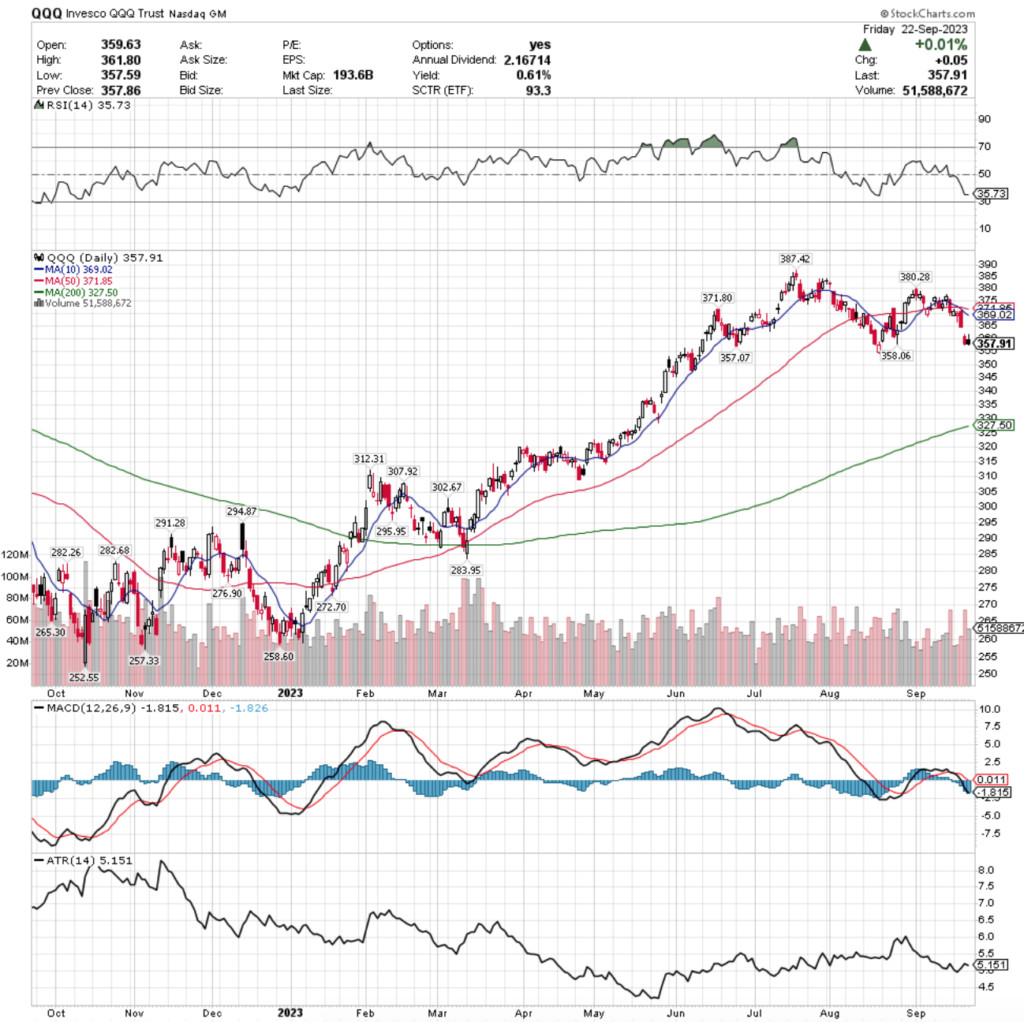
Their RSI is trending towards oversold at 35.73 & their MACD has been bearish for over the past week.
Volumes were -12.37% below average compared to the year prior (48,223,528 vs. 55,031,426), indicating some uncertainty among market participants, particularly on the bookend days of the week which happened to be the only advancing days (Monday had lowest volume of week, Friday had second highest).
Monday opened up the week on a cautious, but optimistic note as the session was green, but the volume was very light, which was confirmed Tuesday with a hanging man candlestick.
Wednesday opened just above the range of Tuesday’s shadow while testing the 10 DMA, but resulted in a large decline that engulfed Tuesday’s candle bearishly, setting the stage for Thursday.
Thursday’s gap down session was the strongest volume of the week as investors decided that QQQ could not break through the resistance of the 10 DMA the day prior.
Friday closed the week out on a rather ominous note, with a bullish session whose close was lower than its open & the shadows of the day’s range match the shadows of Thursday’s candle.
QQQ’s ATR may help to prop prices up in the next day or two, but after the first two days are removed from the calculation there is room to run lower while reverting back to the ATR’s mean, as then the furthest out inputs to the calculation would be within the most recent consolidation range or lower.
$357.07/share will be an area to watch as it is the last support level before the 200 DMA at $327.50 (-8.3% lower), which would expose QQQ to further, more violent declines in the near-term.
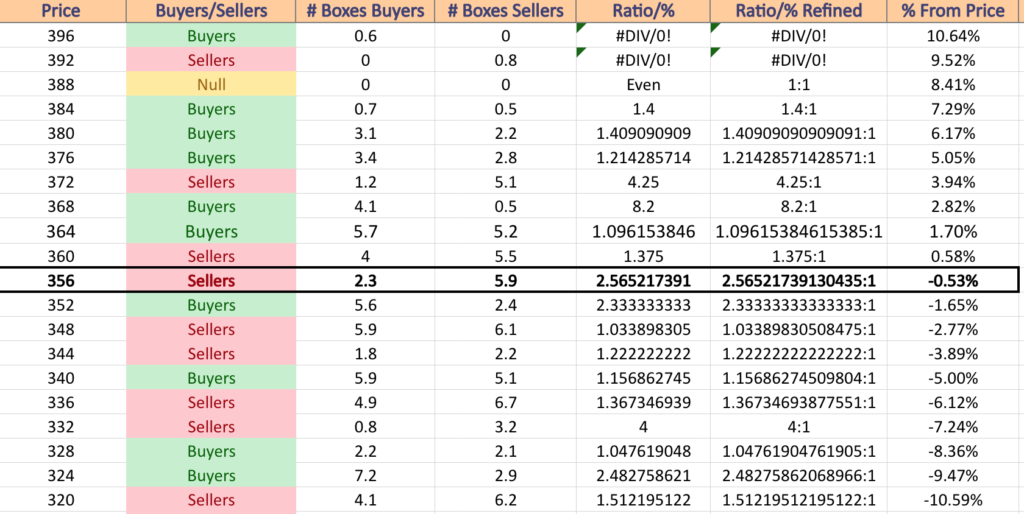
QQQ has support at the $357.07 (Volume Sentiment: Sellers, 2.57:1), $327.50 (Volume Sentiment: Buyers, 2.48:1), $312.31 (Volume Sentiment: Sellers, 2:1) & $307.92/share (Volume Sentiment: Buyers, 1.04:1) price levels, with resistance at the $358.06 (Volume Sentiment: Sellers, 2.57:1), $369.02 (10 Day Moving Average; Volume Sentiment: Buyers, 8.2:1), $371.80 (Volume Sentiment: Buyers, 8.2:1) & $371.85/share (50 Day Moving Average; Volume Sentiment: Buyers, 8.2:1) price levels.
IWM, the iShares Russell 2000 ETF dropped -3.14% over the past week, only faring worse than the tech-heavy NASDAQ.
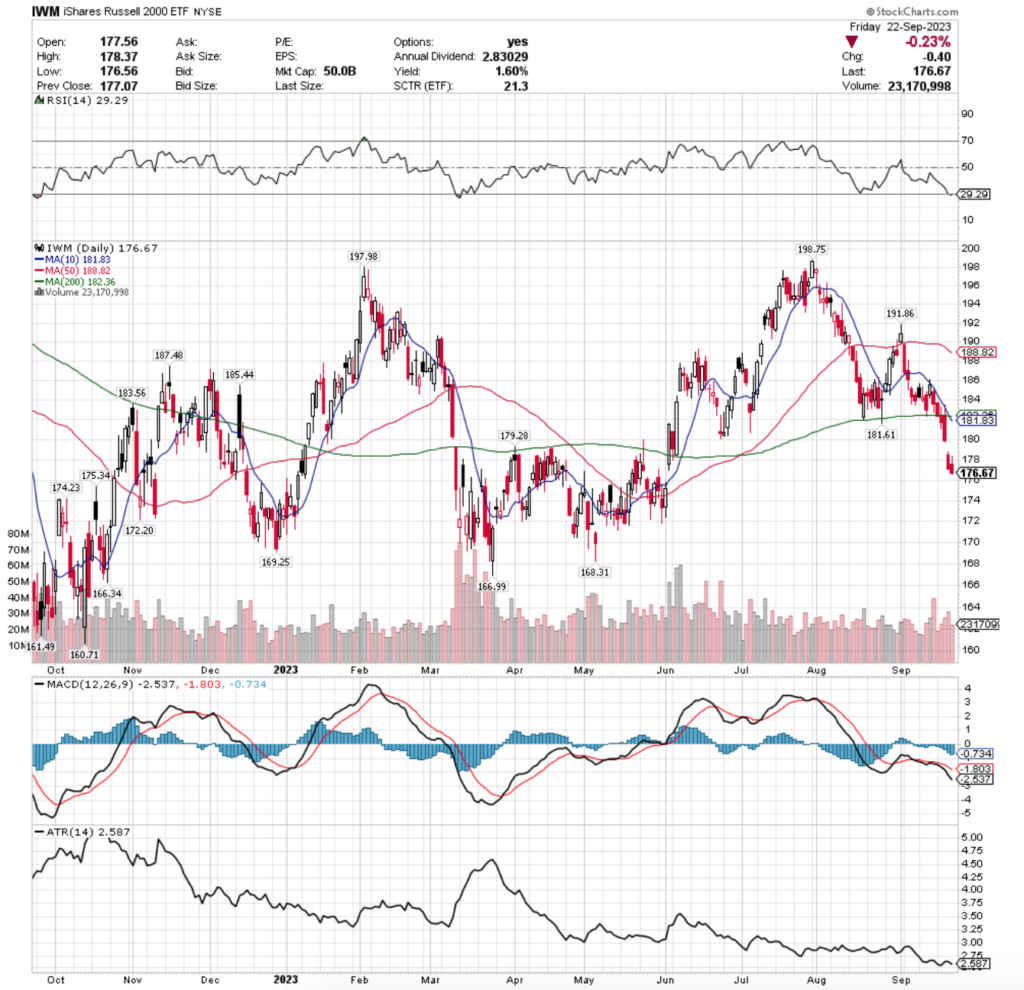
Their RSI dipping into oversold territory at 29.29, with their MACD continuing to be bearish throughout the better part of September.
Volumes were -10.39% below average compared to the year prior (25,139,418 vs. 28,054,233) in the week that was five consecutive sessions of declines, mostly due to Monday & Friday’s sessions being on weak volume.
Monday’s session barely broke down through the support of the 200 DMA, while Tuesday opened in line with it, only to attempt to reach the 10 DMA (upper shadow) & ultimately decline to close below the 200 DMA’s resistance & test lower price levels (lower shadow).
Wednesday again tried to test the 10 DMA’s resistance unsuccessfully, after opening at the 200 DMA & resulted in a close well below the moving average.
Thursday’s gap down following the Fed announcement & press conference was the strongest volume of the week (Wednesday’s volatile session was second strongest), with Friday showing more risk-off sentiment by market participants, as prices drifted lower after being unable to break above Thursday’s session’s open.
Much like QQQ’s ATR, IWM’s ATR is signaling that there is a chance of a 2-4 day consolidation at these levels before we resume the descent, but things still are looking prepared to move further to the downside.
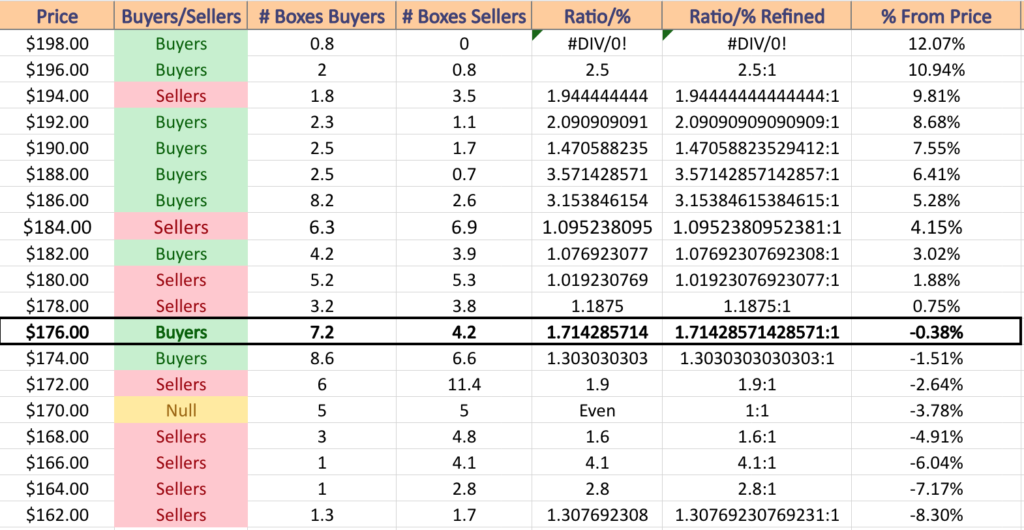
IWM has support at the $175.34 (Volume Sentiment: Buyers, 1.3:1), $174.23 (Volume Sentiment: Buyers, 1.3:1), $172.20 (Volume Sentiment: Sellers, 1.9:1) & $169.25/share (Volume Sentiment: Sellers, 1.6:1) price levels, with resistance at the $179.28 (Volume Sentiment: Sellers, 1.19:1), $181.61 (Volume Sentiment: Sellers, 1.02:1), $181.83 (10 Day Moving Average; Volume Sentiment: Sellers, 1.02:1) & $182.36/share (200 Day Moving Average; Volume Sentiment: Buyers, 1.08:1) price levels.
DIA, the SPDR Dow Jones Industrial Average ETF dipped -1.9% last week, as the larger cap names were able to better weather the storm following Wednesday’s announcement.
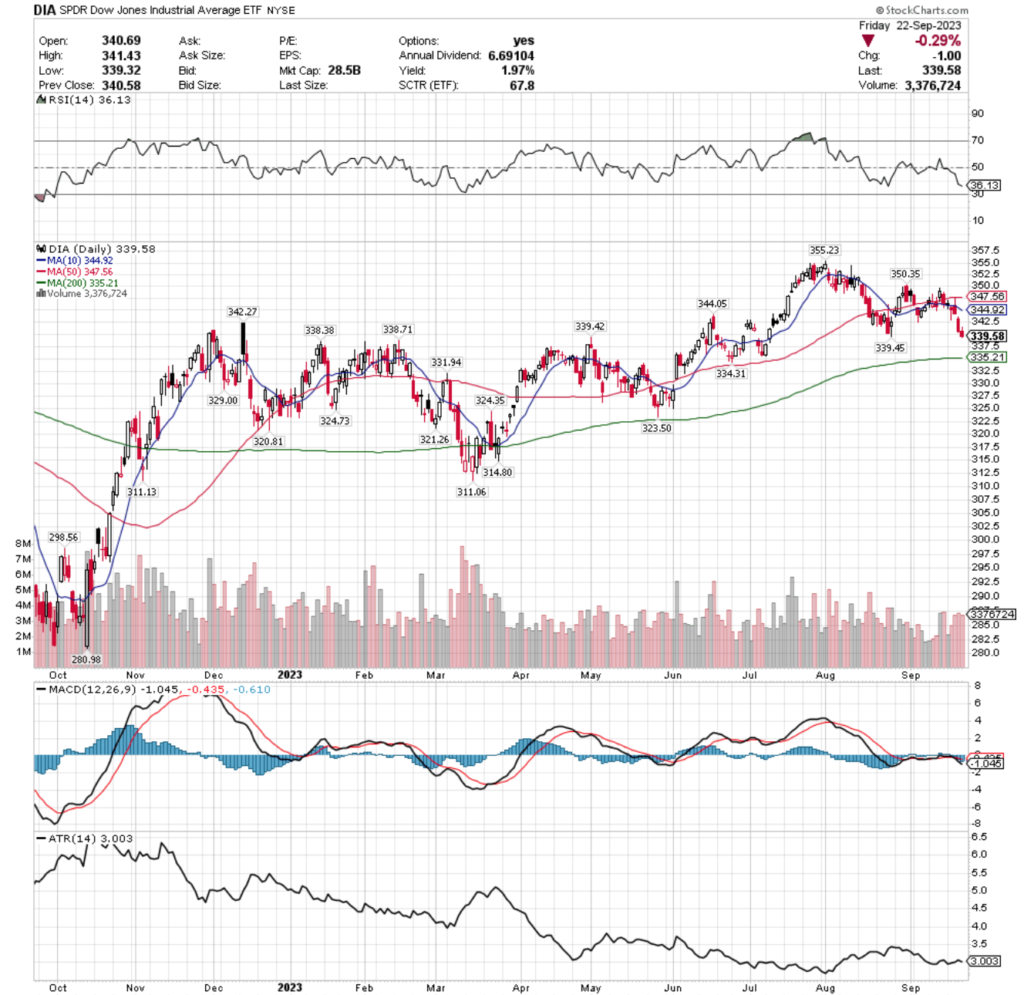
Their RSI is trending towards oversold at 36.13, with a MACD that’s been in bearish territory for the better part of the last two months.
Volumes declined -16.56% last week compared to the average for the year prior (3,018,586 vs. 3,617,642), mostly due to the first two days of the week, confirming that the weakness shown from Wednesday on is likely to continue in the near-term.
Monday resulted in a spinning top, signaling indecision as prices were just supported by the 10 day moving average & unable to test the 50 DMA.
Tuesday set the stage for declines with a hanging man candlestick that was held down by the resistance of the 10 DMA, followed by Wednesday’s attempt to test the 50 DMA after opening at the 10 day moving average, but resulting in a down day below the resistance of the 10 DMA.
Thursday resulted in a gap down & Friday’s session continued that sentiment as market participants are showing signs of being uneasy about the near-term environment.
DIA’s ATR is signaling that there may be some form of a cool off consolidation or at least a more “controlled burn” decline to come in the near-term as they look primed to test the support of the 200 DMA in the coming week.
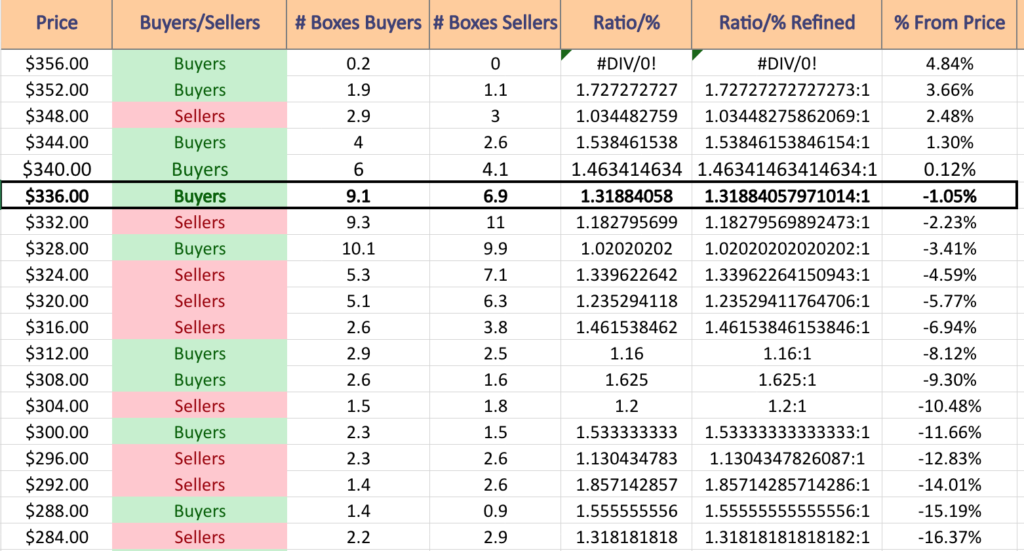
DIA has support at the $339.45 (Volume Sentiment: Buyers, 1.32:1), $339.42 (Volume Sentiment: Buyers, 1.32:1), $338.71 (Volume Sentiment: Buyers, 1.32:1) & $338.38/share (Volume Sentiment: Buyers, 1.32:1) price levels, with resistance at the $342.27 (Volume Sentiment: Buyers, 1.46:1), $344.05 (Volume Sentiment: Buyers, 1.54:1), $344.92 (10 Day Moving Average; Volume Sentiment: Buyers, 1.54:1) & $347.56/share (50 Day Moving Average; Volume Sentiment: Buyers, 1.54:1) price levels.
India Growth Leaders (GLIN), Emerging Markets Dividends (EDIV), Energy Momentum (PXI) & Insurance (KIE) Are All Bullishly Leading The Market
GLIN, the VanEck Vectors India Growth Leaders ETF has advanced +19.59% over the past year, including climbing +26.51% since their 52-week low in March of 2023 (ex-distributions).
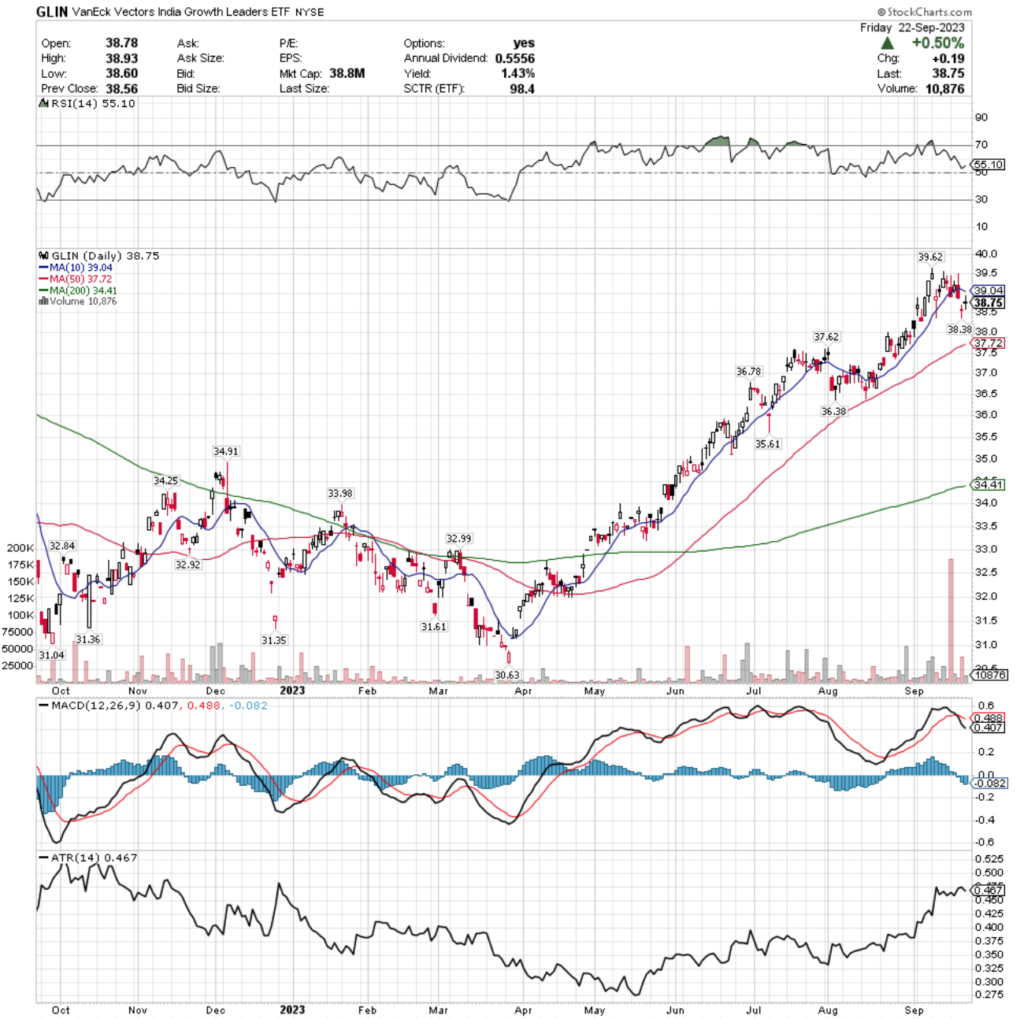
Their RSI is just above neutral at 55.1, with a MACD that is in bearish decline following profit taking from their recent 52-week high.
Volumes were +66.66% above average last week compared to the year prior (17,344 vs. 10,406.68), with the highest volume days occurring on Monday & Thursday, both of which were declining days where investors were collecting their profits from the run up that’s taken place over the past 6 months.
Monday’s session opened above the 10 day moving average, but was unable to find support at it despite moving higher to approach the $39.50-mark during the session & the selling pressure pushed the price below the 10 DMA.
Tuesday’s session was able to break out slightly above the 10 DMA’s resistance, but Wednesday saw the share price tumble back beneath the 10 DMA’s resistance.
The open:close price action for Wednesday & Monday’s declines were all concentrated in the lower half of the candlestick, which signals investor sentiment is to the downside.
Thursday’s session resulted in a gap down spinning top candlestick, indicating that investors are feeling bearish, but unsure about where to value GLIN’s price with the open & close being very close to one another (but too spread out to be a doji).
Friday the week ended on another narrow spinning top candlestick, as investors were willing to take a slight bit of risk, but the mood still looks bearish at worst & uncertain at best for the near-term.
GLIN offers a 1.43% distribution yield for long-term holders of their shares, which is not much protection against moves to the downside, which means it would be wise for investors to take some profits & or use a hedging strategy with options such as selling calls or buying puts for the near-term.
Their Average True Range (ATR) indicates that there may be a new consolidation range built around the range of Thursday & Friday’s candlesticks, but investors should keep their eyes peeled on the 50 day moving average & how prices begin to behave around it.
If it serves as adequate support the consolidation range sounds likely, however if it fails to hold up which the price:volume sentiment indicates is a strong possibility there will be further declines from the 52-week high.
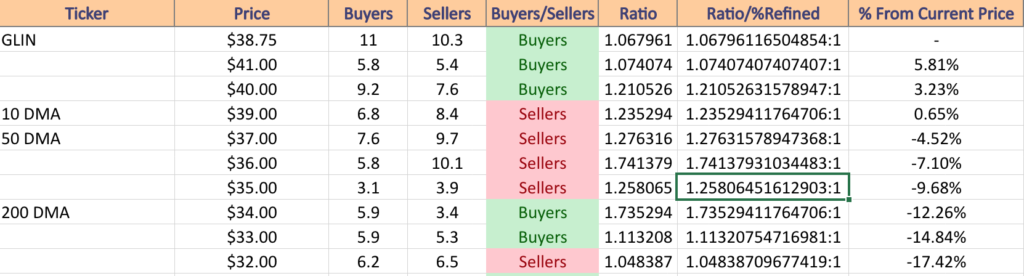
GLIN has support at the $38.38 (Volume Sentiment: Buyers, 1.07:1), $37.72 (50 Day Moving Average; Volume Sentiment: Sellers, 1.28:1), $37.62 (Volume Sentiment: Sellers, 1.28:1) & $36.78/share (Volume Sentiment: Sellers, 1.74:1) price levels, with resistance at the $39.04 (10 Day Moving Average; Volume Sentiment: Sellers, 1.24) & $39.62 /share (Volume Sentiment: Sellers, 1.24) price levels.
EDIV, the SPDR S&P Emerging Markets Dividend ETF has gained +36.29% over the past year, adding +39.78% from their 52-week low in November of 2022 (ex-distributions).
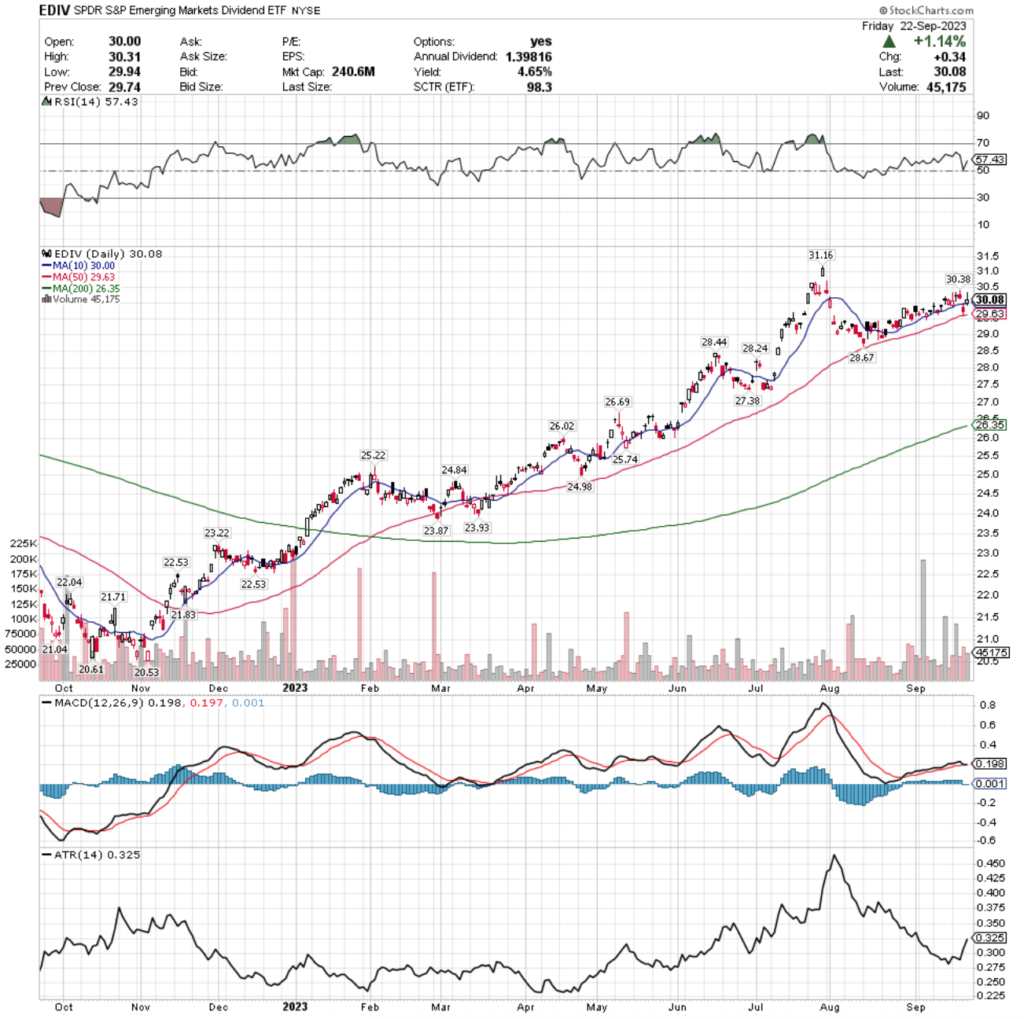
Their RSI is sitting on the overbought end of neutral at 57.43 & their MACD looks primed to crossover bearishly in the coming week as it is barely hovering in a bullish position.
Volumes last week skyrocketed +71.01% above average compared to the year prior (58,068.75 vs. 33,956.08) led by Tuesday’s bullish session & Thursday’s bearish session.
Tuesday’s volume spike seems to be more of a last resort pump to try to keep the price above the 10 day moving average & not a signal of strength, which is confirmed by their dragonfly doji & the rest of the week’s performance.
Monday the week kicked off with a shooting star candlestick that opened around the 10 DMA & closed slightly higher than the open, but it was still a seller dominated session that resulted in a decline with the indecision indicated by the day’s candlestick being echoed into the week.
Tuesday’s dragonfly doji candle continued the message of uncertainty, but was able to stay above the support of the 10 DMA, but Wednesday’s shooting star candlestick paved the way for the decline below the 10 DMA that occurred on Thursday.
Thursday’s gap down session was supported near-perfectly by the 50 DMA, with the 10 DMA providing resistance for the upper shadow of the candle.
Friday resulted in a bullish session, but the shooting star spinning top candlestick implies that there is still great uncertainty about EDIV’s valuation & signals to expect further near-term declines, particularly if the week opens below the 10 DMA, at which point attention will shift to how strong the 50 DMA can hold up (buyer dominated price zone, but sitting atop 2 seller dominated zones in the chart below).
EDIV offers a 4.65% distribution yield for long-term holders, which does provide some cushion against losses, but it would be wise to explore options for hedging against more near-term declines as they cool off from their 52-week high.
Their ATR is indicating that there will likely be a dip below the 50 DMA in either a consolidation range & or a steeper decline in the coming weeks, which is important as after that price level the nearest support is ~3.2% lower.
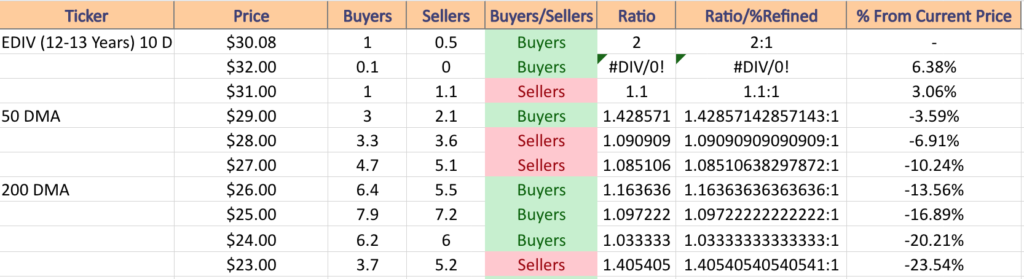
EDIV has support at the $30 (10 Day Moving Average; Volume Sentiment: Buyers, 2:1), $29.63 (50 Day Moving Average; Volume Sentiment: Buyers, 1.43:1), $28.67 (Volume Sentiment: Sellers, 1.09:1) & $28.44/share (Volume Sentiment: Sellers, 1.09:1) price levels, with resistance at the $30.38 (Volume Sentiment: Buyers, 2:1) & $31.16/share (Volume Sentiment: Sellers, 1.1:1) price levels.
PXI, the Invesco DWA Energy Momentum ETF has improved +24.68% over the past year, including a +26.85% climb from their 52-week low in May of 2023 (ex-distributions).
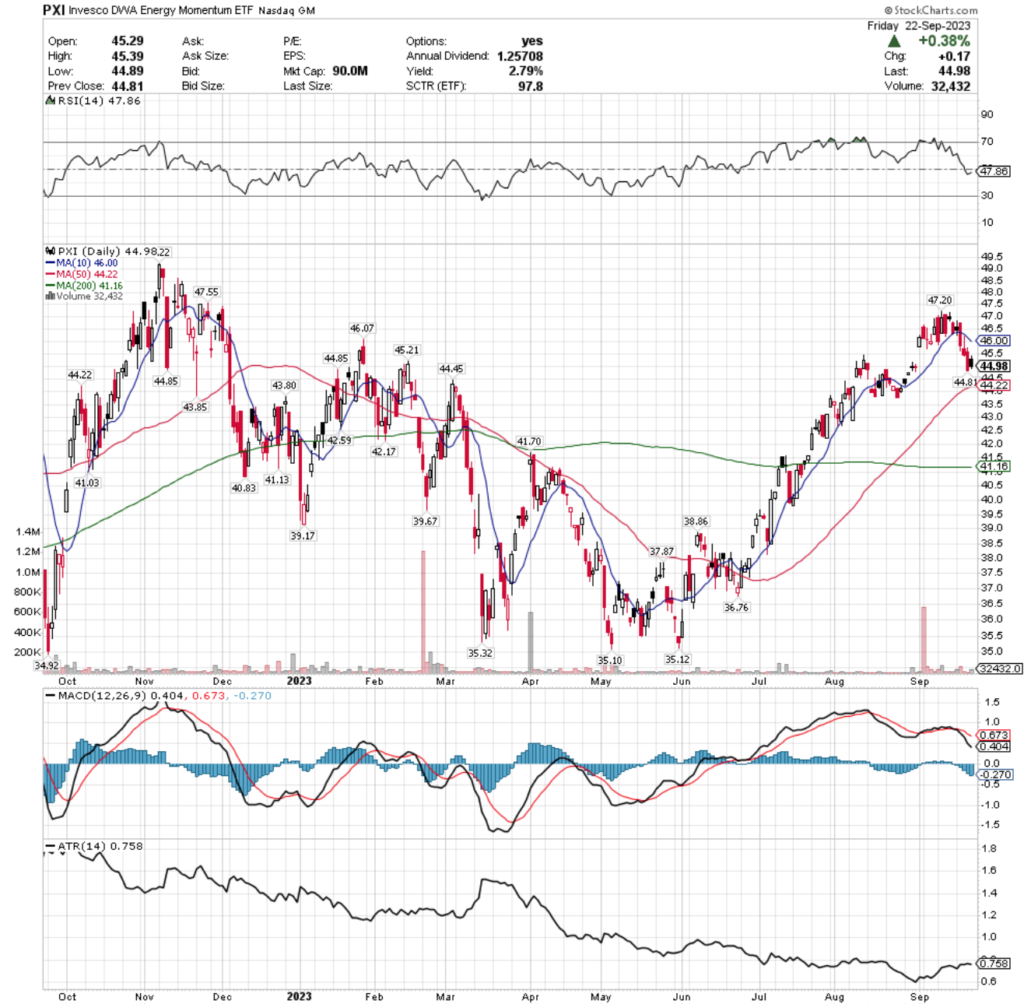
Their RSI is just below the neutral 50-mark at 47.86, with their MACD being bearish after the declines from the high of early September as investors began to take profits following the 3-4 month run up.
Volumes tumbled -25.28% below average last week compared to the year prior (29,008 vs. 38,820) in a sign that there is not much confidence in the market & investors are unsure as to where they value PXI shares.
Monday’s session kicked off with a spinning top candlestick that was able to be supported by the 10 day moving average before Tuesday opened with a sign of optimism near the top of Monday’s candle’s upper shadow.
The mood soured as they broke through the support of the 10 day moving average in a session that covered a wide range of prices.
Wednesday’s candle attempted to test the 10 DMA but was unable to, with the day’s open & closing prices being concentrated on the lower end of the candlestick & a small shadow below it indicating that investors were eying further declines.
Thursday the declines continued over a rather wide range of prices & Friday’s candlestick formed a harami with Thursday’s.
While Friday’s session opened above the close of Thursday’s, the close was below the open for the day, indicating further weak sentiment among market participants as the 10 DMA was moved further away from & became more bearish.
The 50 DMA will be an area to watch in the coming week, as it has begun to curl over & signal a bearish sentiment in the coming days, particularly if the resistance of the 10 DMA continues pushing pressure down on PXI’s share price.
While they offer a 2.79% distribution yield for long-term holders, a hedging strategy would be advised in the near-term while waiting to see how their support levels hold upas a means of protection.
Their ATR implies that there may be a consolidation range forming in the near-term, however if the support of the 50 DMA is unable to hold up (particularly over the next 4-8 sessions) there is room to dive further down.
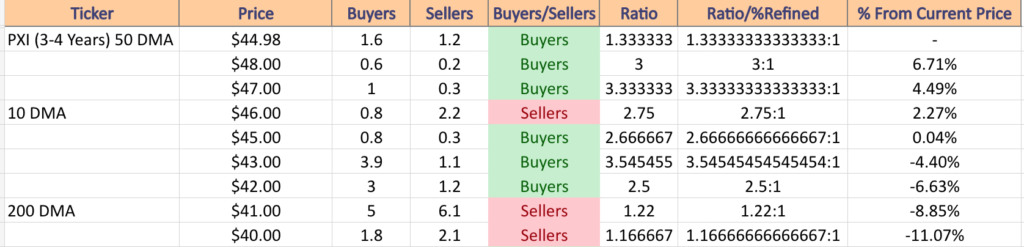
PXI has support at the $44.85 (2 Touch-Points In Last 52-Weeks; Volume Sentiment: Buyers, 1.33:1), $44.81 (Volume Sentiment: Buyers, 1.33:1), $44.45 (Volume Sentiment: Buyers, 1.33:1) & $44.22/share (50 Day Moving Average, 2 Touch-Points In Past 52-Weeks; Volume Sentiment: Buyers, 1.33:1) price levels, with resistance at the $45.21 (Volume Sentiment: Buyers, 2.67:1), $46 (10 Day Moving Average; Volume Sentiment: Sellers, 2.75:1), $46.07 (Volume Sentiment: Sellers, 2.75:1) & $47.20/share (Volume Sentiment: Buyers, 3.33:1) price levels.
KIE, the SPDR S&P Insurance ETF has gained +21.61% over the past year, adding +22.56% from their 52-week low in September of 2022 (ex-distributions).
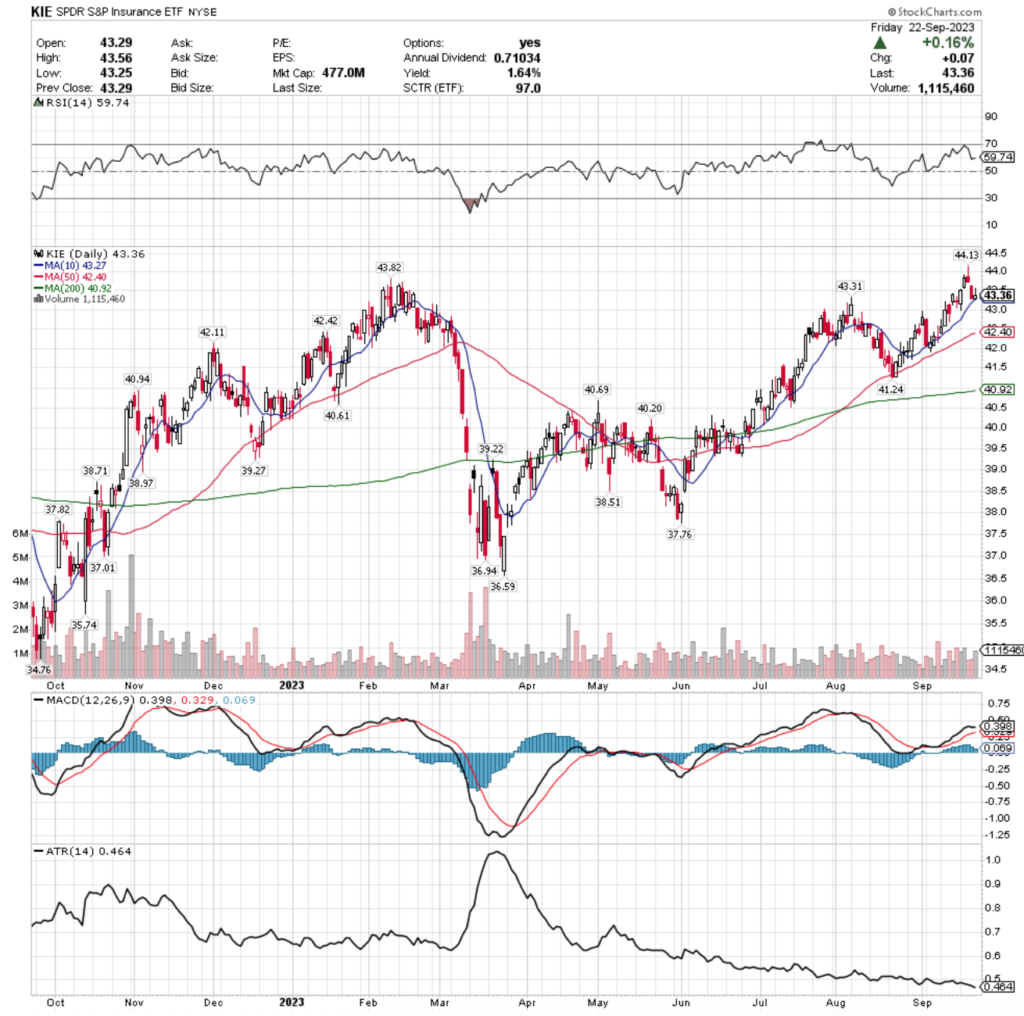
Their RSI is on the overbought end of neutral at 59.74, while their MACD is still bullish but beginning to signal a bearish crossover is to come in the next few days.
Volumes dipped -6.99% below average last week compared to the year prior (959,227.5 vs. 1,031,362.59), an indication of lackluster enthusiasm by investors, even as they hit a fresh 52-week high on Wednesday.
Monday kicked the week off on a bullish note following Friday’s bearish doji, although the lower shadow did dip lower than the lower shadow of Friday’s candle.
Tuesday the climb continued with a small gap up & investors were interested in seeing KIE reach new highs as the upper shadow went up to $43.92/share, but the close of the day was lower at $43.83.
Tuesday led the week in volume.
Wednesday opened lower & a shooting star candle was formed as the new 52-week high was hit, but the day’s close was much lower & narrowly above the close of Tuesday’s session.
The weak volume on Wednesday compared to Tuesday (~66%) also confirmed the bearish sentiment behind the shooting star candle, as despite hitting the new high there was very limited enthusiasm among market participants.
Thursday featured low volume (similar to Wednesday) profit taking by those who hadn’t done so the day prior, which led to the decline into Friday, where an inverted hammer candlestick was able to be supported by the 10 day moving average.
As we’ve see with the other names so far in this weekend’s bullish section, there will likely be a retest or two of this support in the coming days, with a support zone falling in the $43.27-31 range.
Their ATR is indicating that a reversion to its mean would require further declines in the coming sessions, which sets the stage for the bearish head & shoulders pattern that has been emerging on their chart since August & will be something to keep a close eye on in the next few weeks.
KIE offers a 1.64% distribution yield to long-term holders of the security, which is limited protection against losses, making it important to explore hedging options & taking some profits while waiting to see how this support zone holds up.
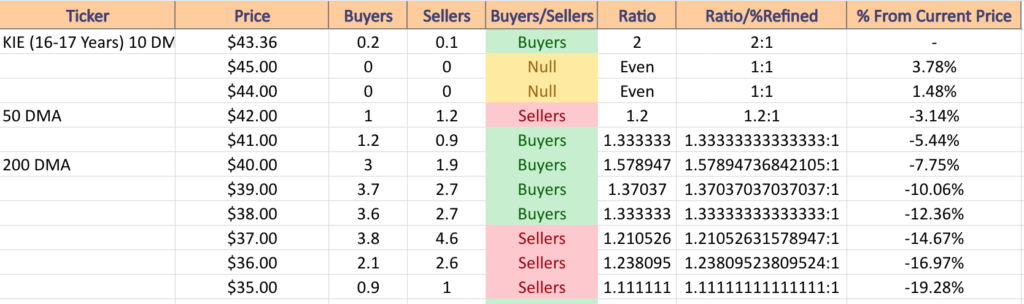
KIE has support at the $43.31 (Volume Sentiment: Buyers, 2:1), $43.27 (10 Day Moving Average; Volume Sentiment: Buyers, 2:1), $42.42 (Volume Sentiment: Sellers, 1.2:1) & $42.40/share (50 Day Moving Average; Volume Sentiment: Sellers, 1.2:1) price levels, with resistance at the $43.82 (Volume Sentiment: Buyers, 2:1) & $44.13/share (52-Week High; Volume Sentiment: NULL, 0:0*) price levels.
Retail (RETL), 7-10 Year Treasuries (TYD), Industrials (DUSL) & Global Wind Energy (FAN) Are All Bearishly Lagging The Market
RETL, the Direxion Daily Retail Bull 3x Shares ETF has fallen -18.78% over the past year, dropping -58.3% from their 52-week high in February of 2023, but reclaiming +11.79% from their 52-week low in June of 2023 (ex-distributions).
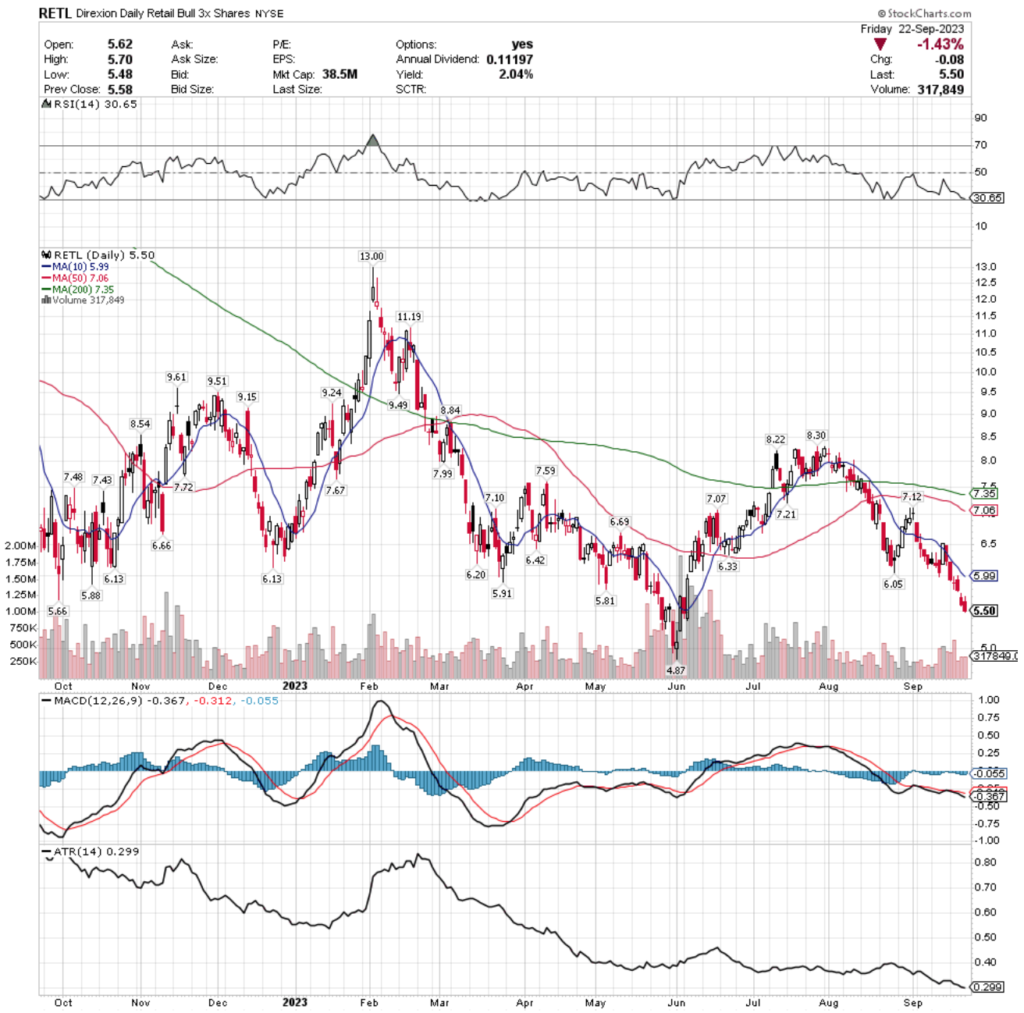
Their RSI is floating just above the oversold level of 30 at 30.65, while their MACD has been bearish since the beginning of the month of September.
Volumes dropped -22.01% below average last week compared to the year prior (368,925 vs. 473,029) as a sign of uncertainty amid a week of five consecutive declining sessions.
Monday kicked off with a declining session that opened just below Friday’s close & began sliding down immediately, as there is no upper shadow on the day’s candlestick.
Monday dipped below the support of the 10 DMA & investors favored the downside as indicated by the lower shadow on the day’s candle.
Tuesday provided the most clues about investor sentiment, as it was the highest volume day of the week & resulted in a doji whose upper shadow barely broke above the day prior’s close, signaling a lot of price movement in a narrow range (compared to the prior 4 sessions) that ultimately resulted in a narrow close & open as investors sit in uncertainty
Wednesday prices tried to make a run for the 10 DMA’s resistance level, but were cut short around the $6 mark & the day closed out below the low of Tuesday’s session.
Thursday & Friday the declines continued to the $5.50 mark, with only the 52-week low $4.87/share remaining as support for RETL from the past year’s prices.
While they offer a 2.04% distribution yield for long-term holders that can provide some cushion, this looks like there may be more declines on the horizon for RETL.
Their ATR is signaling that we may see a brief consolidation range over the next 4-6 days as higher priced sessions are dropped from the calculation in favor of lower prices ones, before seeing declines continue.
This will be especially true if the 10 DMA comes closer to the price but serves as solid resistance over it.
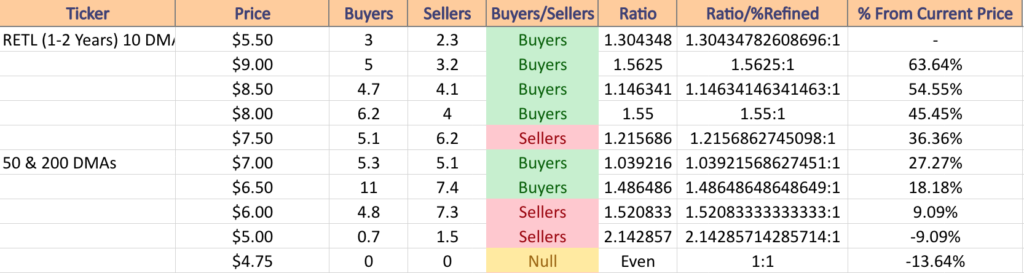
RETL has support at the $4.87/share (52-Week Low; Volume Sentiment: NULL, 0:0*) price level, with resistance at the $5.66 (Volume Sentiment: Buyers, 1.3:1), $5.81 (Volume Sentiment: Buyers, 1.3:1), $5.88 (Volume Sentiment: Buyers, 1.3:1) & $5.91/share (Volume Sentiment: Buyers, 1.3:1) price levels.
TYD, the Direxion Daily 7-10 Year Treasury Bull 3x Shares ETF has declined -17.22% over the past year, losing -25.45% since their 52-week high in April of 2023, while regaining +1.35% from their 52-week low in September of 2023 (ex-distributions).
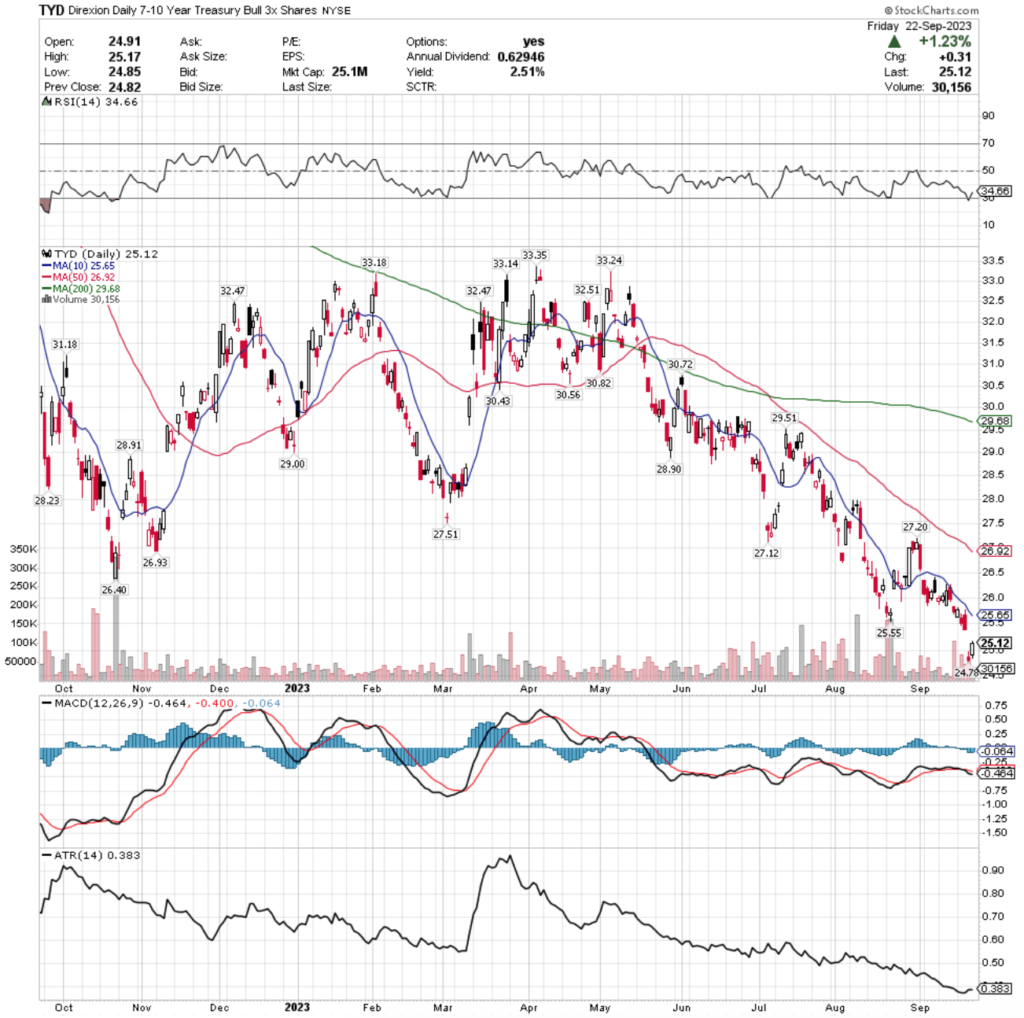
Their RSI is rebounding back from oversold territory but currently sits at 34.66, while their MACD has been bearish for the last week or two.
Volumes were +23.54% higher than average last week compared to the year prior (50,213 vs. 40,646), which sends an interesting signal as they were highest on the three declining days, signaling some profit taking on Tuesday following Monday’s advancing session & the second highest volume day was Thursday’s gap down session.
Volumes are indicating that market participants are still viewing TYD bearishly & signaling that there may be a retest of the current only support level & 52-week low at $24.78.
Monday saw a day that resulted narrowly to the upside over Friday’s session’s close that was unable to break Friday’s opening price (indicated by upper shadow).
Tuesday investors were eager to pull their money out after Monday’s gains, resulting in the strongest day by volume of the week.
Wednesday was a bearish engulfing candle, that while it attempted to challenge the 10 DMA’s resistance level fell well short of it & resulted in a further decline atop Tuesday’s lowest price level & set the stage for Thursday’s gap down session.
Friday attempted to claw back some gains after that new 52-week low set Thursday & may lead into a brief consolidation range while the oscillators & indicators revert back to their means.
They offer a 2.51% distribution yield for long-term holders of the security, but with such limited upside signals currently this looks like a good opportunity to watch how it behaves near its lowest level of the past year & how it handles the downside pressure of the 10 & 50 DMAs acting as resistance.
There are 8 days in the calculation period for their ATR that occur before last Friday’s gap down, after which the price range will be lower for the last 14 days & the declines should be expected to continue after a brief pause.
Should they manage to float rangebound all of this week, things will become more interesting as four sessions later the price action before Thursday’s gap down is all removed from the calculation, enabling a more steep descent.
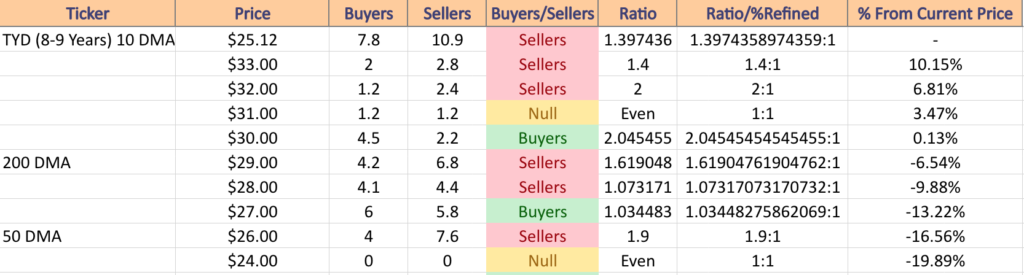
TYD has support at the $24.78/share (52-Week Low; Volume Sentiment: NULL, 0:0*) price level, with resistance at the $25.55 (Volume Sentiment: Sellers, 1.4:1), $25.65 (10 Day Moving Average; Volume Sentiment: Sellers, 1.4:1), $26.40 (Volume Sentiment: Sellers, 1.9:1) & $26.92/share (50 Day Moving Average; Volume Sentiment: Seller, 1.9:1) price levels.
DUSL, the Direxion Daily Industrials Bull 3x Shares has gained +48.82% over the past year, while falling -24.45% since their 52-week high in August of 2023, but has managed to regain +59.64% from their 52-week low in October of 2022 (ex-distributions).
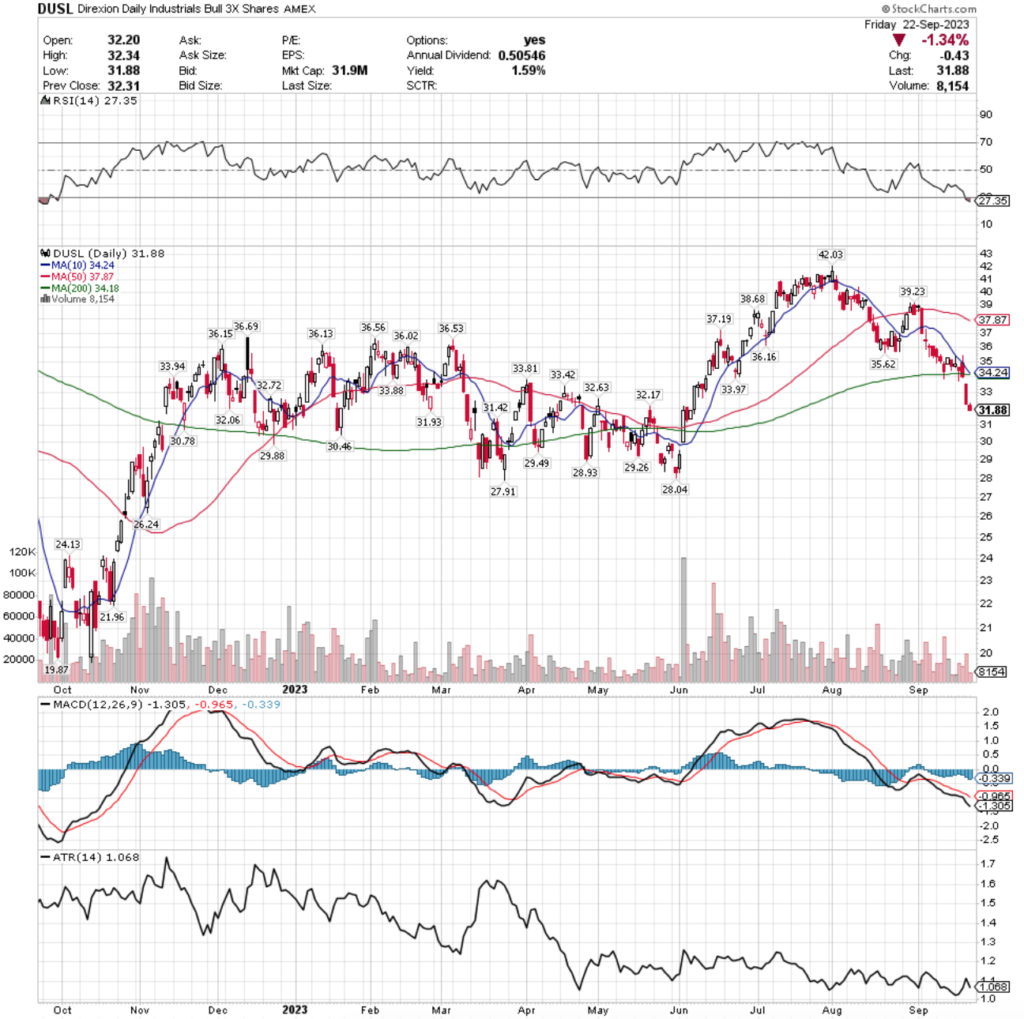
Their RSI is in oversold territory at 27.35 & their MACD has been bearish since the beginning of September.
Volumes dropped -37.25% below average last week compared to the year prior (16,213.25 vs. 25,838.86) as investors were unsure if their 200 day moving average would be able to hold up as support.
A telling signal is that Thursday’s gap down session that confirmed that the 10 & 200 DMAs are now resistance was the highest volume session of the week, as investors are lacking confidence in DUSL.
Monday’s spinning top’s open & closing prices were concentrated around the bottom of the candle, while the 10 DMA served as strong resistance against the price action.
Tuesday resulted in a hammer candlestick that was supported by the 200 DMA, but did test its support throughout the day as the shadow shows it did briefly dip below it before it closed above it.
Wednesday was the day of judgement, where prices opened at the 10 DMA, briefly tried to break above it as indicated by the upper shadow, but were forced back downward, to close below the support of the 200 DMA & to even test lower than the day’s close as indicated by the lower shadow.
Thursday investors decided in droves that they were not confident in DUSL’s current price & Friday the declines continued lower, with a brief attempt to trade above Thursday’s close (upper shadow).
DUSL pays a 1.59% distribution yield to long-term shareholders, which is not much in terms of protection against losses.
While their Average True Range is moving away from the mean throughout all of these declines, over the next 2-7 days the high level of the range will be removed from the calculation, enabling a further decline which may be triggered sooner as we see the 10 DMA is bearishly crossing through the 200 DMA on Monday.
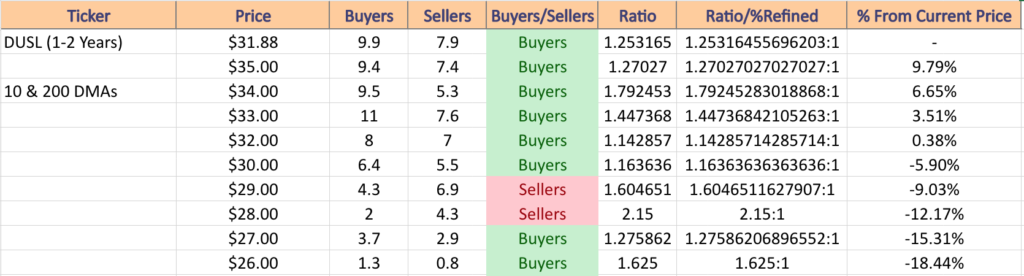
DUSL has support at the $31.42 (Volume Sentiment: Buyers, 1.25:1), $30.78 (Volume Sentiment: Buyers, 1.16:1), $30.46 (Volume Sentiment: Buyers, 1.16:1) & $29.88/share (Volume Sentiment: Sellers, 1.61:1) price levels, with resistance at the $31.93 (Volume Sentiment: Buyers, 1.25:1), $32.06 (Volume Sentiment: Buyers, 1.14:1), $32.17 (Volume Sentiment: Buyers, 1.14:1) & $32.63/share (Volume Sentiment: Buyers, 1.14:1) price levels.
FAN, the First Trust ISE Global Wind Energy Index Fund ETF has lost -4.92% over the past year, falling -20.19% from their 52-week high in January of 2023, but has recovered +5.34% since their 52-week low in October of 2022 (ex-distributions).
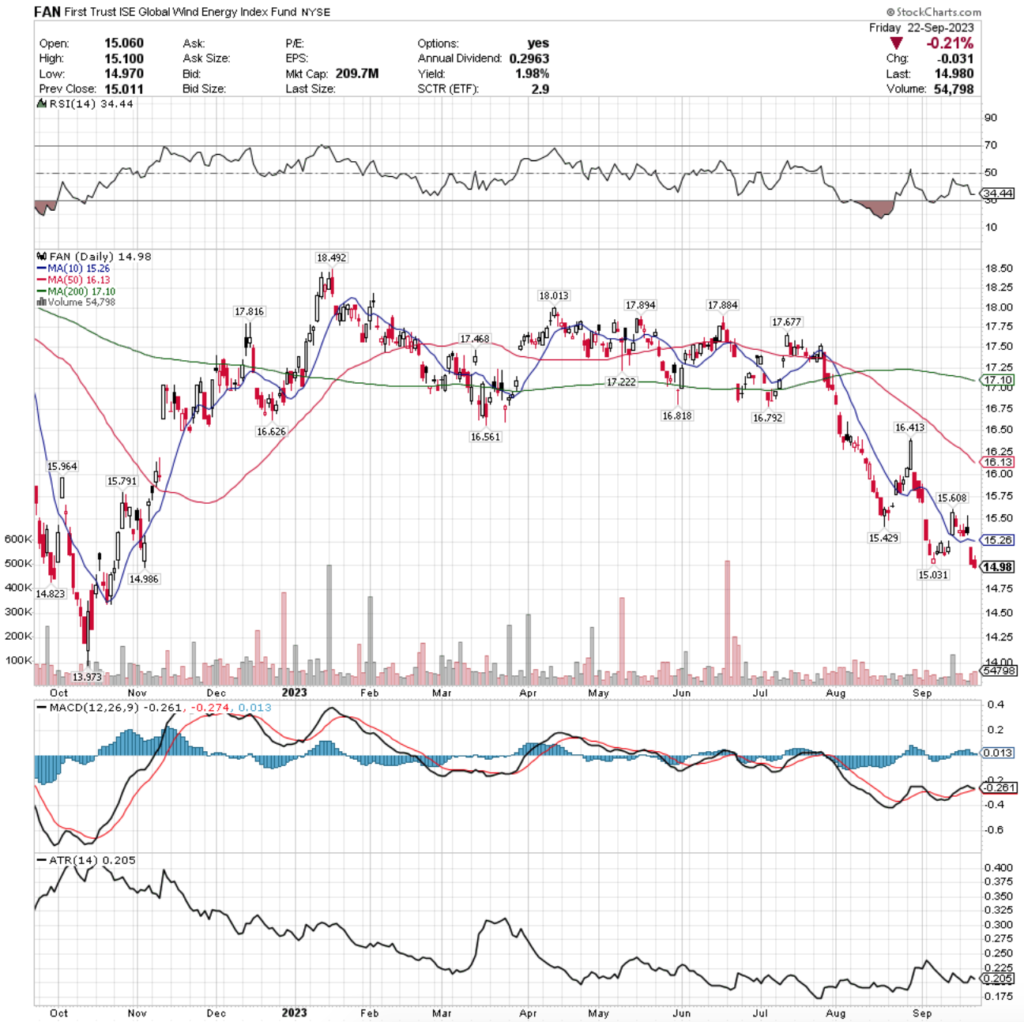
Their RSI is trending toward oversold territory at 34.44, as their MACD hovers barely bullish & looks set for a bearish crossover in the next day or two’s sessions.
Volumes were -49.98% below average last week compared to the year prior (34,049.5 vs. 68,075.29) as investors sat unsure watching to see how close to their 52-week low they might test.
Monday kicked off with bearish gap down spinning top, setting the stage for further declines that were provided on Tuesday.
Wednesday saw a break to the upside & an attempt to close above the $15.50 mark that did not hold up & the day’s session closed just below the open of Tuesday’s.
Thursday the 10 DMA’s support was blown right through on a gap down & investors signaled they wanted to see FAN priced lower as Friday closed lower than Thursday & featured a lower shadow to the candlestick as well, indicating there is still more bearish sentiment regarding FAN.
With only 1.98% cushion in distribution yield it would be wise to watch how this behaves as it approaches its 52-week low again before entering into any position.
Their ATR is trending away from the mean, however on Wednesday two of the 7 sessions that are above the range of the current price level will be removed from the calculation, meaning we may see some form of an attempt at consolidation in the near-term before the declines are set to continue.
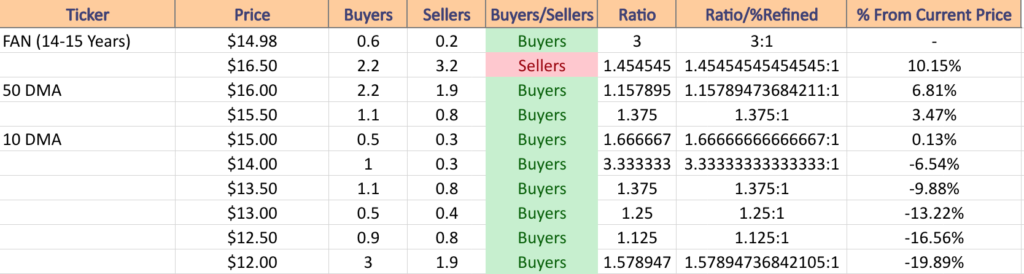
FAN has support at the $ 14.82(Volume Sentiment: Buyers, 3:1) & $13.97/share (Volume Sentiment: Buyers, 1.38:1) price levels, with resistance at the $14.99 (Volume Sentiment: Buyers, 3:1), $15.03 (Volume Sentiment: Buyers, 1.67:1), $15.26 (10 Day Moving Average; Volume Sentiment: Buyers, 1.67:1) & $15.43 /share (Volume Sentiment: Buyers, 1.67:1) price levels.
The Week Ahead
The week kicks off Monday with no major data announcements & Thor Industries scheduled to report earnings.
Tuesday New Homes Sales are announced at 8:30 am, the S&P Case-Shiller Home Price Index (20 Cities) data is reported at 9 am, followed by Consumer Confidence at 10 am & Fed Governor Bowman speaking at 1:30 pm.
Costco Wholesale, AAR Corp., Cintas, Ferguson, MillerKnoll, TD Synnex, Progress Software & United Natural Foods are all scheduled to report earnings data on Tuesday.
Wednesday features Durable-Goods Orders & Durable-Goods Minus Transportation data at 8:30 am.
Micron Technologies, Concentrix, H.B. Fuller, Jefferies, Paychex & Worthington are all due to report earnings on Wednesday.
Initial Jobless Claims & GDP (revision) data are scheduled for 8:30 am Thursday, followed by Fed Governor Cook speaking at 1 pm & Fed Chairman Powell speaking at 4pm (conveniently right after the close).
Thursday’s earnings reports include Nike, Accenture, BlackBerry, CarMax, Jabil & Vail Resorts.
Friday morning winds the week down with Personal Income, Personal Spending, PCE Index, Core PCE Index, PCE (Year-over-Year), Core PCE (Year-over-Year), Advanced U.S. Trade Balance In Goods, Advanced Retail Inventories & Advanced Wholesale Inventories data at 8:30 am, followed by the Chicago Business Barometer at 9:45 am & at 10 the week wraps up with Consumer Sentiment (final) data.
Carnival is scheduled to report earnings on Friday.
See you back here next week!
*** I DO NOT OWN SHARES OR OPTIONS CONTRACT POSITIONS IN SPY, QQQ, IWM, DIA, GLIN, EDIV, PXI, KIE, RETL, TYD, DUSL or FAN AT THE TIME OF PUBLISHING THIS ARTICLE ***