SPY, the SPDR S&P 500 ETF advanced +0.46% over the past week, trailing only the Dow Jones Industrial Average in terms of weekly performance by an index.
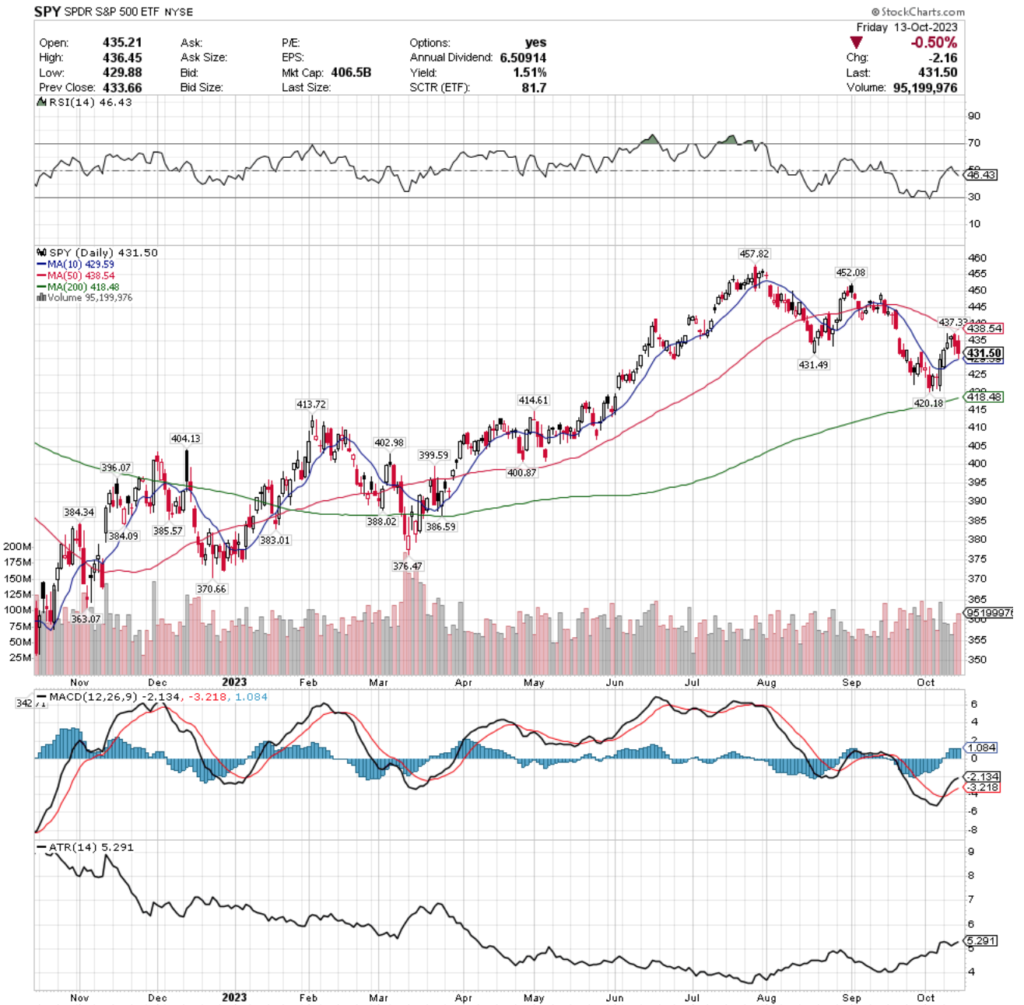
Their RSI is trending away from the neutral 50 mark & sits at 46.43, while their MACD remains bullish but is beginning to curl over bearishly, with a bearish crossover to be expected in the next few sessions.
Volumes were +2.58% above average last week compared to the year prior (85,155,567 vs. 83,016,788), which does not serve much in the way of tell-tales, however, the declining days’ volumes each outnumber the volumes on the advancing days, indicating that risk off sentiment is creeping in (or at the bare minimum, aggressive short-term profit taking).
Monday kicked off with the 10 Day Moving Average providing support for the opening price & pushing it higher for the next two days, however it is worth noting that volume faded beyond the first day of advances.
Wednesday’s hanging man candlestick set the tone for the end of the week’s declining sessions, but Friday’s risk off declining day was supported by the 10 DMA still, which will be an area of interest in the coming week, particularly as the 50 DMA begins to apply downwards pressure on SPY.
Their Average True Range (ATR) is reverting towards the mean after the last two days of decline, which indicates that there will be more bearish sentiment in the near-term & investors should be cautious.
Once the support of the 10 DMA is broken, all eyes should revert to the 200 DMA, as it will be closing in on the share price from below & support levels in this range are sparse over the past year.
If the 200 DMA is broken, the $413-414/share zone will be the major area of interest to be watching in case of further declines.
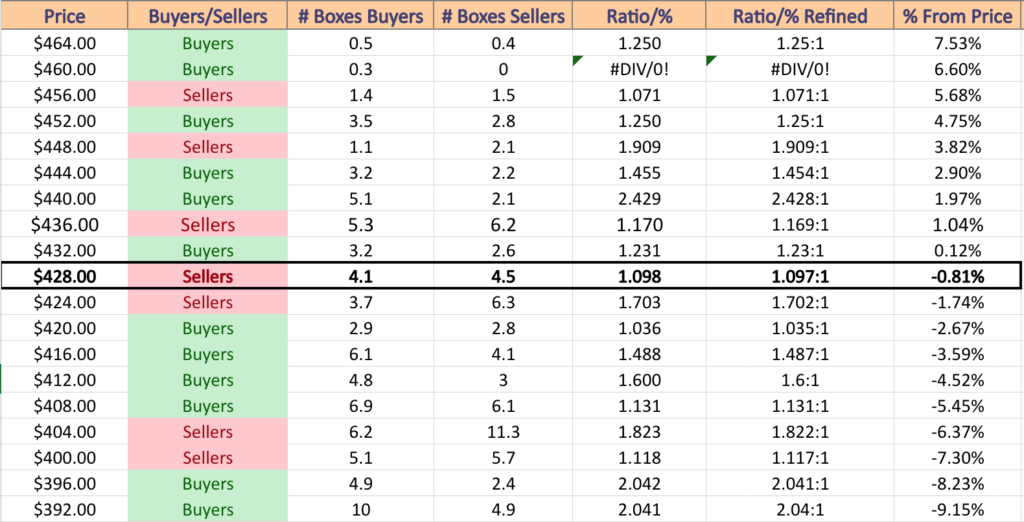
SPY has support at the $431.49 (Volume Sentiment: Sellers, 1.1:1), $429.59 (10 Day Moving Average; Volume Sentiment: Sellers, 1.1:1), $420.18 (Volume Sentiment: Buyers, 1.04:1) & $418.48/share (200 Day Moving Average; Volume Sentiment: Buyers, 1.49:1) price levels, with resistance at the $437.33 (Volume Sentiment: Sellers, 1.17:1), $438.54 (50 Day Moving Average; Volume Sentiment: Sellers, 1.17:1), $452.08 (Volume Sentiment: Buyers, 1.25:1) & $457.82 /share (Volume Sentiment: Sellers, 1.07:1) price levels.
QQQ, the Invesco QQQ Trust ETF inched forward +0.16% this past week, as market participants were not interested in the riskier, tech-heavy names.
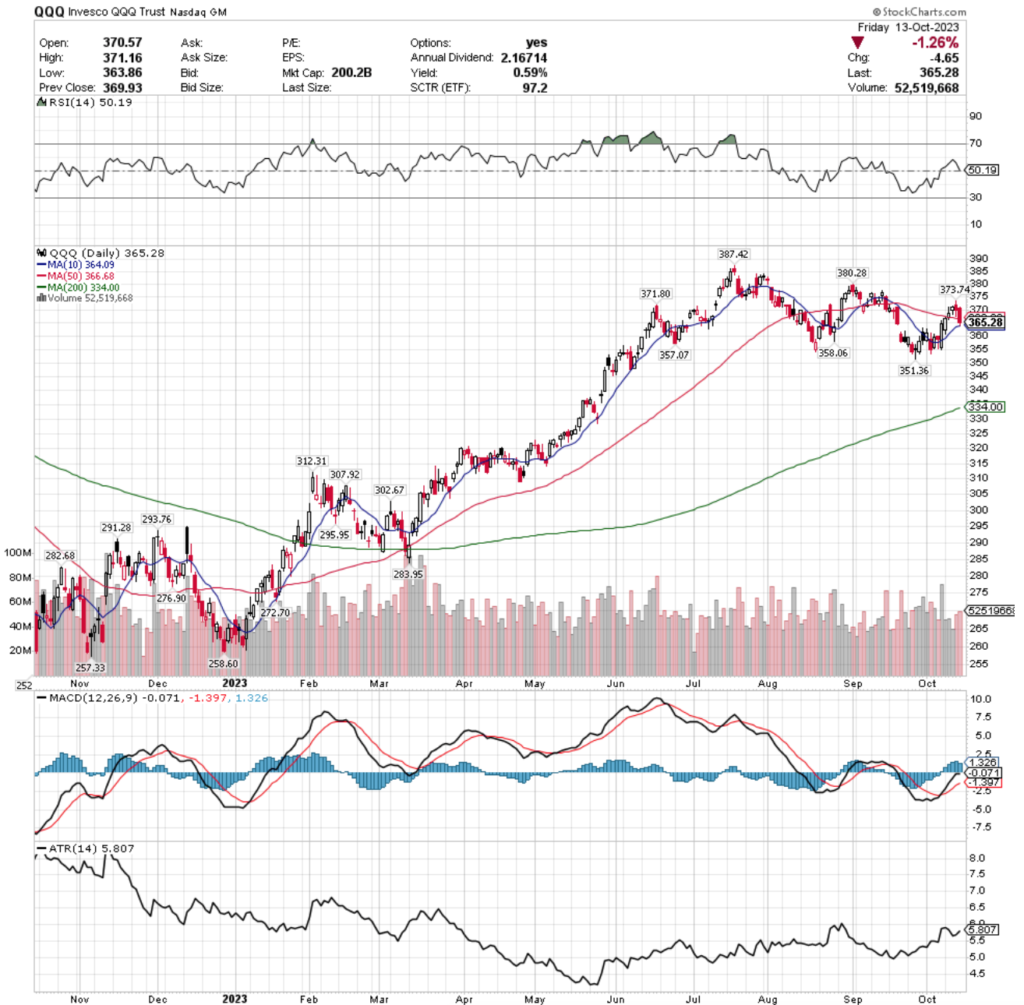
Their RSI is downtrending & about to pass through the neutral 50 mark bearishly, currently at 50.19, while their MACD is poised to roll over bearishly & bearishly crossover by mid-week.
Volumes were -5.06% below average last week compared to the year prior’s average (51,250,950 vs. 53, 981,234), indicating that there is less investor sentiment for NASDAQ names than average & enthusiasm is waning.
However, much like SPY, volumes were heavier on the declining days of Thursday & Friday than on the advancing days earlier in the week.
Monday was supported by the 10 day moving average, which led to Tuesday breaking above the resistance of the 50 DMA.
Wednesday’s hanging man set up the following two days of declines, and now all eyes are on the 10 DMA, as it is the closest support level.
Should that break down, there looks to be more trouble on the horizon, as their ATR looks primed to normalize more with further declines in the coming days.
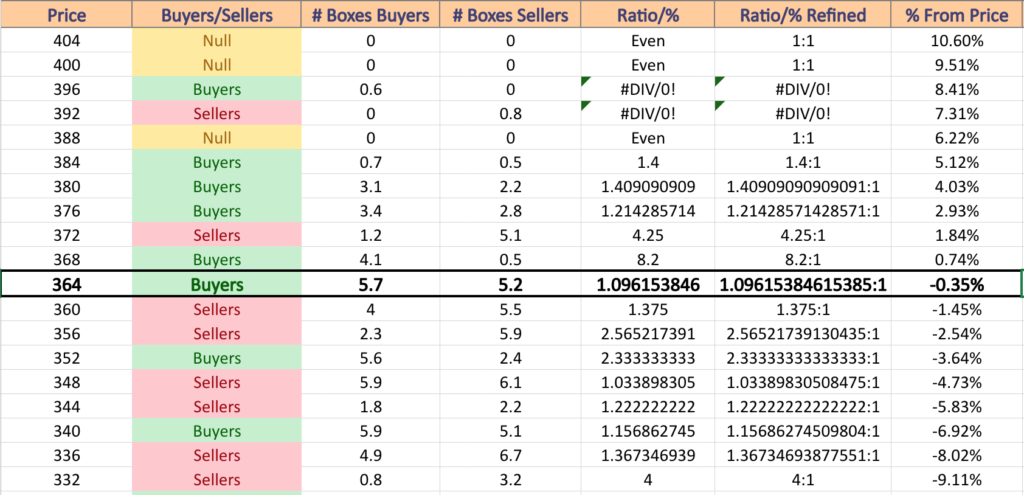
QQQ has support at the $364.09 (10 Day Moving Average; Volume Sentiment: Buyers, 1.1:1 ), $358.06 (Volume Sentiment: Sellers, 2.57:1), $357.07 (Volume Sentiment: Sellers, 2.57:1) & $351.36/share (Volume Sentiment: Sellers, 1.03:1) price levels, with resistance at the $366.68 (50 Day Moving Average; Volume Sentiment: Buyers, 1.1:1), $371.80 (Volume Sentiment: Buyers, 8.2:1), $373.74 (Volume Sentiment: Sellers, 4.25:1) & $380.28/share (Volume Sentiment: Buyers, 1.41:1) price levels.
IWM, the iShares Russell 2000 ETF declined -1.58% last week & was the only major index that ended in the red for the week.
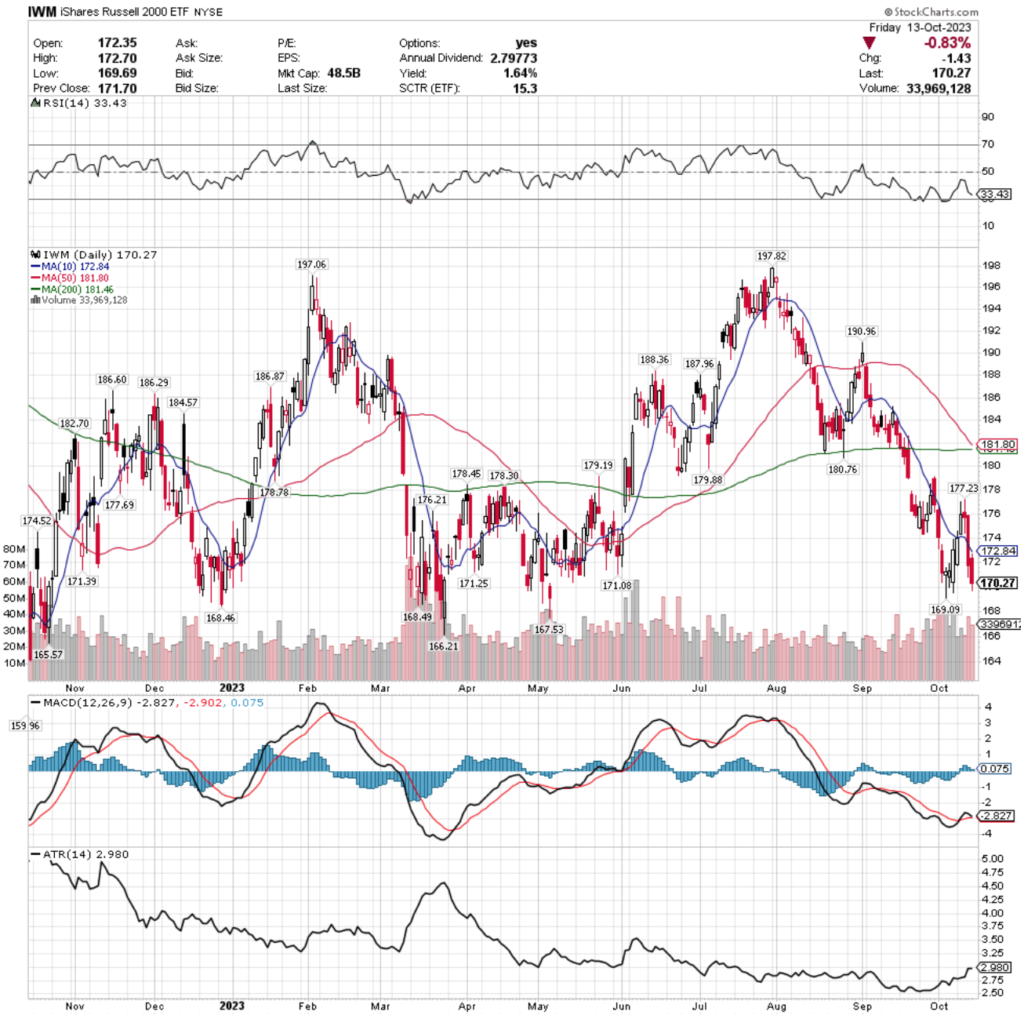
Their RSI is trending back towards oversold levels at 33.43, with a MACD that is going to make a bearish crossover in the next day or two.
Volumes were +18.59% above average last week compared to the year prior (33,410,783 vs. 28,172,563) as investors were looking to take profits off of the table after the recent run up that began in early October.
Wednesday’s spinning top candlestick on a bearish day set the tone for the end of the week, with Thursday’s session shattering the 10 DMA’s support & Friday’s decline day not even testing the resistance level it set.
Their ATR suggests that there may be a brief consolidation in the coming days, but the other indicators are suggesting further declines.
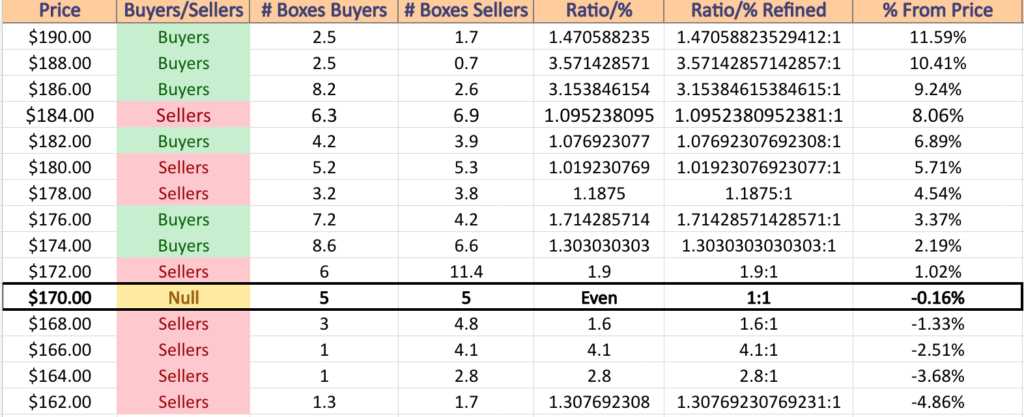
IWM has support at the $169.09 (Volume Sentiment: Sellers, 1.6:1), $168.49 (Volume Sentiment: Sellers, 1.6:1), $168.46 (Volume Sentiment: Sellers, 1.6:1) & $167.53/share (Volume Sentiment: Sellers, 4.1:1) price levels, with resistance at the $171.08 (Volume Sentiment: Even, 1:1), $171.25 (Volume Sentiment: Even, 1:1), $171.39 (Volume Sentiment: Even, 1:1) & $172.84/share (10 Day Moving Average; Volume Sentiment: Sellers, 1.9:1) price levels.
DIA, the SPDR Dow Jones Industrial Average ETF gained +0.77% over the past week, as investors flocked into the larger cap names while seeking some form of stability & safety without becoming completely risk-off.
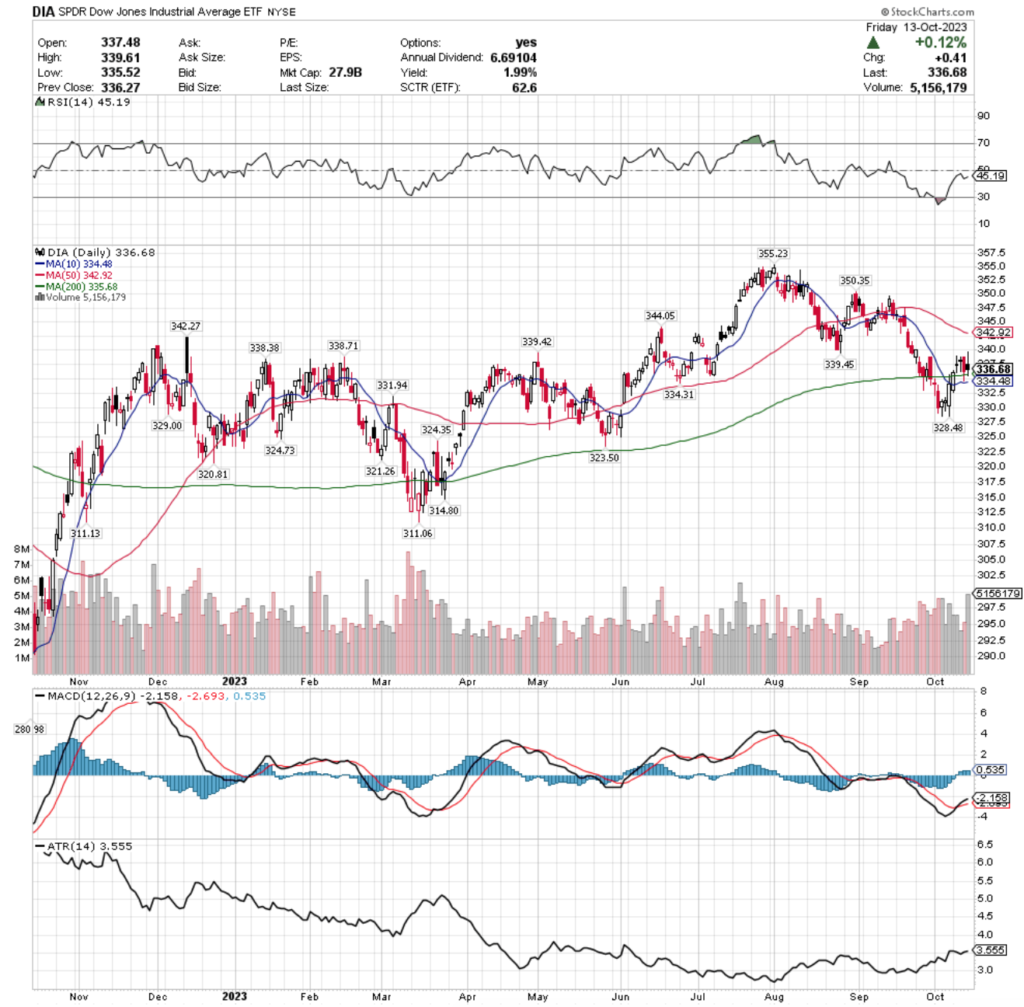
Their RSI is just below the neutral mark of 50 at 45.19, while their MACD is bullish, but clearly losing steam & looks set to bearishly crossover within the coming week.
Volumes were +7% above average last week compared to the year prior (3,876,233 vs. 3,622,649), which is notable as they highest volume day was Friday, when most folks were taking risk off & the day was an advancing session, despite ending in a spinning top candlestick that while being a positive day, ended lower than the opening price (bearish implications).
Tuesday’s session was able to find support, but the spinning top candlestick that closed lower than it opened signaled that there was pain to come, which Wednesday’s lower close than open dragonfly doji candle confirmed.
Thursday’s decline broke the 200 Day Moving Average’s support, but the 10 DMA held it up & Friday closed just above the 200 DMA, but on a spinning top that closed lower than it opened, indicating uncertainty & impending declines.
Their ATR suggests that by mid-week there will be more declines & the support of the 10 & 200 DMA’s will be tested.
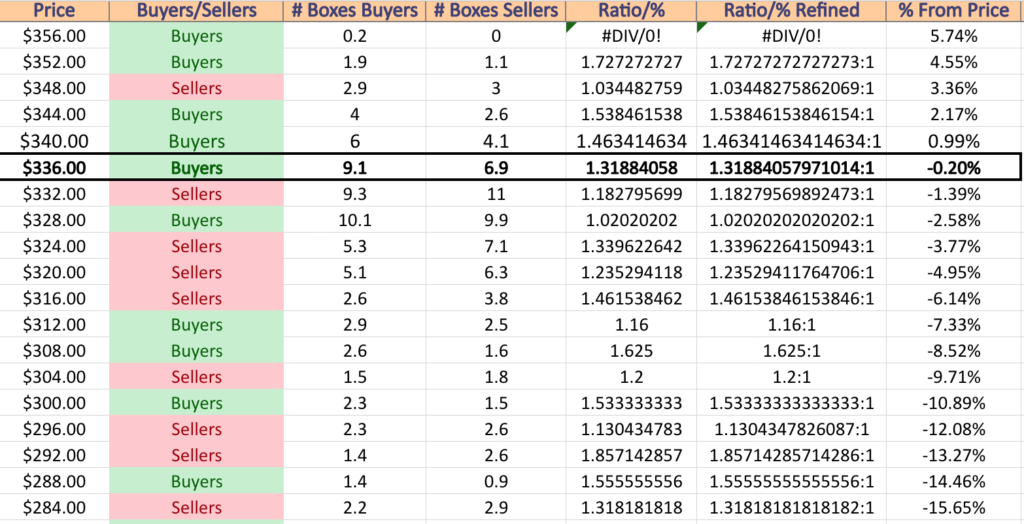
DIA has support at the $335.68 (200 Day Moving Average; Volume Sentiment: Sellers, 1.18:1), $334.48 (10 Day Moving Average; Volume Sentiment: Sellers, 1.18:1), $331.94 (Volume Sentiment: Buyers, 1.02:1) & $329/share (Volume Sentiment: Buyers, 1.02:1) price levels, with resistance at the $338.38 (Volume Sentiment: Buyers, 1.32:1), $338.71 (Volume Sentiment: Buyers, 1.32:1), $339.42/339.45 (Volume Sentiment: Buyers, 1.32:1) & $342.27/share (Volume Sentiment: Buyers, 1.46:1) price levels.
Oil & Gas Production & Exploration (GUSH), Japan (DXJ), Turkey (TUR) & North American Natural Resources (IGE) Are All Bullishly Leading The Market
GUSH, the Direxion Daily S&P Oil & Gas Exploration & Production Bull 2x Shares ETF has climbed +10.92% over the past year, gaining +59.13% since their 52-week low in March of 2023 (ex-distributions & using the Adjusted Closing Prices).
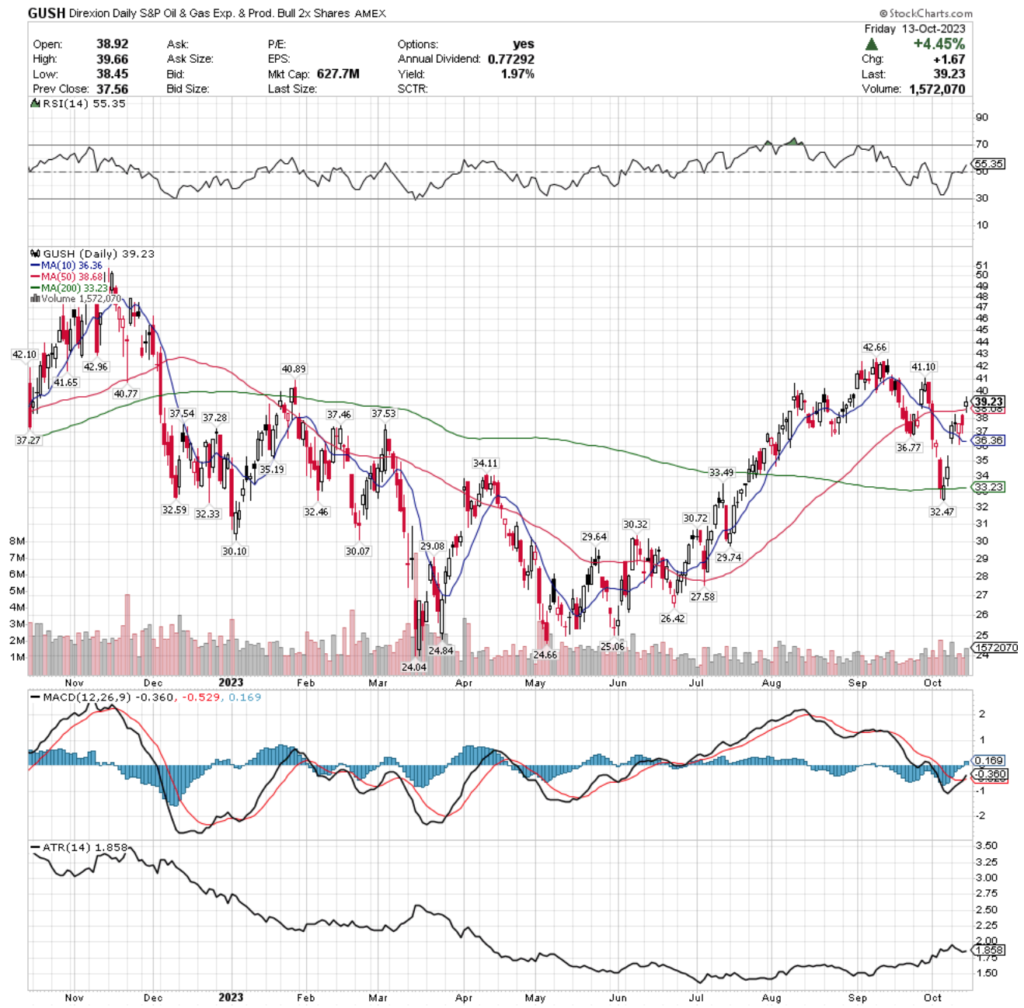
Their RSI is just above neutral trending north towards overbought levels at 55.35 & their MACD is bullish after completing a crossover recently.
Volumes were -21.39% below average last week compared to the year prior (1,337,800 vs. 1,701,814), signaling that investor enthusiasm is waning for GUSH.
Monday’s gap up session was the strongest volume of the week, but indecision began to show itself on Tuesday when the trading day resulted in a doji candlestick.
Wednesday showed weakness as the day began with a decline, tested lower (briefly dipping beneath the support of the 10 day moving average, but was able to close higher than it opened, while Thursday showed more weakness as the day ended in a decline.
Thursday was able to test higher than Wednesday & its open & closing price range were concentrated towards the upper end of the candlestick, which set the stage for Friday’s gap up that broke the resistance of the 50 DMA, but ultimately investors continued to signal indecision as the day resulted in a spinning top candlestick heading into the weekend.
Their Average True Range is reverting back to its mean & may be able to add in some brief strength, but by the end of the week most of the higher price level concentration will leave the calculation, and likely will result in declines.
While GUSH offers a 1.97% distribution yield, that is limited protection against declines in the near future & profit taking or hedging strategies using options such as buying puts or selling calls is something worth considering.
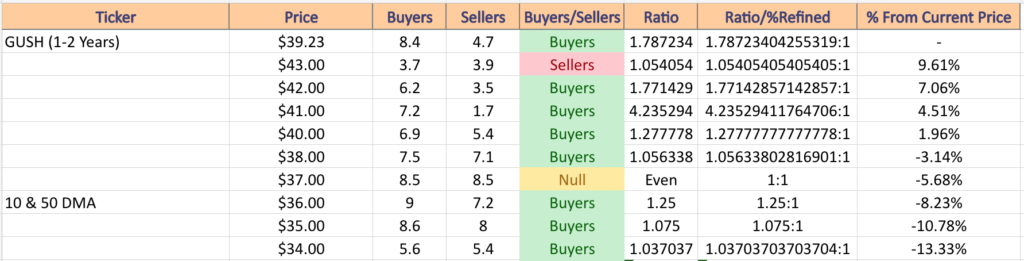
GUSH has support at the $38.68 (50 Day Moving Average; Volume Sentiment: Buyers, 1.06:1), $37.54/37.53 (Volume Sentiment: Even, 1:1), $37.46 (Volume Sentiment: Even, 1:1) & $37.28/share (Volume Sentiment: Even, 1:1) price levels, with resistance at the $40.77 (Volume Sentiment: Buyers, 1.28:1), $40.89 (Volume Sentiment: Buyers, 1.28:1), $41.10 (Volume Sentiment: Buyers, 4.24:1) & $41.65/share (Volume Sentiment: Buyers, 4.24:1) price levels.
DXJ, the WisdomTree Japan Hedged Equity Fund ETF has advanced +42.62% over the past year, adding +37.8% to their price since their 52-week low in October of 2022 (ex-distributions).
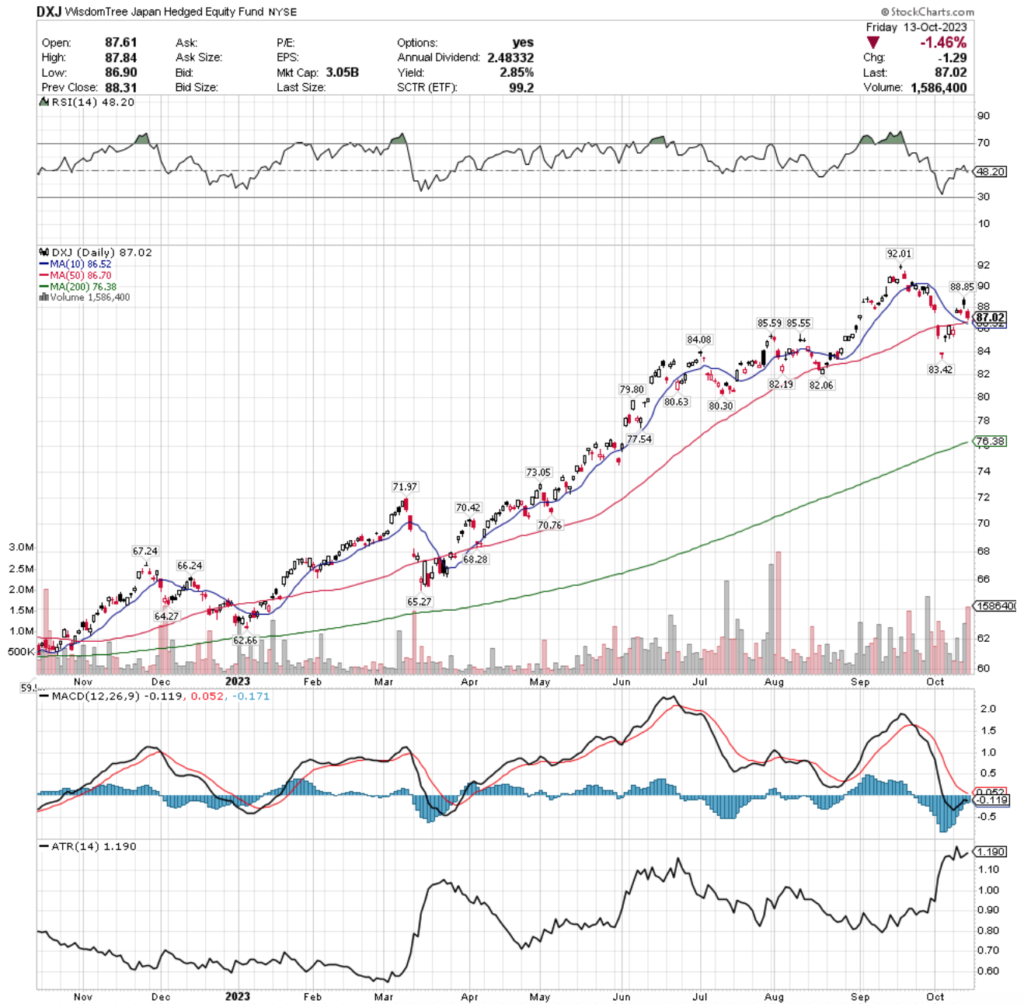
Their RSI is just below the neutral mark at 48.2, while their MACD is bearish but trying to advance towards a bullish crossover.
Volumes were 62.69% above average last week compared to the year prior (791,150 vs. 486,299), which has negative implications as their highest volume day for the week was a risk off Friday.
Monday kicked off on an indecisive note as the day resulted in a spinning top, followed by a gap up shooting star candlestick on Tuesday that was able to break above the resistance of the 10 & 50 day moving averages, but was still a bearish signal in the near-term.
Wednesday was another spinning top, as market participants were unsure of DXJ’s value & the price action was relatively contained in the day prior’s price range.
Thursday the bulls took over, forcing a gap up open that resulted in a black filled candle as the day closed below the open, despite opening sharply higher, in another sign that there is still heavily bearish sentiment.
Friday’s gap down confirmed this, although the support levels provided by the crossing 10 DMA through the 50 DMA (bearishly) held up & went untested throughout the day & will be an interesting area to watch this week.
Their Average True Range may be forming a head & shoulders type pattern, which would mean it would revert to the mean, and given where price levels are in the ATR calculation, further declines appear to be on the horizon in the near-term due to the volatile swings lower in the days that will remain in the calculation.
This is also confirmed by the bearish head & shoulders pattern that recent formed around their 52-week high in mid-September, as it appears that many investors have been taking profits off of the table over the past month.
A 2.58% distribution yield is a decent cushion against near-term losses for DXJ holders, but the impending volatility looks like it may be a good time to begin looking at hedging options on open positions.
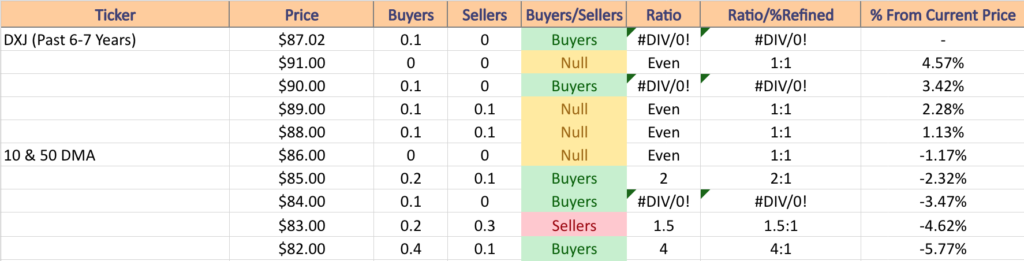
DXJ has support at the $86.70 (50 Day Moving Average; Volume Sentiment: NULL, 0:0), $86.52 (10 Day Moving Average; Volume Sentiment: NULL, 0:0*), $85.59 (Volume Sentiment: Buyers, 2:1) & $85.55/share (Volume Sentiment: Buyers, 2:1) price levels, with resistance at the $88.85 (Volume Sentiment: NULL, 0:0*) & $92.01/share (52 Week High; Volume Sentiment: NULL, 0:0*) price levels.
TUR, the iShares MSCI Turkey ETF has climbed +56.03% over the past year, adding +50.67% since their 52-week low in October of 2022 (ex-distributions).
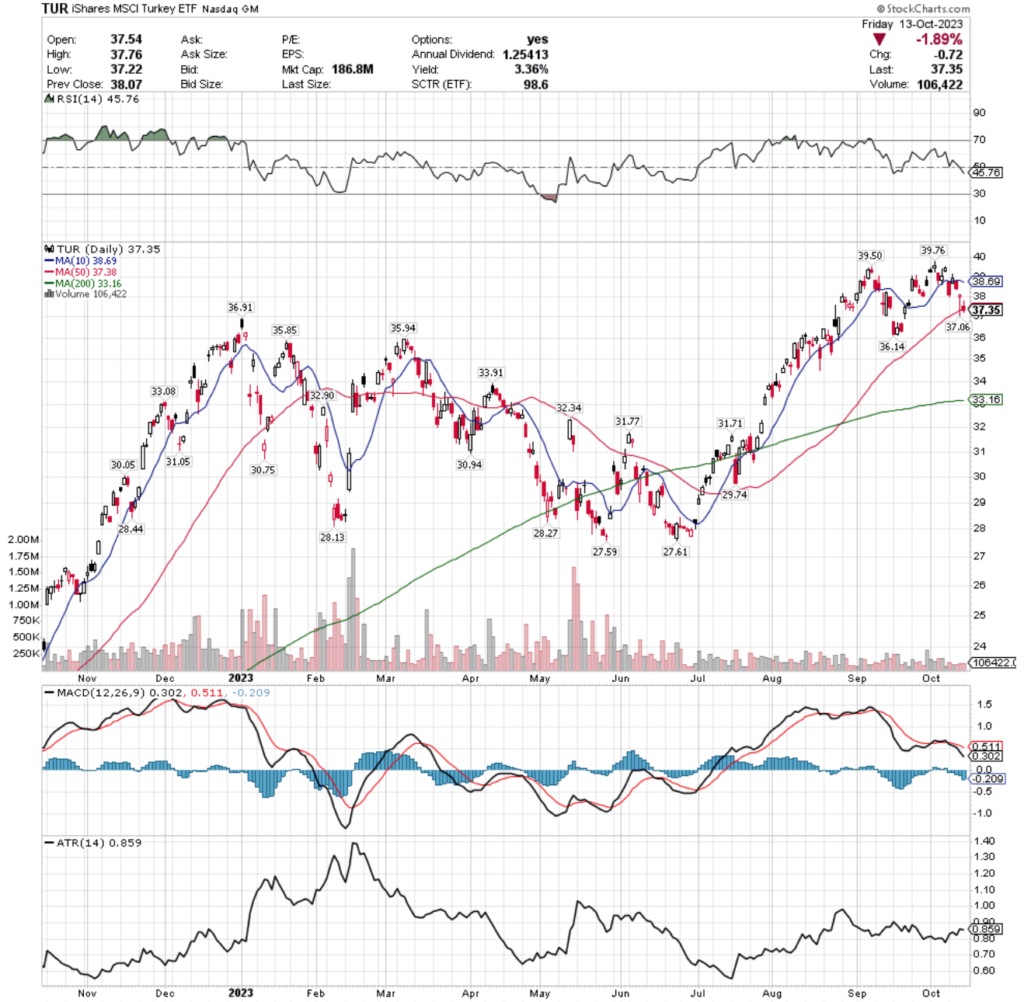
Their RSI is trending bearishly at 45.76 & their MACD is in bearish decline following their performance over the past week & a half.
Volumes were -69.68% below average last week compared to the year prior (92,100 vs. 303,732) which is a sign of investors’ waning sentiment, particularly when you realize that the sole bullish day of the week was also the lowest volume day as market participants began to take profits following their recent run up to new 52-week highs.
Monday started the week off on a solemn note for TUR, with their price dipping below the previous support of the 10 day moving average & hardly testing it during the day’s session, foreshadowing the weakness to come during the week.
Tuesday was able to break above the 10 DMA’s resistance, & tried making a break higher, but closed well below the highest price of the day & resulted in a shooting star candlestick, a bearish omen.
Wednesday the declines continued, with the day looking very similar to Monday in terms of being unable to break the 10 DMA’s resistance, however they did not trade as low as they did on Monday.
Thursday’s gap down hammer candle became cause for near-term future concern as well, as while the day’s open/close were concentrated near the top of the candle, the lower shadow covered a wide trading range & broke below the 50 DMA, signaling that there is likely more weakness to come, which was confirmed in Friday’s session.
Friday’s spinning top broke below the support of the 50 DMA as investors ran towards the door in risk-off fashion before the weekend, with the candle’s real body being concentrated towards the lower end of the candlestick, showing that investors are feeling uneasy about TUR’s near-term prospects & hinting at more declines to come.
Given that they’ve broken the support of the 50 DMA & their ATR & RSI are both in relatively neutral positions, there appears to be room for declines on the horizon for TUR before oscillators signal that things have sold off too far.
Despite having a 3.36% distribution yield, given their proximity to their 52-week high, it would be a wise time to plot out hedging strategies for TUR.
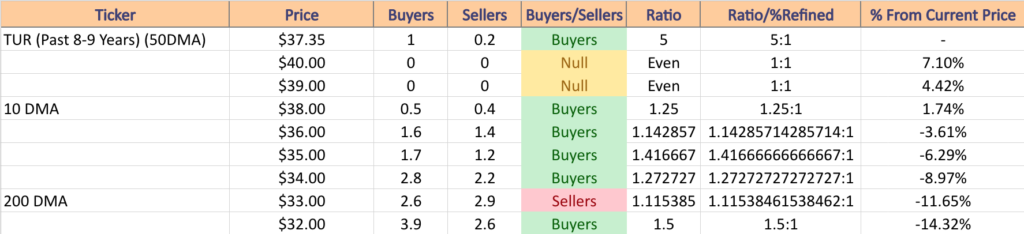
TUR has support at the $37.06 (Volume Sentiment: Buyers, 5:1), $36.91 (Volume Sentiment: Buyers, 1.14:1), $36.14 (Volume Sentiment: Buyers, 1.14:1) & $35.94/share (Volume Sentiment: Buyers, 1.42:1) price levels, with resistance at the $37.38 (50 Day Moving Average; Volume Sentiment: Buyers, 5:1), $38.69 (10 Day Moving Average; Volume Sentiment: Buyers, 1.25:1), $39.50 (Volume Sentiment: NULL, 0:0*) & $39.76/share (52-Week High; Volume Sentiment: NULL, 0:0*) price levels.
IGE, the iShares North American Natural Resources ETF climbed +14.73% over the past year, improving +16.18% since their 52-week low in March of 2023 (ex-distributions).
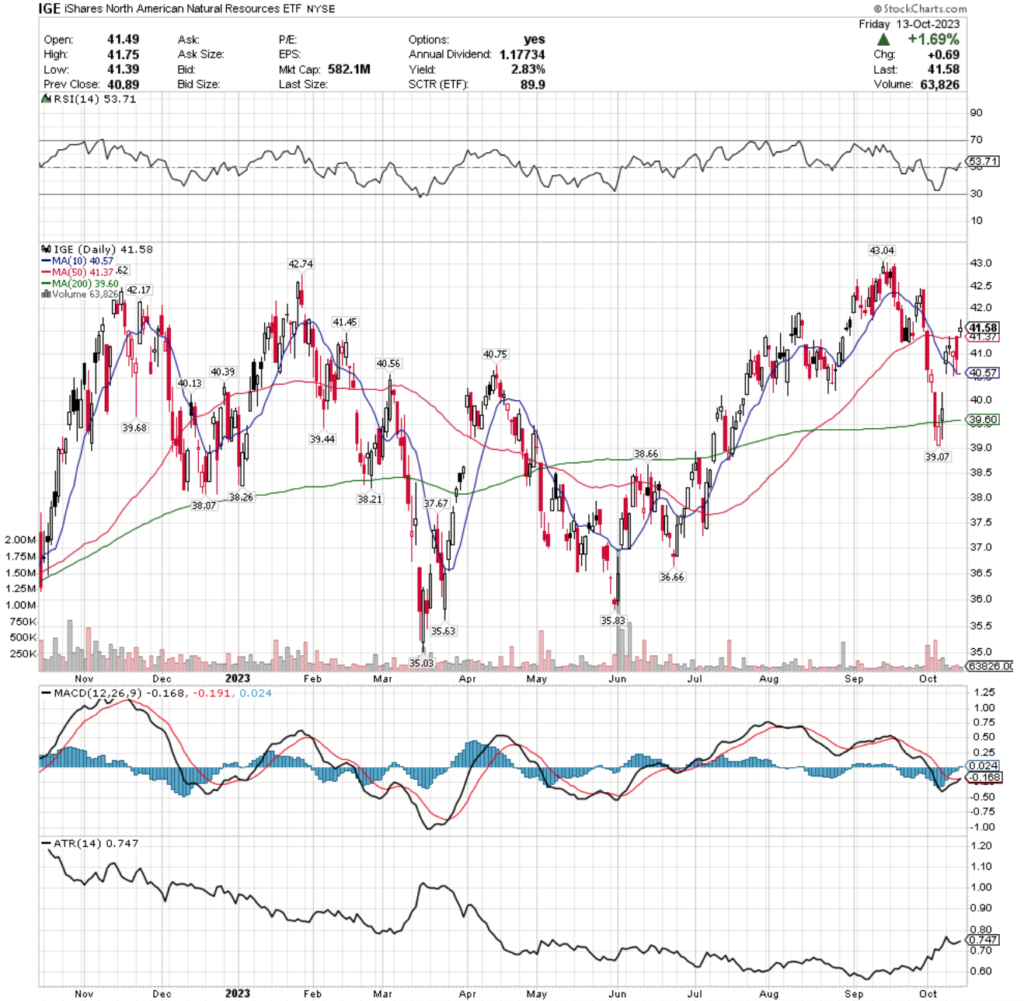
Their RSI is just above the neutral mark at 53.71 & their MACD recently had a bullish crossover a couple of days ago.
Volumes were -43.49% below average last week compared to the year prior (92,150 vs. 163,078), signaling that there is beginning to be a severe lack of enthusiasm for IGE by market participants, with the declining days leading the advancing days last week in terms of daily volume.
Monday kicked off with a major gap up where the day was able to close above the resistance of the 10 day moving average, but while Tuesday continued the climb, indecision & skittishness began to show through, as the upper shadow of the day’s candle was able to break the 50 DMA’s resistance, but the real body of the spinning top settled near the middle of the candle, signaling that investors are not confident.
Wednesday’s bearish hammer candle’s lower shadow tested the support of the 10 DMA & was able to temporarily break below it in a sign of weakness, & Thursday’s lower shadow was able to use it as support, but was unable to break & stay above the resistance of the 50 DMA.
While Friday’s spinning top was able to rest atop the 50 DMA as a support level, it signals that there is still much uncertainty about IGE in the eye’s of market participants.
Their ATR is currently reverting back to its mean, but by Thursday the days included in the calculation will be below Friday’s price & volatile, which signals more near-term unrest for IGE’s share price is on the horizon.
Despite offering a 2.83% distribution yield to long-term shareholders, there appears to be a bearish head & shoulders pattern forming with the head being the 52-week high & prices are nearing the left shoulder’s price level, making it important to have a hedging strategy in place.
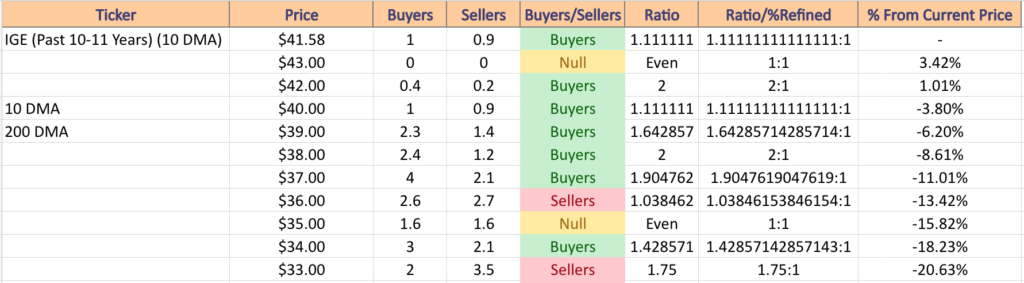
IGE has support at the $41.45 (Volume Sentiment: Buyers, 1.11:1), $41.37 (50 Day Moving Average; Volume Sentiment: Buyers, 1.11:1), $40.75 (Volume Sentiment: Buyers, 1.11:1) & $40.57/40.56/share (10 Day Moving Average; 2 Touch-points; Volume Sentiment: Buyers, 1.11:1) price levels, with resistance at the $42.17 (Volume Sentiment: Buyers, 2:1), $42.62 (Volume Sentiment: Buyers, 2:1), $42.74 (Volume Sentiment: Buyers, 2:1) & $43.04/share (52-Week High; Volume Sentiment: NULL, 0:0*) price levels.
Europe (EURL), China (CHAU), Junior Gold Miners (JNUG) & Chile (ECH) Are All Bearishly Lagging The Market
EURL, the Direxion Daily FTSE Europe Bull 3x Shares ETF has advanced +72.45% over the past year, gaining +68.09% since their 52-week low in October of 2022, but has recently been in a major decline, losing -29.84% since their 52-week high in May of 2023 (ex-distributions).
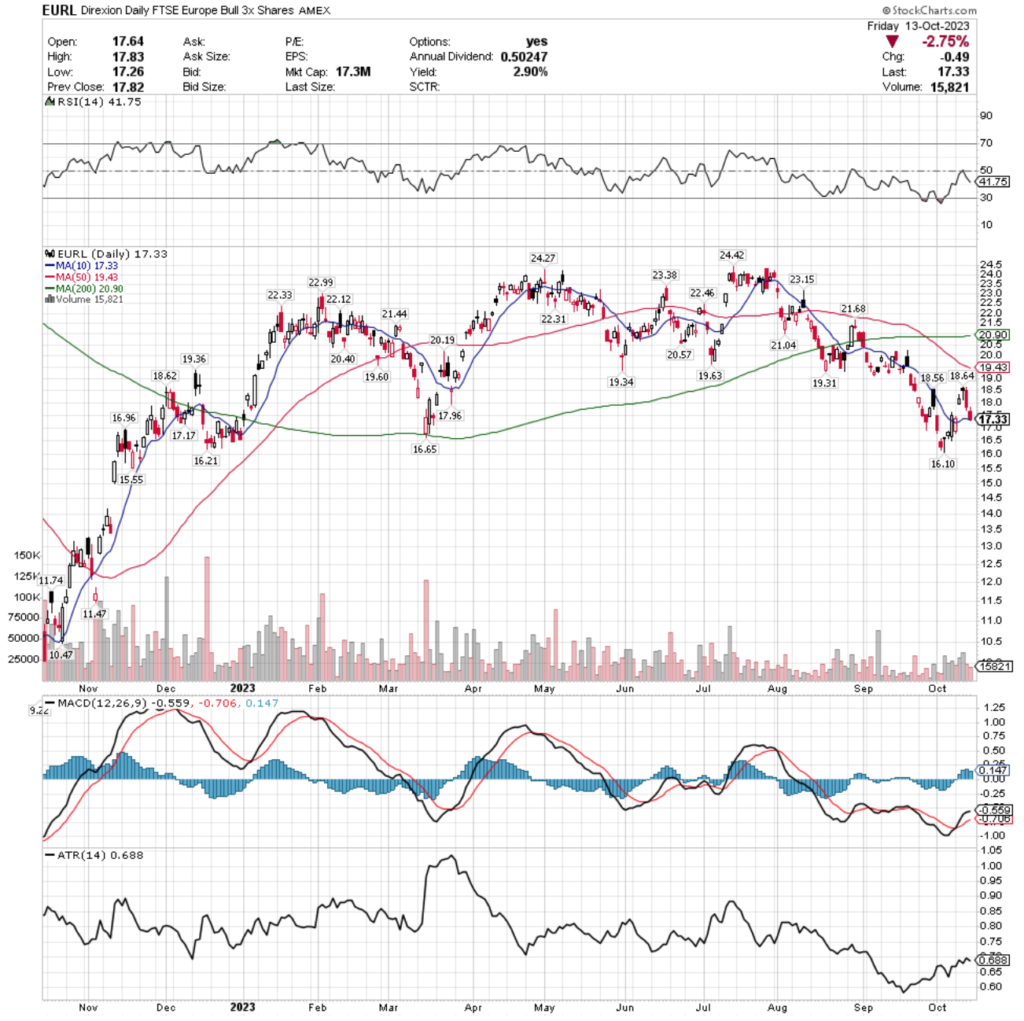
Their RSI is trending downwards towards the oversold end of neutral at 41.75, with a MACD that is still bullish, but beginning to curl over bearishly following the last few sessions.
Volumes were -24.11% below average last week compared to the year prior (23,316 vs. 30,725), but there was a glimmer of hope flashed as their bullish days had better volume than their bearish days.
However that seems to have faded quickly as the slide into the weekend more than covered the window created by Tuesday’s gap up & was only saved from falling further by the support of the 10 day moving average.
Their ATR suggests that we may see a brief consolidation period in the coming week, but with only a 2.9% distribution yield & an impending bearish MACD crossover, it would be wise to examine hedging strategies for open positions.
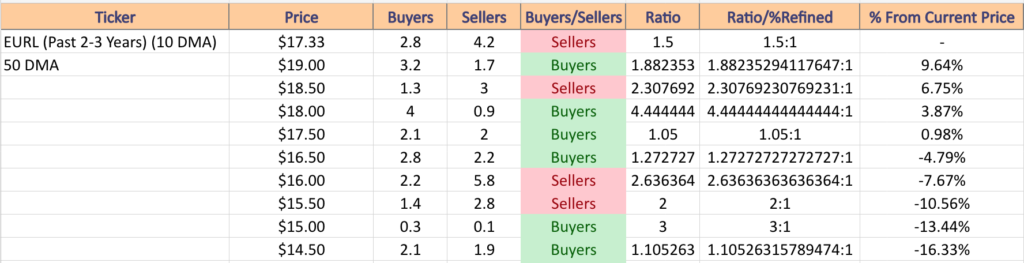
EURL has support at the $17.33 (10 Day Moving Average & Closing Price Friday; Volume Sentiment: Sellers, 1.5:1), $17.17 (Volume Sentiment: Sellers, 1.5:1), $16.96 (Volume Sentiment: Buyers, 1.27:1) & $16.65/share (Volume Sentiment: Buyers, 1.27:1) price levels, with resistance at the $17.96 (Volume Sentiment: Buyers, 1.05:1), $18.56 (Volume Sentiment: Sellers, 2.31:1), $18.62 (Volume Sentiment: Sellers, 2.31:1) & $18.64/share (Volume Sentiment: Sellers, 2.31:1) price levels.
CHAU, the Direxion Daily CSI 300 China A Shares Bull 3x Shares ETF has lost -14.9% over the past year, adding +4.05% since their 52-week low in October of 2022, but dropping -41.2% since their 52-week high in January of 2023 (ex-distributions).
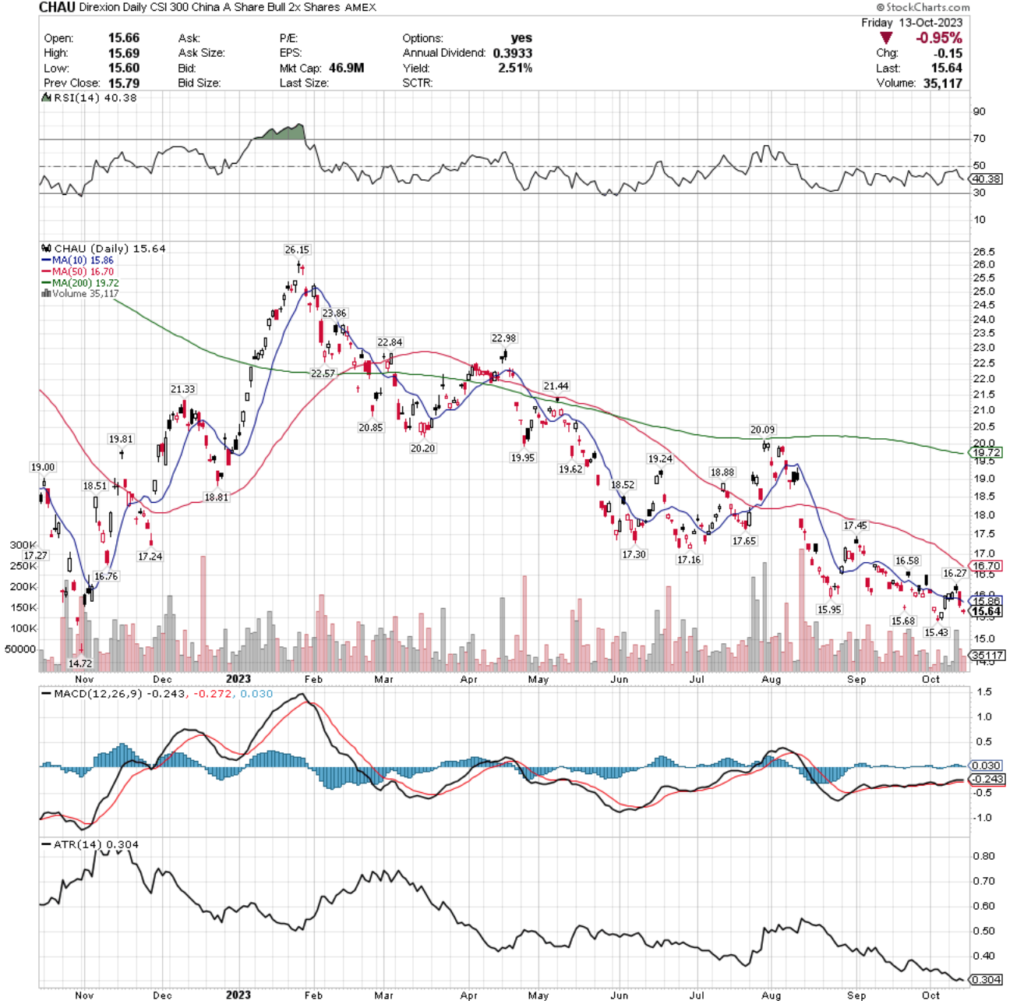
Their RSI is trending towards the oversold end of the neutral range at 40.38 & their MACD is still slightly hanging on to being bullish, but fading out after last week’s trading performance.
Volumes were -37.91% below average last week compared to the year prior (43,583 vs. 70,198), as investor sentiment is souring on CHAU & Wednesday’s spinning top closed lower than it’s open despite being a bullish day while having the week’s highest volumes, signaling weariness among market participants.
Monday kicked the week off with a hanging man, where the open was balanced atop the support of the 10 day moving average, which held up through Wednesday, where a minor gap up resulted in a spinning top that closed lower than it opened, signaling bearishness.
The high volume of that day is particularly concerning, as it led into two consecutive days of declines going into the weekend.
Thursday broke down through the support of the 10 day moving average & Friday’s bearish gap down signaled more bearishness is on the horizon as it moved further away from the resistance of the 10 DMA.
While their ATR suggests that there may be a brief consolidation on the horizon, counting back the days in the calculation it is evident it will last a week at most, as the price levels after that support more further declines & volatility.
While their 2.51% distribution yield will provide some cushion against losses, CHAU shareholders may want to be thinking more about hedging strategies & unloading shares in the coming days before the further declines continue.
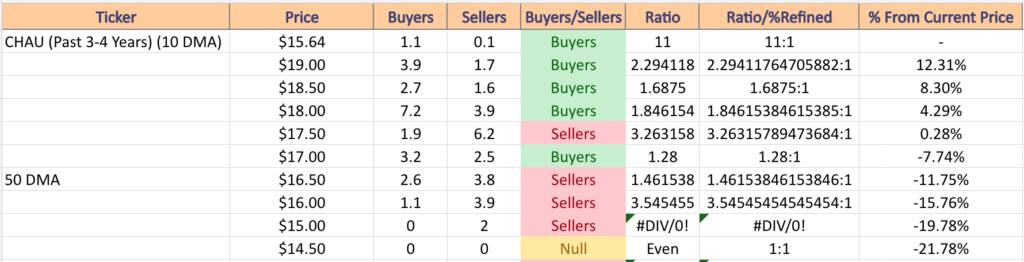
CHAU has support at the $15.43 (Volume Sentiment: Sellers, 2:0*) & $14.72/share (52-Week Low; Volume Sentiment: NULL, 0:0*) price levels, with resistance at the $15.68 (Volume Sentiment: Buyers, 11:1), $15.86 (10 Day Moving Average; Volume Sentiment: Buyers, 11:1), $15.95 (Volume Sentiment: Buyers, 11:1) & $16.27/share (Volume Sentiment: Sellers, 3.55:1) price levels.
JNUG, the Direxion Daily Junior Gold Miners Bull 2x Shares ETF has advanced +21.6% over the past year, including a +22.58% gain since their 52-week low in October of 2023, but has declined -45.86% since their 52-week high in April of 2023 (ex-distributions).
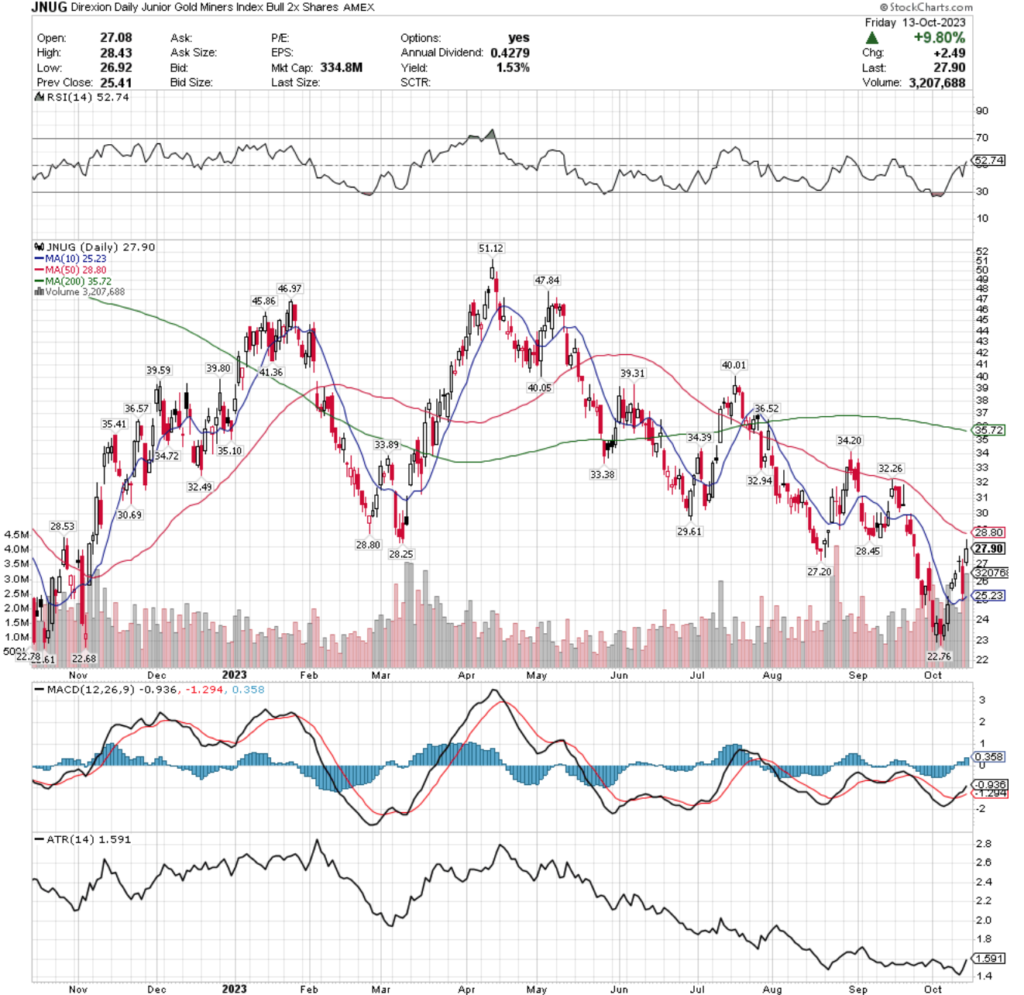
Their RSI has just broken across the neutral 50 mark & sits at 52.74, while their MACD remains climbing bullishly, as they may become a safe haven for market participants during heightened volatility.
Volumes were +56.72% above average last week compared to the year prior (2,399,383 vs. 1,530,961), mostly on the buying side days, which is also a bullish signal, or at least a much more positive signal than most of the volumes that have been looked at in this article.
Monday’s gap up over the resistance of the 10 DMA set the stage for the rest of the week, with Tuesday also advancing, before a bullish doji on Wednesday began to cast shadows of doubt onto their near-term future.
Sure enough, Thursday featured a down day that had a large price range, but it was supported by the 10 DMA & led into Friday’s advancing day.
Of note regarding Friday’s session, it was the highest volume day of the week & going into the weekend, which appears to be a sign of strength, but note that the open-to-close range of the candle’s real body is heavily concentrated on the lower half, and their large upper shadow signals that while there was interest in higher price levels, it was short lived & prices ultimately settled lower.
JNUG offers a 1.53% distribution yield which offers a small amount of cushion against losses in the near-term.
However, their ATR is suggesting that there may be more gains on the horizon (barring a broad market sell off), as it is reverting back towards its mean during the week of advances, but it would be wise to keep a close eye on its performance in the coming weeks in relation to the ATR for further clues into where it may head next.
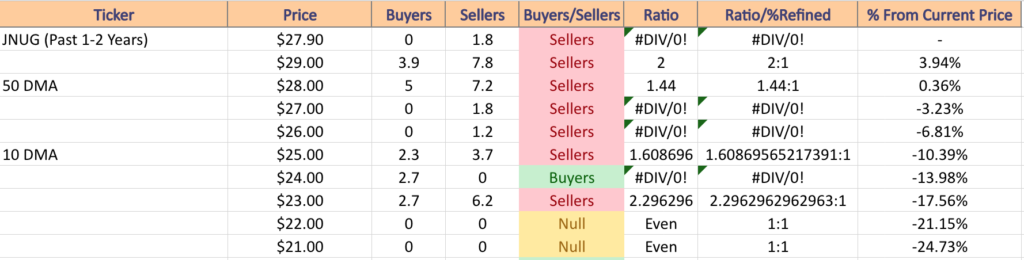
JNUG has support at the $27.20 (Volume Sentiment: Sellers, 1.8:0*), $22.78 (Volume Sentiment: NULL, 0:0*), $22.76 (Volume Sentiment: NULL, 0:0*) & $22.68/share (Volume Sentiment: NULL, 0:0*) price levels, with resistance at the $28.25 (Volume Sentiment: Sellers, 1.44:1), $28.45 (Volume Sentiment: Sellers, 1.44:1), $28.53 (Volume Sentiment: Sellers, 1.44:1) & $28.80/share (50 Day Moving Average; Two Touch-points; Volume Sentiment: Sellers, 1.44:1) price levels.
ECH, the iShares MSCI Chile Capped ETF has added +14.97% over the past year, gaining +7.92% since their 52-week low in October of 2022, but has lost -22.24% since their 52-week high in July of 2023 (ex-distributions).
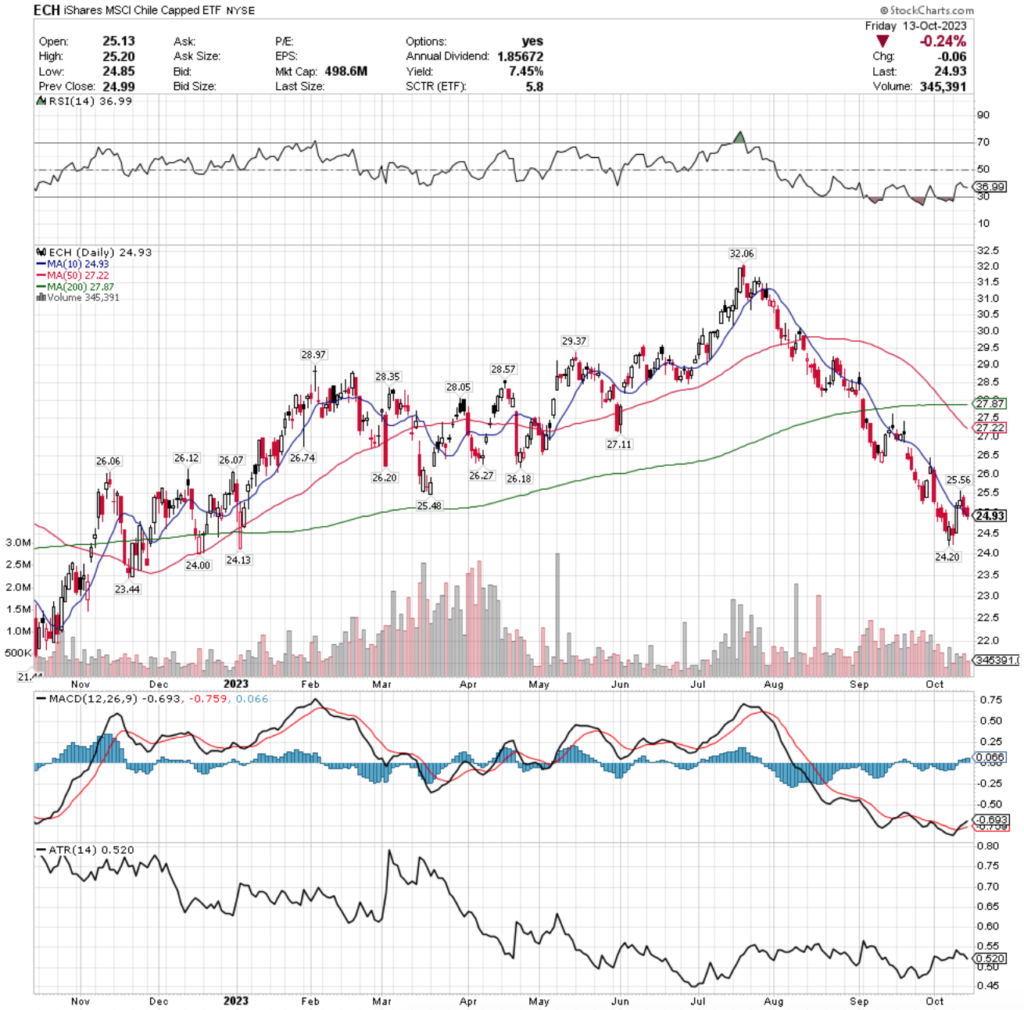
Their RSI is trending back towards oversold conditions at 36.99, while their MACD is bullish, but showing signals of near-term weakness that may result in a bearish crossover in the next few days.
Volumes were -33.65% below average last week compared to the year prior (453,533 vs. 683,568), which signals weakness in the gains they had on Tuesday & Wednesday last week, as although those days combined for slightly more bullish volume than the Thursday & Friday declines, Monday was also a bearish day & the sentiment is negative in the near-term.
Keep an eye on the 10 DMA this week, as prices have been fluctuating around it looking to find support, but seeming to not be firmly decided upon it becoming resistance, which will be a good indication of where ECH will be heading next.
Their ATR suggests that there is a chance of seeing a brief consolidation period, but other indicators suggest that may not occur until more declines take place & while their 7.45% distribution yield provides lots of room for a cushion against declines, it does not warrant taking that much risk & a wait & see approach with planned hedges seems wisest in this market setting.
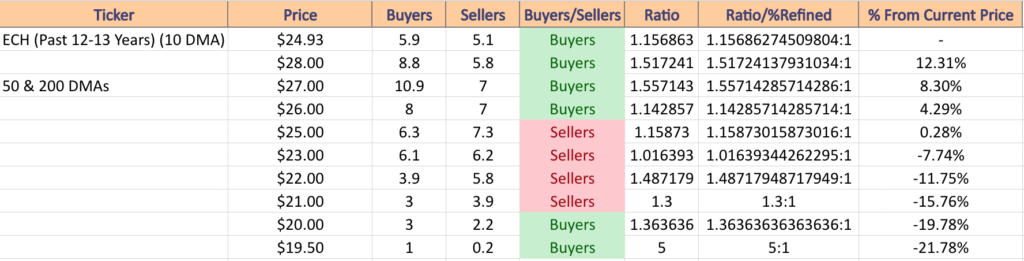
ECH has support at the $24.20 (Volume Sentiment: Buyers, 1.16:1), $24.13 (Volume Sentiment: Buyers, 1.16:1), $24 (Volume Sentiment: Buyers, 1.16:1) & $23.44/share (Volume Sentiment: Sellers, 1.02:1) price levels, with resistance at the $24.93 (10 Day Moving Average & Current Price Level; Volume Sentiment: Buyers, 1.16:1), $25.48 (Volume Sentiment: Sellers, 1.16:1), $25.56 (Volume Sentiment: Sellers, 1.16:1) & $26.06/$26.07/share (2 Touch-points; Volume Sentiment: Buyers, 1.14:1) price levels.
The Week Ahead
Monday kicks off with the Empire State Manufacturing Survey at 8:30 am, followed by Philadelphia Fed President Patrick Harker speaking at 10:30 am & again at 4:30 pm.
Charles Schwab & Equity Lifestyle Properties are scheduled to report earnings on Monday.
Tuesday we get U.S. Retail Sales & Retail Sales Minus Autos data at 8:30 am, followed by Industrial Production & Capacity Utilization data at 9:15 am, Business Inventories & Homebuilder Confidence Index data at 10 am & Fed Speaker Bowman & Minneapolis Fed President Neel Kashkari speaking at 10:30 am, & the day winds down with Richmond Fed President Tom Barking speaking at 10:45 am.
Tuesday’s earnings calls will be busy, with Johnson & Johnson, Albertsons, Bank of America, Bank of New York Mellon, Fulton Financial, Goldman Sachs, Hancock Whitney, Interactive Brokers, J.B. Hunt Transportation Services, Lockheed Martin, Pinnacle Financial Partners, Prologis, United Airlines & Wintrust Financial all scheduled to report.
Housing Starts & Building Permits data are released Wednesday at 8:30 am, followed by Fed Governor Chris Waller speaking at 12 pm, New York Fed President John Williams speaking at 12:30 pm, the Fed Beige Book released at 2 pm & wrapped up by Fed Governor Lisa Cook speaking at 6:55 pm.
Netflix, Tesla, Abbot Labs, Alcoa, Ally Financial, ASML, Citizens Financial Group, Crown Castle, Discover Financial Services, Equifax, F.N.B. Corp., First Horizon, Kinder Morgan, Lam Research, Las Vegas Sands, M&T Bank, Morgan Stanley, NASDAQ, Northern Trust, PPG Industries, Procter & Gamble, Rexford Industrial Realty, SL Green Realty, State Street, Steel Dynamics, Travelers, U.S. Bancorp, Winnebago & Zions Bancorp are all scheduled to report earnings on Wednesday.
Thursday will be a busy day, starting with Initial Jobless Claims & the Philadelphia Fed Manufacturing Survey data at 8:30 am, followed by Existing Home Sales & U.S. Leading Economic Indicators data reported at 10 am, before Fed Chairman Jerome Powell speaks at 12 pm & a number of other Fed members speaking throughout the rest of the afternoon (this seems interesting/worth keeping an ear open for).
Thursday’s earnings calls include Alaska Air, American Airlines, AT&T, Badger Meter, Blackstone, CSX, Fifth Third, Freeport-McMoRan, Genuine Parts, Intuitive Surgical, KeyCorp, Knight-Swift Transportation, Lindsay Corp, Manpower, Marsh McLennan, Phillip Morris International, Pool, Snap-On, Truist Financial, Union Pacific, WD-40, Webster Financial & WNS.
Friday winds down with Cleveland Fed President Loretta Mester speaking at 12:15 pm, with earnings calls from American Express, Autoliv, Comerica, Huntington Banc, Regions Financial & SLB.
See you back here next week!
*** I DO NOT OWN SHARES OR OPTIONS CONTRACT POSITIONS IN SPY, QQQ, IWM, DIA, GUSH, DXJ, TUR, IGE, EURL, CHAU, JNUG, or ECH AT THE TIME OF PUBLISHING THIS ARTICLE ***