SPY, the SPDR S&P 500 ETF declined -0.68% last week, as investors walked away from risk later in the week.
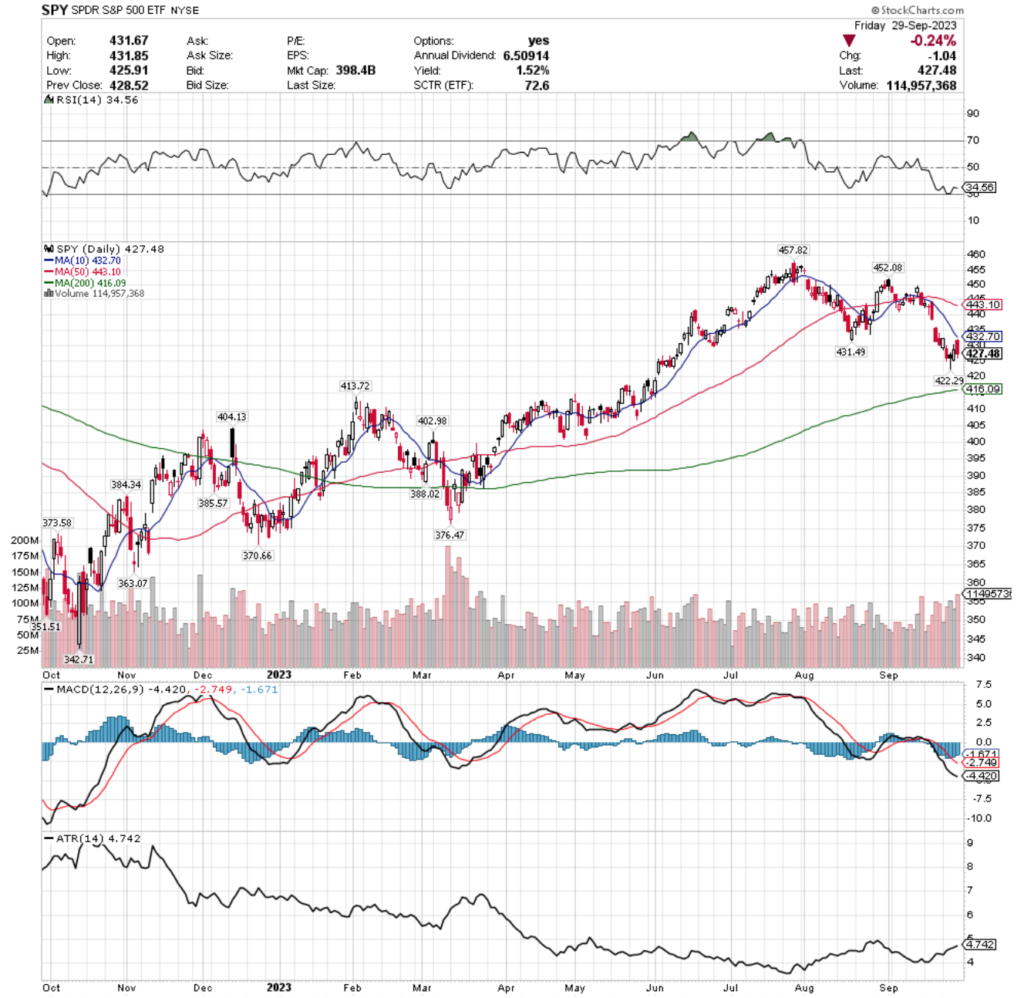
Their RSI is bouncing back from near oversold territory & sits at 34.56, while their MACD is bearish & attempting to make a run at a bullish crossover over the coming week.
Volumes were +15.32% above average last week compared to the year prior’s average, indicating that investors are not feeling overly confident given the strongest volume day was Friday’s risk off into the weekend session & their 3 bullish sessions were all relatively calm.
Monday kicked off with the lowest volume of the week as investors were not anxious to hop back into the pool, & Tuesday’s declines confirmed it.
Wednesday we saw a spinning top candlestick that was filled in (bearish) with the real body situated towards the top of the candle, signaling some bullish sentiment & predicting the bullish Thursday session (while still indicating uncertainty across the board).
Thursday attempted higher but the upper shadow of the candlestick compared to the closing level of the real body indicate that investors still were not that enthused, especially as the 10 Day Moving Average worked its way down towards the price level as a resistance level.
Friday closed on a bearish session that was unable to reach the resistance of the 10 DMA, but open & closing levels of the day’s range were more bullish than the day before.
Their ATR suggests that we will see a brief consolidation in the coming week, where all eyes should be glued to the 10 DMA to see how it impacts price action, while also keeping tabs on the 200 DMA that is currently acting as support.
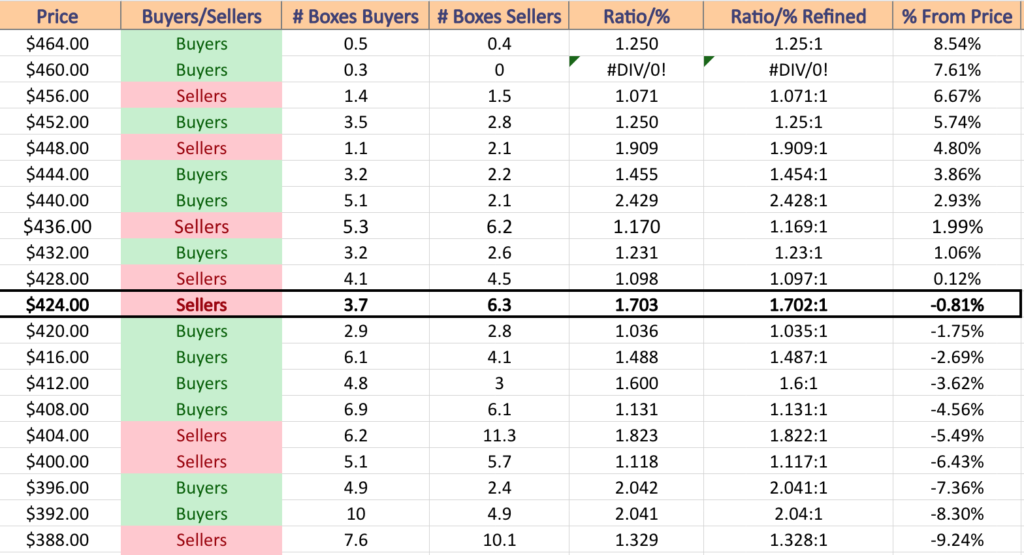
SPY has support at the $422.29 (Volume Sentiment: Buyers, 1.04:1 ), $416.09 (200 Day Moving Average; Volume Sentiment: Buyers, 1.49:1), $413.72 (Volume Sentiment: Buyers, 1.6:1) & $404.13/share (Volume Sentiment: Sellers, 1.82:1) price levels, with resistance at the $431.49 (Volume Sentiment: Sellers, 1.1:1), $432.70 (10 Day Moving Average; Volume Sentiment: Buyers, 1.23:1), $443.10 (50 Day Moving Average; Volume Sentiment: Buyers, 2.43:1) & $454.08/share (Volume Sentiment: Buyers, 1.25:1) price levels.
QQQ, the Invesco QQQ Trust ETF inched up +0.1% over the past week, faring second best of the major indexes.
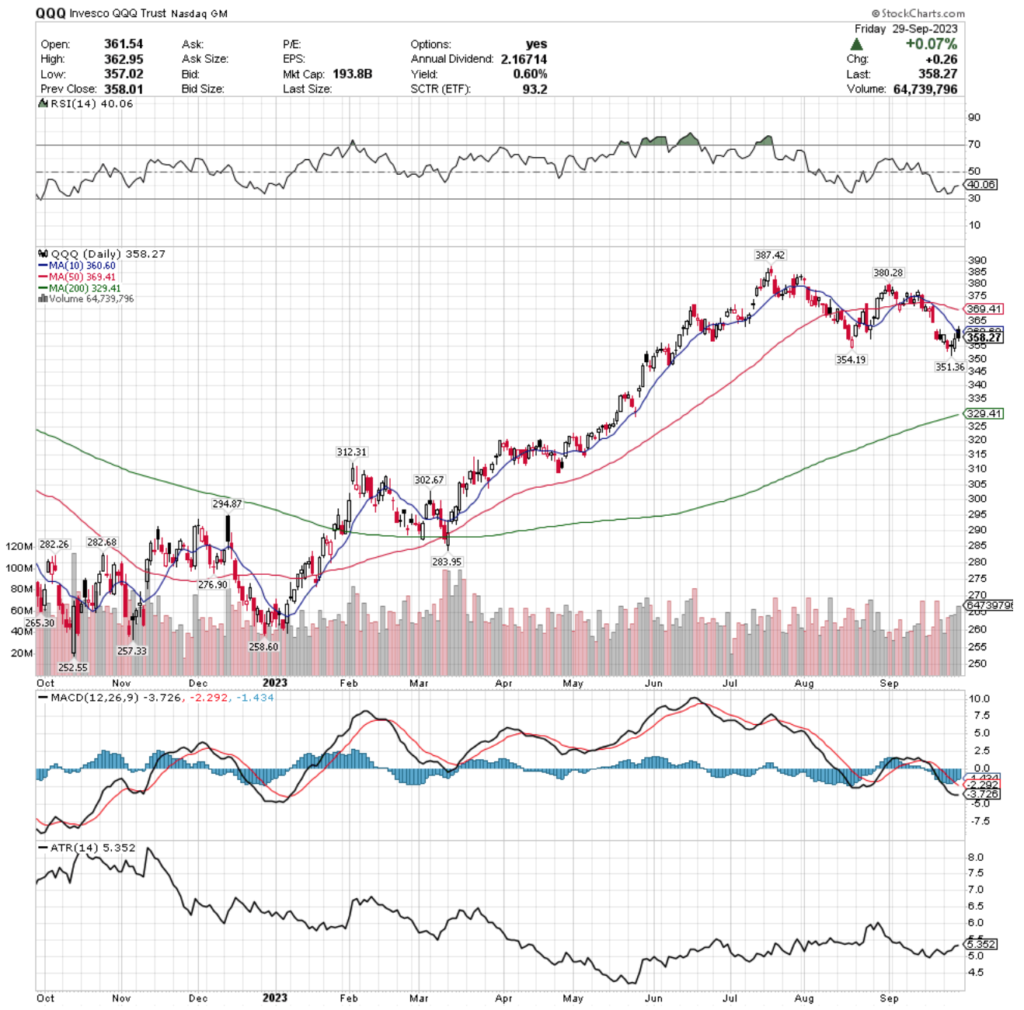
Their RSI is currently at 40.06, getting out of the oversold end of the neutral range, while their MACD looks to be making an attempt at a bullish crossover in the coming week.
Volumes were -2.06% lower than average last week compared to the average volume of the year prior, which has bearish implications given that 4 of the 5 sessions last week resulted in advances that people were not enthusiastic to participate in.
Monday’s candlestick had a brief glimmer of faint optimism, closing bullish on the day & advancing from last Friday’s risk off session, but Tuesday the bears took back control & walked prices lower.
Wednesday closed with a dragonfly doji, indicating indecision, but also a potential reversal & prices went north on Thursday & Friday.
Friday, however, was unable to test the 10 DMA successfully & as a result that will be adding downward resistance pressure against the price.
Their ATR implies that there may be a brief consolidation in the coming week for their price, with each passing day the range becoming more friendly for a greater decline in the near-term.
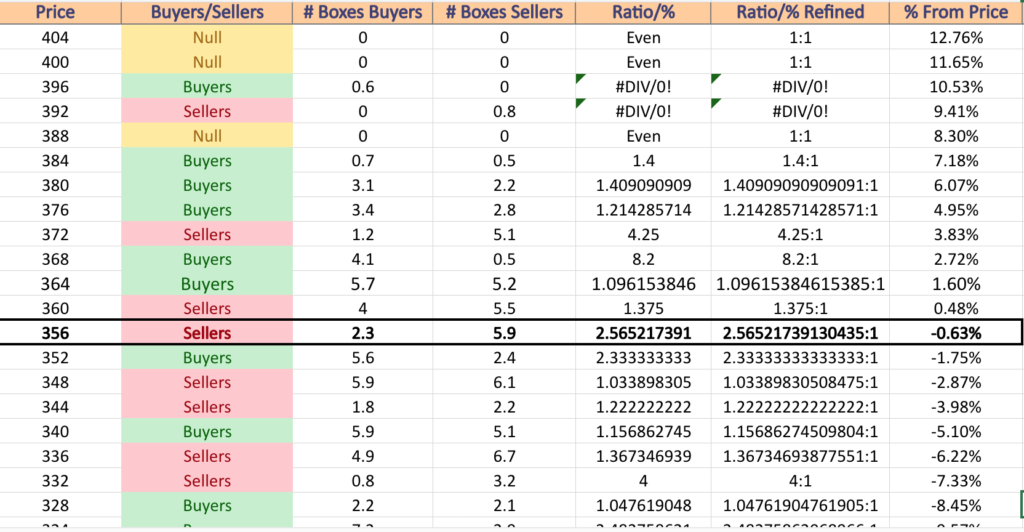
QQQ has support at the $354.19 (Volume Sentiment: Buyers, 2.33:1), $351.36 (Volume Sentiment: Sellers, 1.03:1), $329.41 (200 Day Moving Average; Volume Sentiment: Buyers, 1.05:1) & $312.31/share (Volume Sentiment: Sellers, 2:1) price levels, with resistance at the $360.60 (10 Day Moving Average; Volume Sentiment: Sellers, 1.38:1), $369.41 (50 Day Moving Average; Volume Sentiment: Buyers, 8.2:1), $380.28 (Volume Sentiment: Buyers, 1.41:1) & $387.42/share (Volume Sentiment: Buyers, 1.4:1) price levels.
IWM, the iShares Russell 2000 ETF climbed +0.51% over the past week, as investors showed the most interest in small cap stocks out of the major indexes.
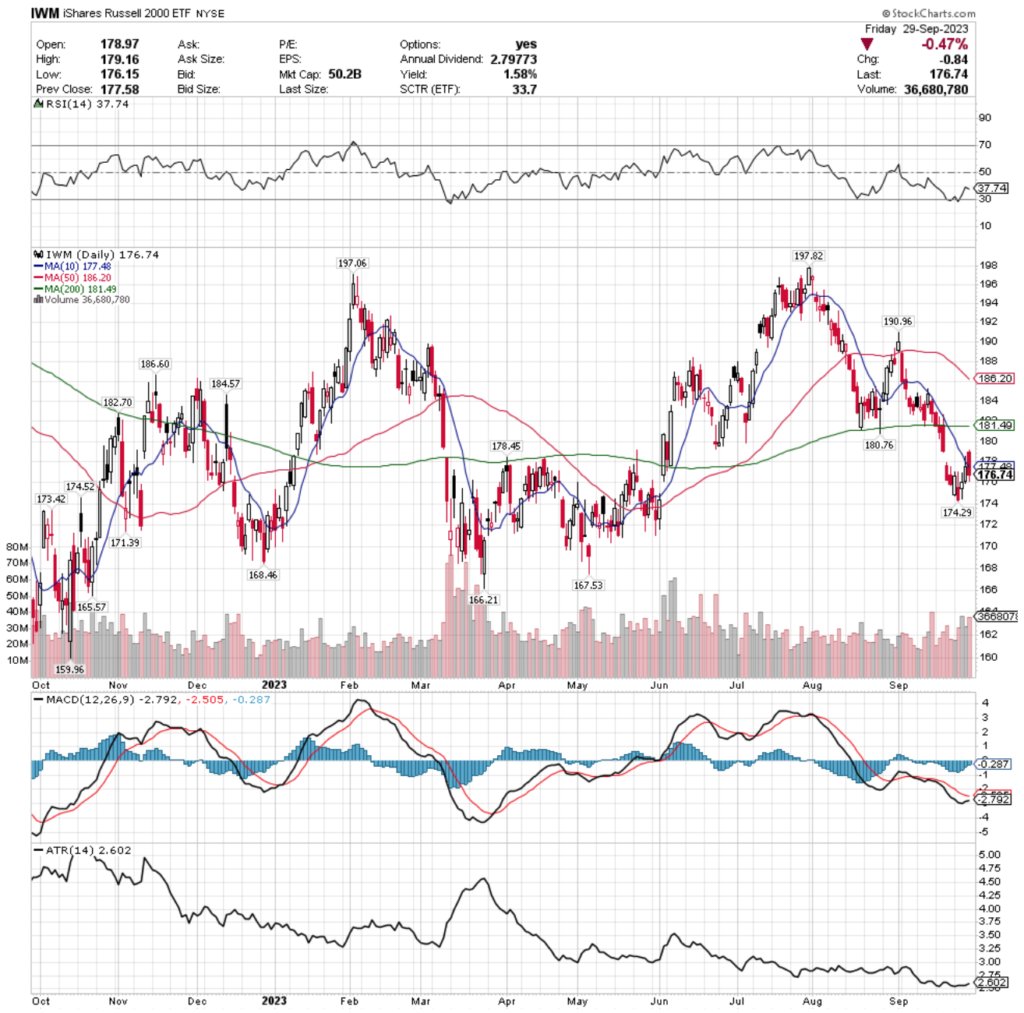
Their RSI is trending back towards oversold, currently at 37.74 & their MACD looks primed to have a possible bullish crossover in the coming days.
Volumes were +6.01% higher than average last week compared to the year prior, which is slightly bullish when you break down the advancing:declining days, however, like the previous 2 indexes, watch the 10 DMA.
Monday closed lower, but the upper shadow paved the way for the rest of the week’s candles, until Friday’s was unable to break the resistance of the 10 DMA.
It is also worth noting that their 200 DMA is about to roll over bearishly while applying resistance.
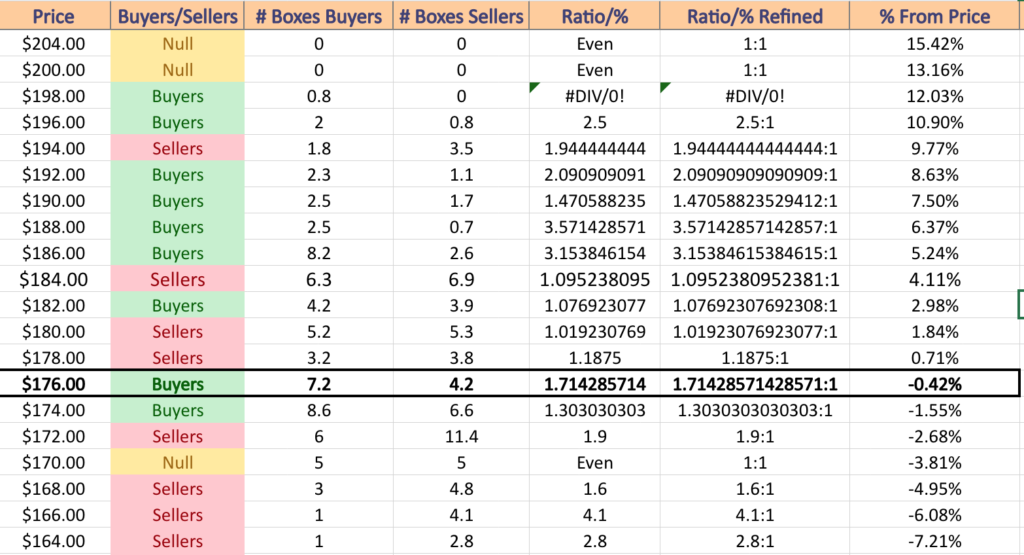
IWM has support at the $174.52 (Volume Sentiment: Buyers, 1.3:1), $174.29 (Volume Sentiment: Buyers, 1.3:1), $173.42 (Volume Sentiment: Sellers, 1.9:1) & $171.39/share (Volume Sentiment: Even, 1:1) price levels, with resistance at the $177.48 (10 Day Moving Average; Volume Sentiment: Buyers, 1.71:1), $178.45 (Volume Sentiment: Sellers, 1.9:1), $180.76 (Volume Sentiment: Sellers, 1.02:1) & $181.49/share (200 Day Moving Average; Volume Sentiment: Sellers, 1.02:1 ) price levels.
DIA, the SPDR Dow Jones Industrial Average ETF fell -1.36% last week, having the worst week of all of the major indexes.
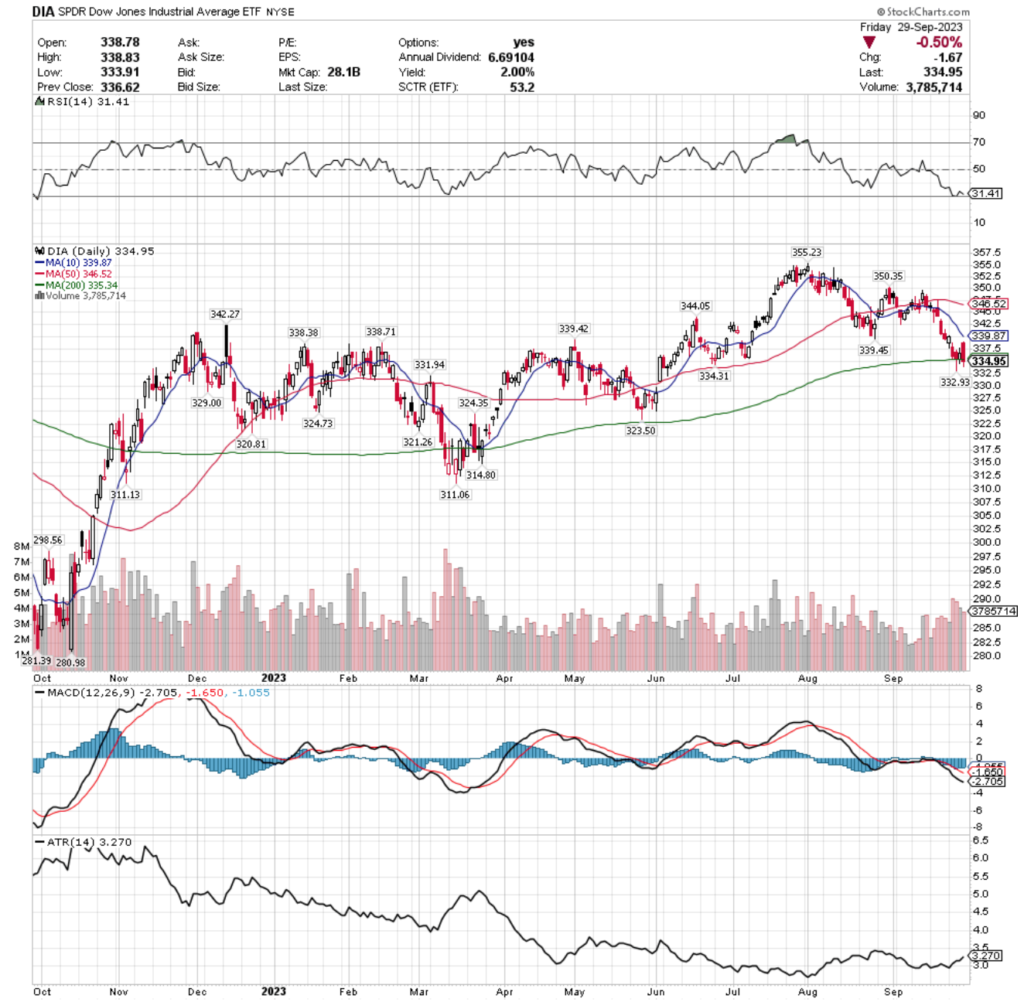
Their RSI is currently trending towards oversold at 31.41, with their MACD in decline & looking to continue further south.
Volumes were +7.93% higher than average last week compared to the average volume for the year prior, which signals bearish sentiment as outflow volume outnumbered bullish days.
Monday’s slightly bullish session gave a shot of hope, but Tuesday opened with declines before the 200 DMA caught their price & helped nudge it higher, even if momentarily.
Friday they closed below the 200 DMA’s support level, which sets the stage for more pressure to the downside.
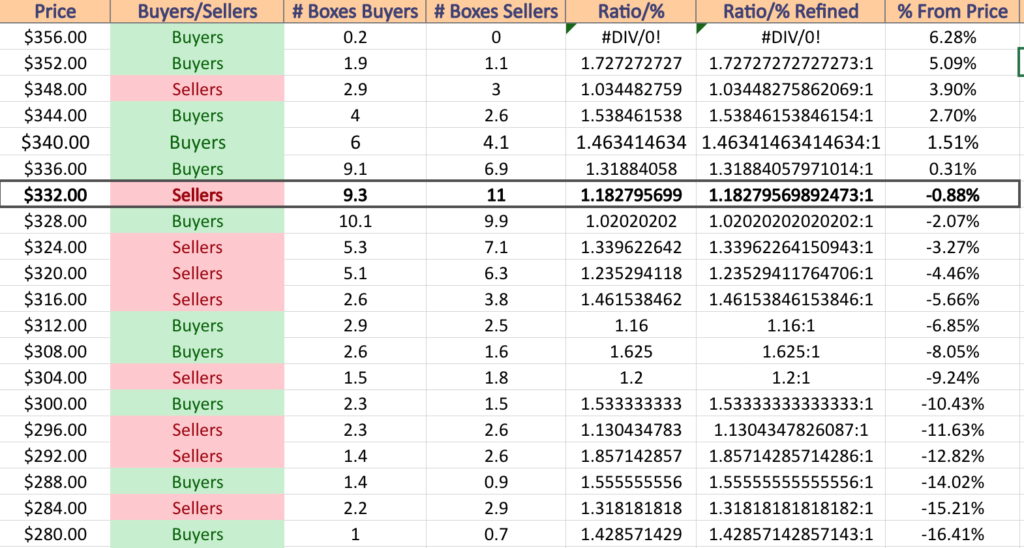
DIA has support at the $334.31 (Volume Sentiment: Sellers, 1.18:1), $332.93 (Volume Sentiment: Sellers, 1.18:1), $331.94 (Volume Sentiment: Buyers, 1.02:1) & $329/share (Volume Sentiment: Sellers, 1.46:1) price levels, with resistance at the $335.43 (200 Day Moving Average; Volume Sentiment: Sellers, 1.18:1), $339.42 (Volume Sentiment: Buyers, 1.32:1), $339.87 (10 Day Moving Average; Volume Sentiment: Buyers, 1.32:1) & $342.27/share (Volume Sentiment: Buyers, 1.46:1) price levels.
Uranium (URA), Oil & Gas (DIG), Natural GAS (FCG) & Semiconductors (SMH) Are All Bullishly Leading The Market
URA, the Global X Uranium ETF has gained +35.74% over the past year, including a gain of +47.68% from their 52-week low in March of 2023 (ex-distributions).
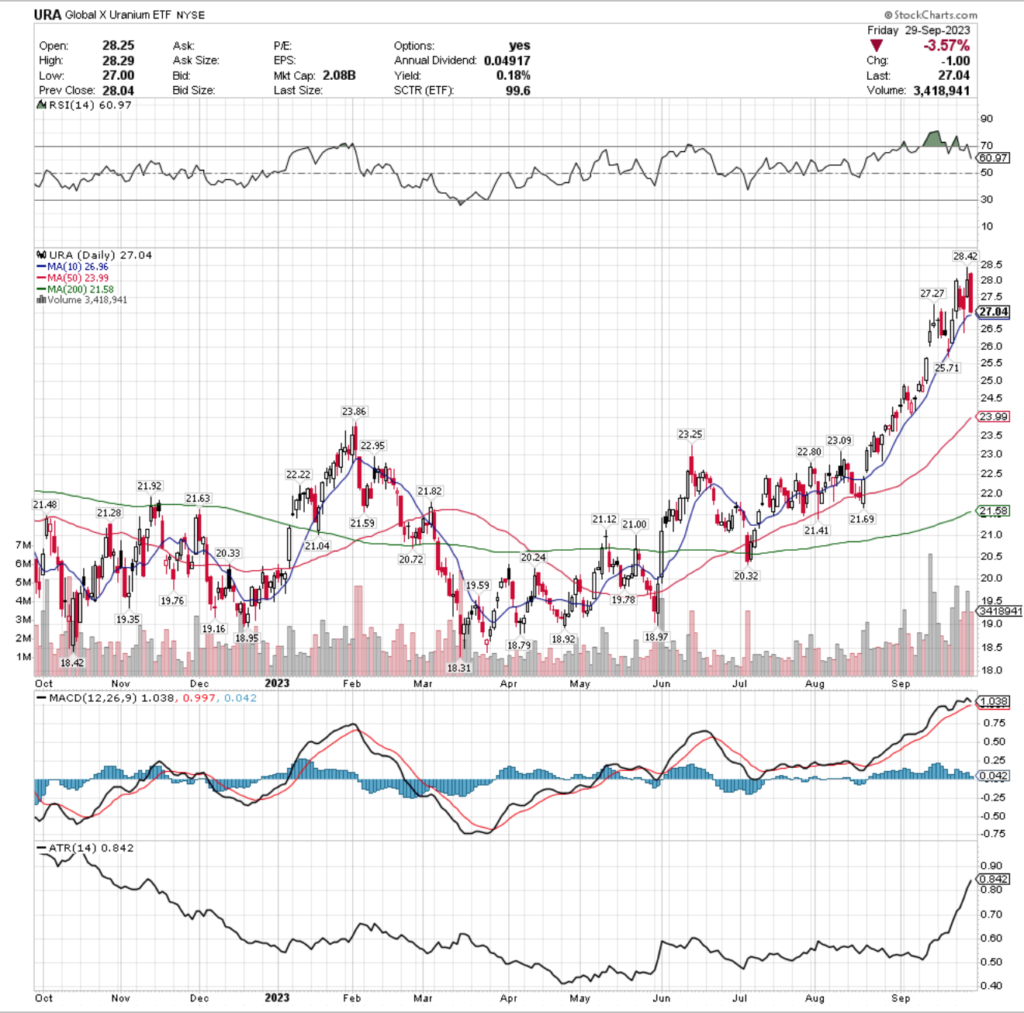
Their RSI is returning from overbought territory & trending back towards neutral following the declines of Wednesday & Thursday’s session & their MACD looks set for a bearish crossover early next week.
Volumes spiked +121.12% over the past week compared to the average for the year prior, as investors were getting excited as URA reached a new 52-week high on Thursday & some profits were taken on Friday.
Wednesday’s high declining volume that preceded the new 52-week high is a cause for concern though & shows that investors are beginning to lose enthusiasm for URA in the near-term, atop the profit taking that we saw on Friday.
Monday opened the week up on a strong note for URA, but Tuesday’s session resulted in a bearish harami, which was confirmed during Wednesday’s wild decline session, where investors were selling in droves & prices dipping beneath the support of the 10 day moving average during the session.
Thursday the sellers took back over & pushed the new 52-week high, but the session resulted in a shooting star candle, signaling hesitancy on the part of market participants & setting the stage for Friday’s selloff into the weekend that closed just above the 10 day moving average.
URA offers a 0.18% distribution yield, which will not protect much against losses & so it would be a wise time to consider trimming profits or to look into a hedging strategy using options such as selling calls or buying puts.
The 10 DMA will be an important support level to watch in the coming week, and URA’s Average True Range suggests that we will see a consolidation in the coming week as it looks to revert back towards its mean.
URA has support at the $26.96 (10 Day Moving Average; Volume Sentiment: Buyers,1.31:1), $25.71 (Volume Sentiment: Buyers, 1.19:1), $23.99 (50 Day Moving Average; Volume Sentiment: Buyers, 1.79:1) & $23.86/share (Volume Sentiment: Buyers, 1.79:1) price levels, with resistance at the $27.27 (Volume Sentiment: Buyers, 1.31:1) & $28.42 (52-Week High; Volume Sentiment: Buyers, 24:1) price levels.
DIG, the ProShares Ultra Oil & Gas ETF has climbed +40.92% over the past year, adding +47.09% since their 52-week low in September of 2022 (ex-distributions).
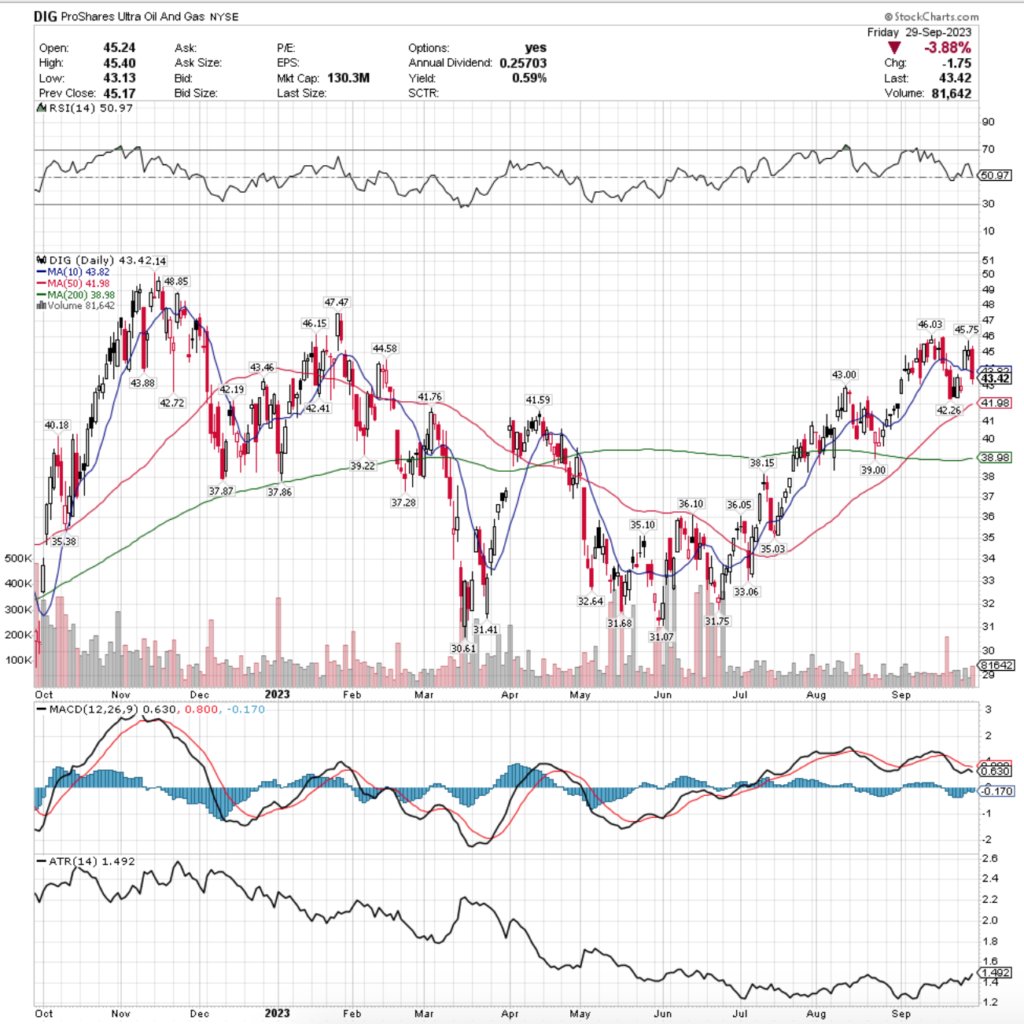
Their RSI is neutral at 50.97, but their MACD has been bearish for the last couple of weeks following their last decline in mid-September.
Volumes dropped -49.75% last week compared to the average volume for the year prior, signaling that investors have become wary of their near-term future & value.
Monday’s session showed a revived enthusiasm following a week & a half long decline for DIG, but Tuesday’s session formed a bearish harami pattern with a spinning top candlestick, confirming the uncertainty that we see in the volume.
Wednesday was a gap up that was able to open above the support of the 10 day moving average, which while it came as a surprise makes sense given the day prior’s session did close higher than the open, despite being a declining day.
Thursday’s shooting star candlestick was the foreshadowing for the risk off Friday session, where prices closed below the 10 DMA’s support & showed that investors were thinking of even lower based on the lower shadow of the candle.
DIG’s Average True Range suggests that we will be seeing a consolidation move this week & with only a 0.59% distribution yield it would be worth considering hedging options for any positions in DIG.
Their 50 DMA will prove to be an interesting level of support in the near-term now that their 10 DMA is pushing downward while applying resistance to their share-price.
DIG has support at the $43 (Volume Sentiment: Buyers, 1.43:1), $42.72 (Volume Sentiment: Buyers, 1.43:1), $42.26 (Volume Sentiment: Buyers, 1.43:1) & $42.19/share (Volume Sentiment: Buyers, 1.43:1) price levels, with resistance at the $43.46 (Volume Sentiment: Buyers, 1.43:1), $43.82 (10 Day Moving Average; Volume Sentiment: Buyers, 1.43:1), $43.88 (Volume Sentiment: Buyers, 1.43:1) & $44.58/share (Volume Sentiment: Sellers, 1.13:1) price levels.
FCG, the First Trust Natural Gas ETF advanced 17.92% over the past year, adding +27.9% since their 52-week low in March of 2023 (ex-distributions).
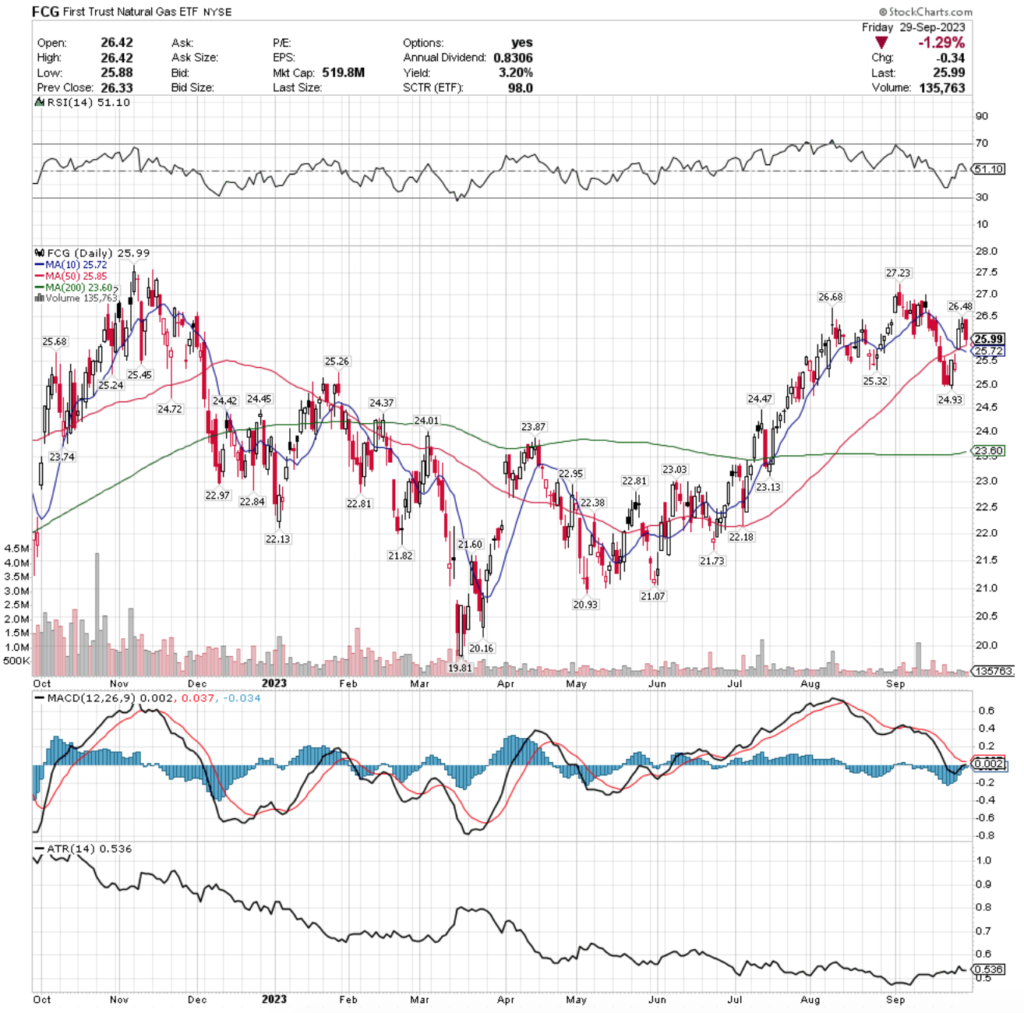
Their RSI is neutral at 51.1 & their MACD is currently bearish, but is making an attempt at a bullish crossover following Wednesday’s gap up session.
Volumes fell a dramatic -73.86% last week below average compared to the year prior, indicating that market participants are feeling very reserved & unsure about the near-term for FCG.
Monday kicked off strong with a bullish engulfing candle that was followed Tuesday by a shooting star that while it was a red candle did close higher than it opened & the upper shadow tested higher, but was stopped short of the resistance of the 50 day moving average.
Wednesday’s gap up opened right in the cradle that was created by the 10 DMA crossing bearishly through the 50 DMA, but Thursday’s spinning top set the stage for the declines seen on Friday’s session as the already indecisive investors showed even more uncertainty with the day’s price action.
Friday resulted in a decline, but the lower shadow of the candle for the day was supported by the 50 day moving average, which will be an important level to watch as this week unfolds, especially as their 10 DMA is declining at such a steep angle.
FCG’s ATR indicates that there is a cool down period on the near-term horizon & while they provide a 3.2% distribution yield to long-term holders that serves as some cushion against losses, it looks like a hedging strategy in the near-term is worth looking into.
FCG has support at the $25.85 (50 Day Moving Average; Volume Sentiment: Buyers, 1.38:1), $25.72 (10 Day Moving Average; Volume Sentiment: Buyers, 1.38:1), $25.68 (Volume Sentiment: Buyers, 1.38:1) & $25.45/share (Volume Sentiment: Buyers, 1.38:1) price levels, with resistance at the $26.48 (Volume Sentiment: Buyers, 2.5:1), $26.68 (Volume Sentiment: Buyers, 2.5:1), $27.23 (Volume Sentiment: ) & $27.66 (52-Week High; Volume Sentiment: Sellers, 1.25:1) price levels.
SMH, the VanEck Vectors Semiconductors ETF has climbed +56.07% over the past year, notching an impressive +73.66% since their 52-week low in October of 2022 (ex-distributions).
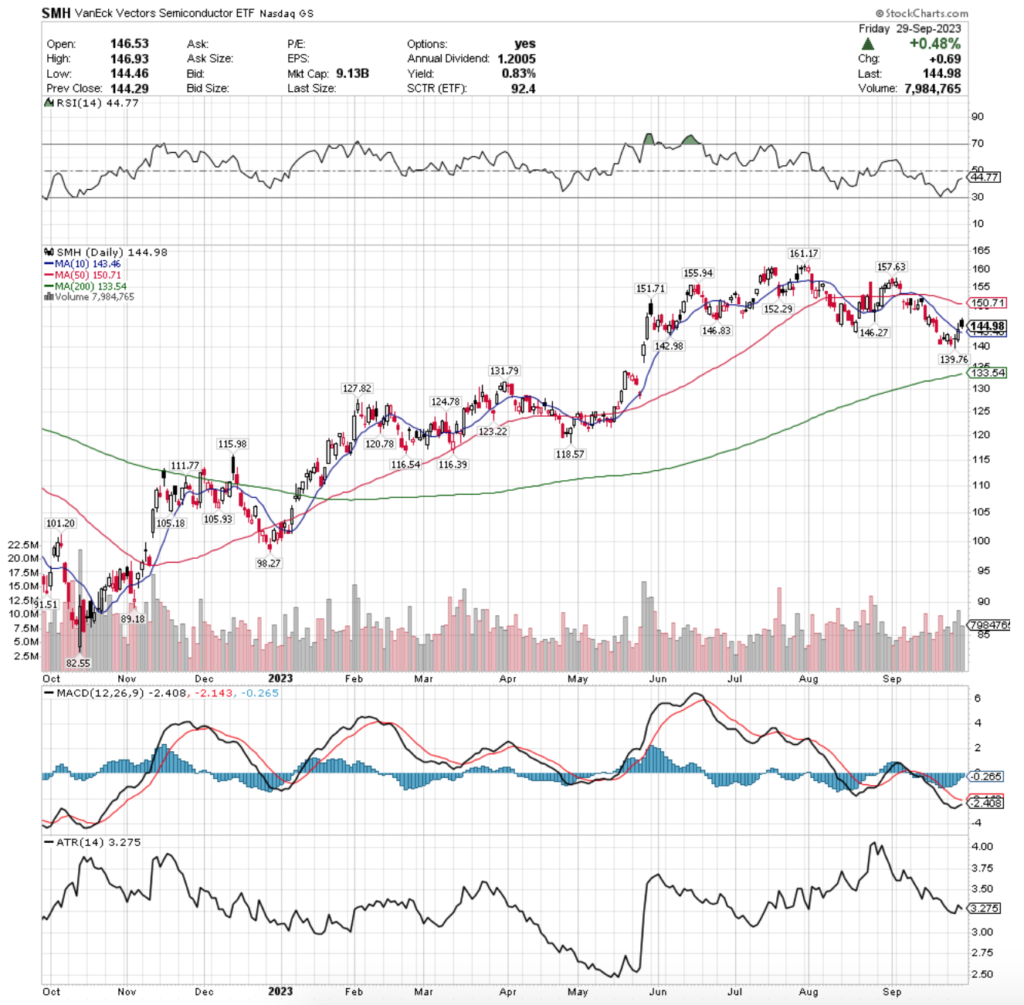
Their RSI is trending back towards neutral at 44.77 after being near oversold earlier in September, while their MACD is bearish but looking primed to attempt a break at a bullish crossover in the coming few days.
Volumes were +5.2% higher than average compared to the year prior this past week, as investors were ready to slow the bleeding of the past month & began to buy back into SMH.
Monday kicked the week off on a bullish note, but Tuesday the declines resumed as prices were stuck in a tight range that began last Thursday.
Wednesday saw a spark of skeptical optimism as the session closed in a dragonfly doji, enabling Thursday’s session to break upward & test the resistance of the 10 day moving average, which it was able to close above & its upper shadow signaled that there was appetite for higher prices.
Friday’s candlestick paints a bearish picture for next week however, as despite the day gaining +0.48%, the price closed lower than the open & while the candle was not a proper shaped spinning top, the shadows & body all signal a tight range, mostly due to the threat of a government shutdown fears.
SMH provides a 0.83% distribution yield for long-term investors, which is not much in terms of protection against declines, so a hedging strategy would be appropriate for any existing positions in the near-term, especially as we see how strong the support of the 10 day moving average will be in the coming week.
Their Average True Range sits currently right about at its mean, signaling that they will likely move at the will of the major indexes in the coming weeks, adding to the need for protection against near-term losses as it appears as though the decline is set to continue or at the very least prices will consolidate into a range following the declines of September.
SMH has support at the $143.46 (10 Day Moving Average; Volume Sentiment: Buyers, 1.2:1), $142.98 (Volume Sentiment: Buyers, 1.2:1), $139.76 (Volume Sentiment: NULL; 0:0*) & $133.54/share (50 Day Moving Average; Volume Sentiment: Buyers, 1.6:0*) price levels, with resistance at the $146.27 (Volume Sentiment: Sellers, 1.18:1), $146.83 (Volume Sentiment: Sellers, 1.18:1), $150.71 (50 Day Moving Average; Volume Sentiment: Buyers, 2.11:1) & $151.71 (Volume Sentiment: Buyers, 2.11:1) price levels.
Mexico (MEXX), Healthcare (CURE), Utilities (VPU) & Net Lease Real Estate (NETL) Are All Bearishly Lagging The Market
MEXX, the Direxion Daily MSCI Mexico Bull 3x Shares ETF has advanced a remarkable +104.6% over the past year, including +94.01% since their 52-week low in September of 2022, however since their 52-week high in July of 2023 they have declined -33.73% (ex-distributions).
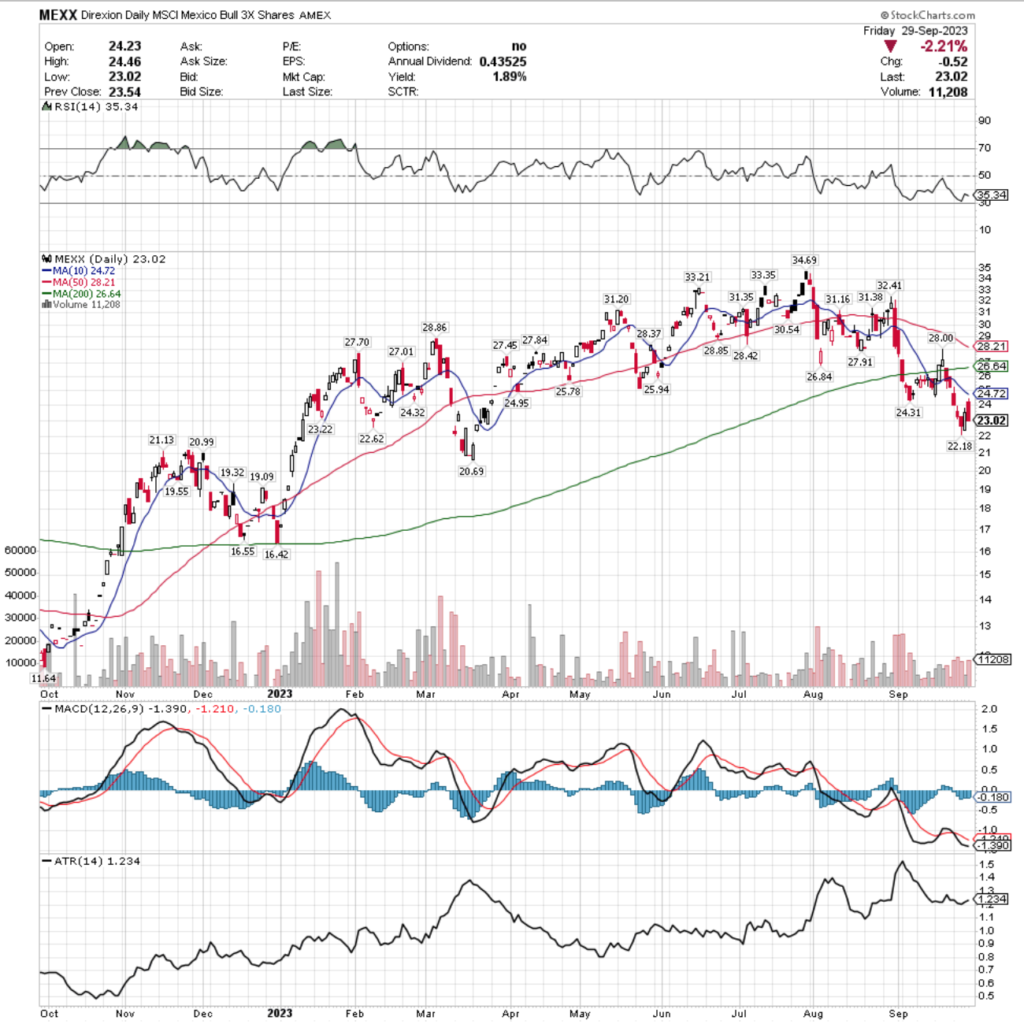
Their RSI is bouncing back from near the oversold level of 30 & currently sits at 35.34, while their MACD is still bearish but attempting to make a bullish crossover in the coming week.
Trading volumes last week were -12.75% below average compared to the year prior, signaling uncertainty among investors for MEXX.
One thing of note, the only advancing session of the week’s volume was less than half of the volume for the nearest declining day of the week, so it appears investors are still not convinced of MEXX in the near-term, but the selling pressure is beginning to ease, or most of the folks who wanted to get out of the pool since their 52-week high have done so.
Monday kicked the week off with a declining session on a gap down where the upper shadow signals there was an attempt to break higher, but the close near the $24 mark shows that sentiment waned near immediately & the bears still have control.
Tuesday the declines continued until Wednesday’s session’s hammer candle was able to stop the bleeding & force prices higher on Thursday.
Thursday’s gains though should be viewed skeptically, as the low volume does not express a change in investor sentiment.
Friday attempted to open higher & continue the run, but shutdown fears forced a risk off environment that led to the day’s decline of -2.21%.
MEXX offers a 1.89% distribution yield for long-term shareholders, but this only provides so much cushion against losses & a hedging strategy in the near-term would be advised.
MEXX has support at the $22.62 (Volume Sentiment: Sellers, 1.5:1), $22.18 (Volume Sentiment: Sellers, 1.5:1), $21.13 (Volume Sentiment: Buyers, 1.2:1) & $20.99/share (Volume Sentiment: Buyers, 1.48:1) price levels, with resistance at the $23.22 (Volume Sentiment: Sellers, 1.44:1), $24.31/2 (2 Touch-Points; Volume Sentiment: Buyers, 1.28:1), $24.72 (10 Day Moving Average; Volume Sentiment: Buyers, 1.28:1) & $24.95 (Volume Sentiment: Buyers, 1.28:1) price levels.
CURE, the Direxion Daily Healthcare Bull 3x Shares ETF has nudged forward +2.5% over the past year, including a +9% gain since their 52-week low in October of 2022, but has dropped -31.94% from their 52-week high in December of 2022 (ex-distributions).
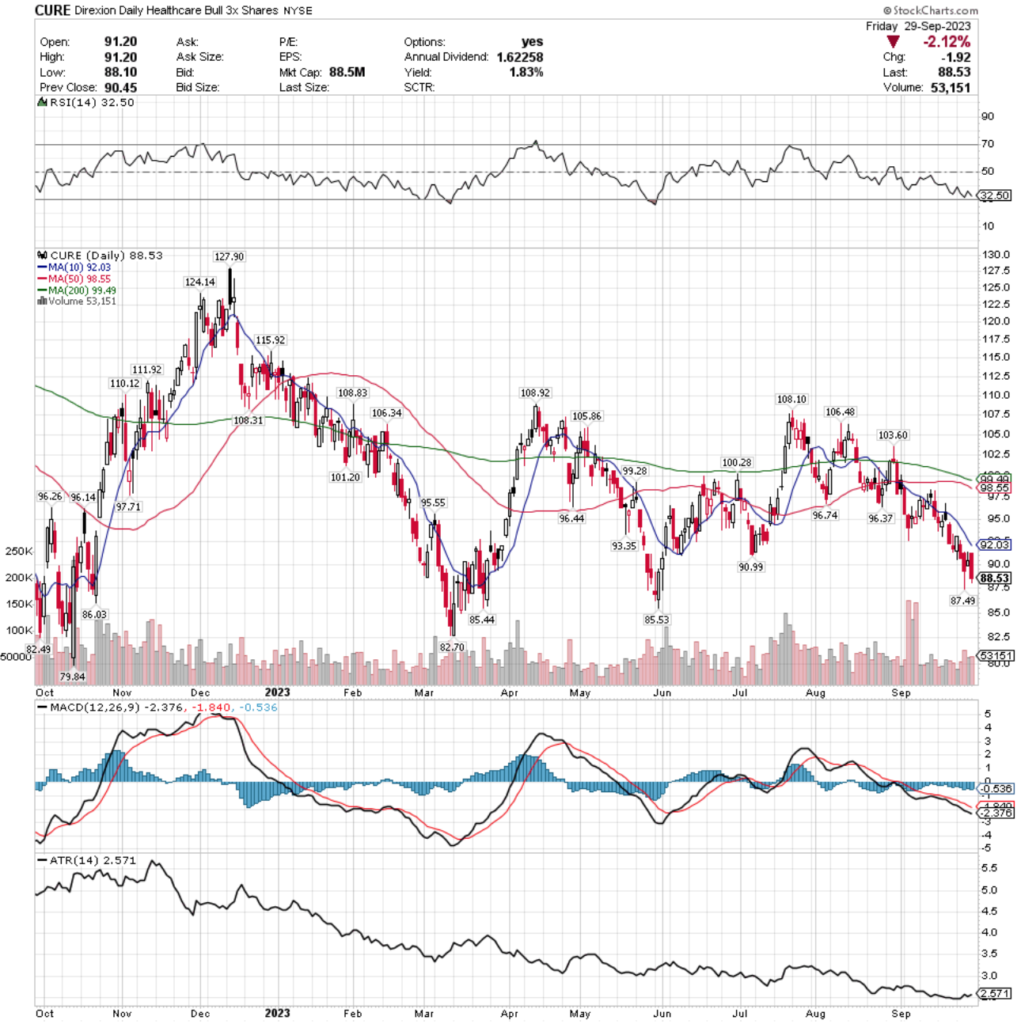
Their RSI is trending towards oversold & sits at 32.5, while their MACD trends further bearishly.
Last week’s trading volume was -17.55% below average compared to the year prior, indicating that many investors who wanted to sell may have unloaded their shares following a month-long decline, but the lack of meaningful advancing volume does not indicate that the pain is over just yet.
Monday opened on a bullish note, before Tuesday & Wednesday featured more declines, with Wednesday’s wide-range session seeing the most volume, which given the length of the lower shadow on the candle has further bearish implications in the near-term.
Thursday’s shooting star narrowly missed creating a harami pattern as its upper shadow broke over the day prior’s range, but the light volume was not enough to push other bulls back into new positions, leading to the further declines seen on Friday.
CURE offers a 1.83% distribution yield, which does not provide much protection from losses, making it worth considering hedging options for existing positions that do not want to be closed.
Their ATR suggests that there may be a brief consolidation & cool down in the coming week, following a month of losses, which will make it important to keep an eye on the resistance that the 10 day moving average is providing throughout the week to see how prices behave in relation to it.
CURE has support at the $87.49 (Volume Sentiment: Sellers, 0.5:0*), $86.03 (Volume Sentiment: Sellers, 3.3:0*), $85.53 (Volume Sentiment: Buyers, 1.22:1) & $85.44/share (Volume Sentiment: Buyers, 1.22:1) price levels, with resistance at the $90.99 (Volume Sentiment: Buyers, 2.07:1), $92.03 (10 Day Moving Average; Volume Sentiment: Sellers, 11:1), $93.35 (Volume Sentiment: Buyers, 2:1) & $95.55/share (Volume Sentiment: Sellers, 1.6:1) price levels.
VPU, the Vanguard Utilities ETF has fallen -9.08% over the past year, declining -20.64% from their 52-week high in December of 2022, while reclaiming +0.62% since their 52-week low in September of 2023 (ex-distributions).
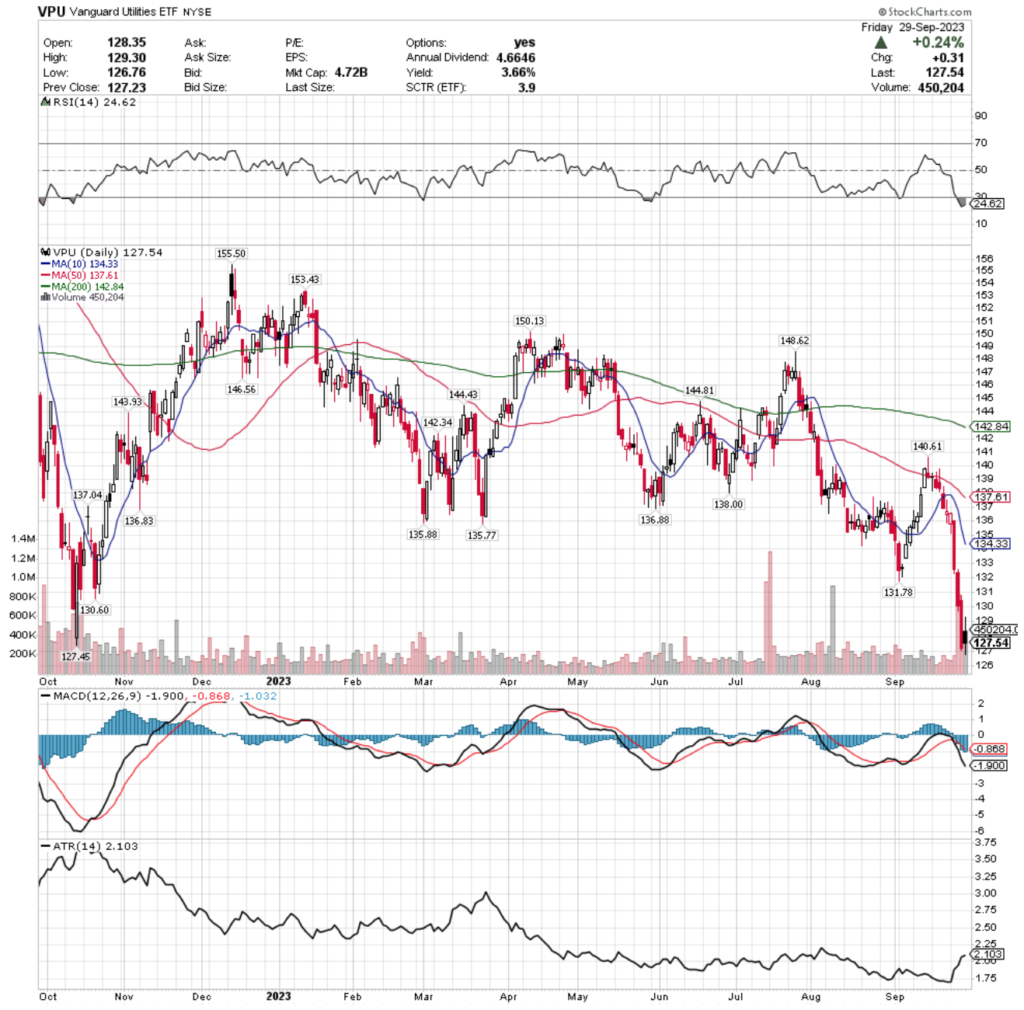
Their RSI is oversold at 24.62 & their MACD is still in bearish decline.
Volumes last week were +65.02% above average compared to the year prior, mostly due tot he declining sessions of Wednesday & Thursday, as well as the attempted recovery in Friday’s session.
VPU is near its 52-week low, following a ~-6.22% decline during the week, where Friday’s session was able to slow the bleeding, but also did not finish with future bullish implications.
While the day closed +0.24%, the session’s close was below its open & the lower shadow of the day’s candle went lower than the low of Thursday, signaling that market participants are still not ready to turn bullish on VPU.
While they offer a 3.66% distribution yield to long-term holders, this does not look like a safe time to enter a position & existing positions would benefit from a hedging strategy put in place while market participants establish where they value VPU.
Their ATR signals that there may be a consolidation in the near-term, but does not signal that the losses will be over anytime soon.
VPU has support at the $127.45/share (52-Week Low; Volume Sentiment: Buyers, 3:1) price level, with resistance at the $130.60 (Volume Sentiment: Sellers, 1.25:1 ), $131.78 (Volume Sentiment: Sellers, 1.25:1), $134.33 (10 Day Moving Average; Volume Sentiment: Sellers, 1.2:1) & $135.77/share (Volume Sentiment: Sellers, 1.2:1) price levels.
NETL, the Fundamental Income Net Lease ETF has dipped -0.99% over the past year, losing -22.53% from their 52-week high in February of 2023 & regaining +1.52% since their 52-week low in September of 2023 (ex-distributions).
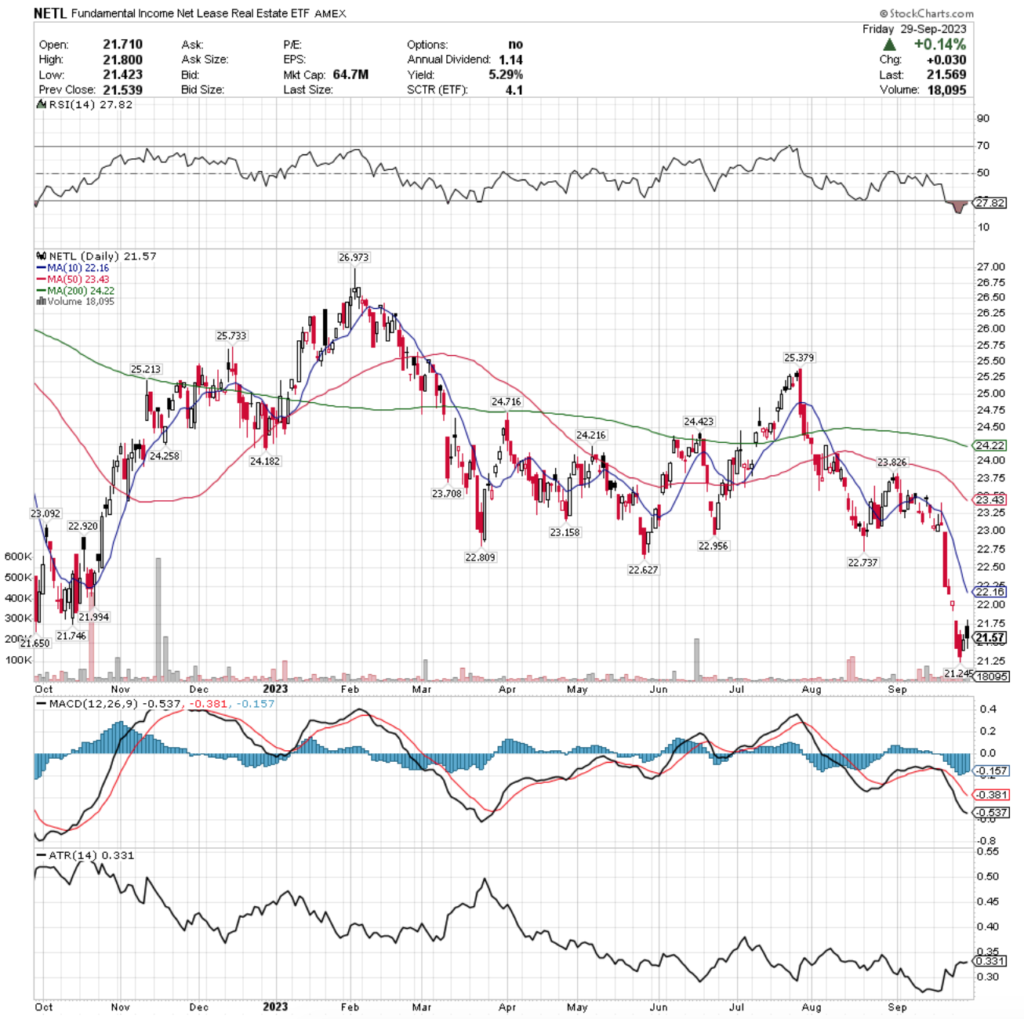
Their RSI is oversold at 27.82, with a MACD that is beginning to curl bullishly, but is a long way from making a bullish crossover.
Volumes last week were -24.05% below average compared to the year prior, indicating that market participants are not feeling particularly optimistic about NETL at this time.
Monday the week kicked off on a sour note, with a gap down session that was able to reclaim some of the open’s losses with a slightly higher close, but bad feelings were in the air.
Tuesday it continued with another gap down session that covered a wide price range before Wednesday’s declines set the floor in for the rest of the week.
Thursday attempted an advance, but resulted in a harami pattern & set the stage for Friday’s slightly up session that closed lower than it opened, and also featured a longer lower shadow than upper, indicating that investors are still very much on the fence about the near-term value of NETL.
NETL offers a 5.29% distribution yield, which provides some protection against losses, but is still not enough to warrant an entry to a new position at this time & hedging options should be explored for any existing positions, especially as they are just off of their 52-week low.
NETL has support at the $21.24/share (52-Week Low; Volume Sentiment: Sellers, 1.5:1) price level, with resistance at the $21.65 (Volume Sentiment: Sellers, 1.5:1), $21.75 (Volume Sentiment: Sellers, 1.5:1), $21.99 (Volume Sentiment: Sellers, 1.5:1) & $22.16/share (10 Day Moving Average; Volume Sentiment: Sellers, 1.76:1) price levels.
The Week Ahead
Monday starts the week off with ISM Manufacturing & Construction Spending data both at 10 am.
There are no major earnings reports scheduled for Monday.
Job Openings Data is released at 10 am on Tuesday, with McCormick & Company & Cal-Maine Foods due to report earnings.
Wednesday starts with ADP Employment data at 8:15 am, followed by Factory Orders & ISM Services data at 10 am.
AngioDynamics, Helen of Troy, Resources Connection, RPM & Tilray are all due to report earnings on Wednesday.
Initial Jobless Claims & the U.S. Trade Deficit data are set to be reported at 8:30 am on Thursday.
Lamb Weston, Conagra, Constellation Brands & Levi Strauss are all scheduled to report earnings on Thursday.
Friday the week winds down with the U.S. Employment Report, U.S. Employment Rate, U.S. Hourly Wages & Hourly Wages Year-over-Year at 8:30 am before Consumer Credit data is reported at 3 pm & there are no noteworthy earnings reports scheduled for the day.
See you back here next week!
*** I DO NOT OWN SHARES OR OPTIONS CONTRACT POSITIONS IN SPY, QQQ, IWM, DIA, URA, DIG, FCG, SMH, MEXX, CURE, VPU, or NETL AT THE TIME OF PUBLISHING THIS ARTICLE ***