Microsoft Corp. stock trades under the ticker MSFT & has had an excellent past year, advancing +53.32% (ex-dividends).
They currently sit -3.07% below their 52-week high (November 2023) & have climbed +69.83% since their 52-week low from January of 2023.
While this close to their 52-week high & with broader markets looking as stretched thin as they do, it’s a good time to analyze how market participants have behaved at each price level that they have traded at over the past couple of years.
The article below will outline a brief technical analysis of MSFT stock, with a price level:volume sentiment analysis.
Technical Analysis Of Microsoft Corp. MSFT Stock
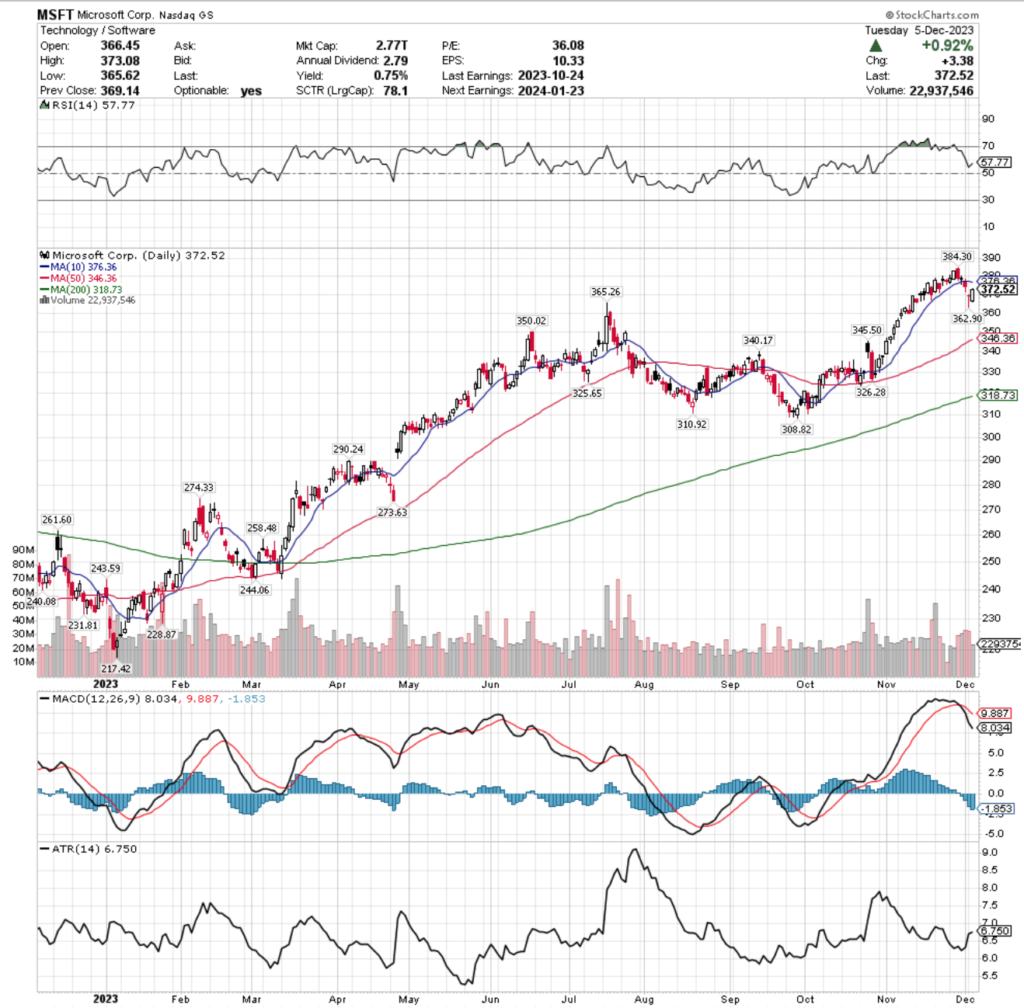
After hitting a fresh 52-week high a week & a half ago, MSFT stock has seen folks taking profits off of the table, which has led to their RSI retreating back towards neutral from the overbought range it was in & it now sits at 57.77.
Their MACD has accordingly been bearish for the past week,with the support of the 10 day moving average being broken through on last Thursday’s declining session.
Volumes over the past week (including yesterday) have still been +5.8% above average compared to the year prior (29,527,480 vs. 27,909,797.61), which is worth noting after a week where SPY’s volumes were -23.93% below average, QQQ’s volumes were -31.47% below average, IWM’s volumes were +11.49% above average & DIA’s volumes were -8.7% below average (all compared to the year prior).
This is worth noting as the major indexes are clearly running out of steam & enthusiasm & while MSFT is still trading with above average volume, in the last two weeks it has primarily been dominated by the bears, as profits have been taken.
Over the past week, only last Wednesday’s bullish session’s volume has been noteworthy (for bullish volume), which resulted in a candle that would be characterized as a hanging man with a lower close than open (but still bullish session), except for the fact that the day prior’s bearish session was the establishment of the new 52-week high.
As noted above, it will be important to keep an eye on the resistance that their 10 DMA is now providing on price action & how it fares in relation to the support levels between the price & the 50 DMA, which will continue to move upwards as time passes along.
Another key area to look at is the emergence of a bearish head & shoulders pattern emerging, with the head being the 52-week high set last week & the left shoulder being either formed in July or June of 2023 (5-6 months back).
The moving averages will likely be what helps extend a consolidation range to fulfill the H&S pattern (should it play out), as the 200 DMA is currently approaching the previous consolidation ranges that led into the run up to the 52-week high from the left shoulder(s).
Friday’s candlestick is also telling, as it resulted in a dragonfly doji on a gap down session & set the stage for Monday’s session to be bullish & fill in the window created by the gap (dead cat bounce).
With such poor volume in terms of seller volume to buyer volume, more declines appear to be on the near-term horizon.
MSFT stock’s Average True Range is also flashing warning lights, with yesterday’s bullish session flattening out the indicator line, after the declining sessions prior showed it returning back to its mean.
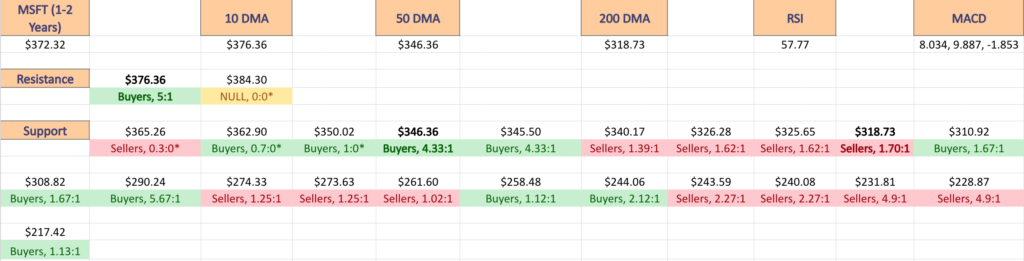
While they have multiple support touch-points from their previous consolidation range noted above, it is important now to see how strong each of those price levels have been historically.
Below is the Buyers:Sellers (and vice-versa) ratio for the price levels that MSFT stock has traded at over the past 1-2 years & can serve as a guide to how strong/weak each of the support levels (& resistance levels) may be in the near-term, based on the behavior of market participants in the recent past.
It should be read as a barometer reading (not a thermometer), as while history does not repeat itself, it does often rhyme.
Microsoft Corp. MSFT Price Level:Volume Sentiment

$388 – NULL – 0:0*; +4.21% From Current Price Level
$384 – NULL – 0:0*; +3.14% From Current Price Level
$380 – Buyers – 0.4:0*; +2.06% From Current Price Level
$376 – Buyers – 5:1; +0.99% From Current Price Level – 10 Day Moving Average*
$372 – Sellers – 2.3:0*; -0.09% From Current Price Level – Current Price Box*
$368 – Buyers – 1.36:1; -1.16% From Current Price Level
$364 – Sellers – 0.3:0*; -2.23% From Current Price Level
$360 -Buyers – 0.7:0*; -3.31% From Current Price Level
$356 – Buyers – 3.33:1; -4.38% From Current Price Level
$352 – Buyers – 1.22:1; -5.46% From Current Price Level
$348 – Buyers – 1:0*; -6.53% From Current Price Level
$344 – Buyers – 4.33:1; -7.61% From Current Price Level – 50 Day Moving Average*
$340 – Sellers – 1.39:1; -8.68% From Current Price Level
$336 – Buyers – 2.81:1; -9.76% From Current Price Level
$332 – Buyers – 1.65:1; -10.83% From Current Price Level
$328 – Buyer s- 1.24:1; -11.9% From Current Price Level
$324 – Sellers – 1.62:1; -12.98% From Current Price Level
$320 – Buyers – 1.57:1; -14.05% From Current Price Level
$316 – Sellers – 1.70:1; -15.13% From Current Price Level – 200 Day Moving Average*
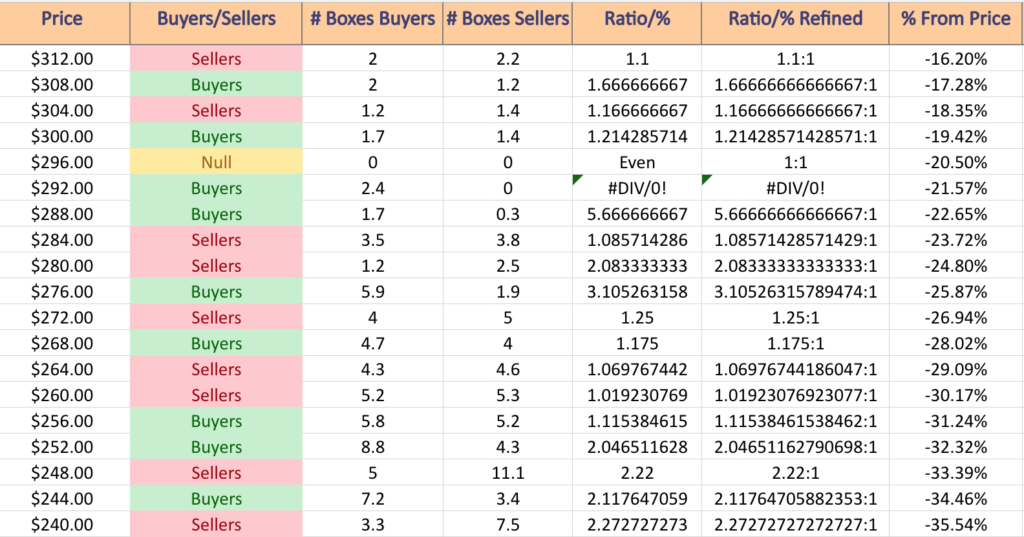
$312 – Sellers – 1.1:1; -16.2% From Current Price Level
$308 – Buyers – 1.67:1; -17.28% From Current Price Level
$304 – Sellers – 1.17:1; -18.35% From Current Price Level
$300 – Buyers – 1.21:1; -19.42% From Current Price Level
$296 – NULL – 0:0*; -20.5% From Current Price Level
$292 – Buyers – 2.4:0*; -21.57% From Current Price Level
$288 – Buyers – 5.67:1; -22.65% From Current Price Level
$284 – Sellers – 1.09:1; -23.72% From Current Price Level
$280 – Sellers – 2.08:1; -24.8% From Current Price Level
$276 – Buyers – 3.11:1; -25.87% From Current Price Level
$272 – Sellers – 1.25:1; -26.94% From Current Price Level
$268 – Buyers – 1.18:1; -28.02% From Current Price Level
$264 – Sellers – 1.07:1; -29.09% From Current Price Level
$260 – Sellers – 1.02:1; -30.17% From Current Price Level
$256 – Buyers – 1.12:1; -31.24% From Current Price Level
$252 – Buyers – 2.05:1; -32.32% From Current Price Level
$248 – Sellers – 2.22:1; -33.39% From Current Price Level
$244 – Buyers – 2.12:1; -34.46% From Current Price Level
$240 – Sellers – 2.27:1; -35.54% From Current Price Level
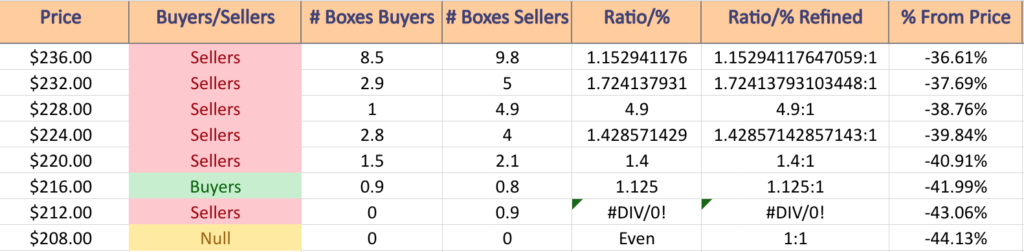
$236 – Sellers – 1.15:1; -36.61% From Current Price Level
$232 – Sellers – 1.72:1; -37.69% From Current Price Level
$228 – Sellers – 4.9:1; -38.76% From Current Price Level
$224 – Sellers – 1.43:1; -39.84% From Current Price Level
$220 – Sellers – 1.4:1; -40.91% From Current Price Level
$216 – Buyers – 1.13:1; -41.99% From Current Price Level
$212 – Sellers – 0.9:0*; -43.06% From Current Price Level
$208 – NULL – 0:0*; -44.13% From Current Price Level