SPY, the SPDR S&P 500 ETF declined -1.07% last week, in a week that was marked by jumpy gaps that resulted in prices settling just above the 10 day moving average.
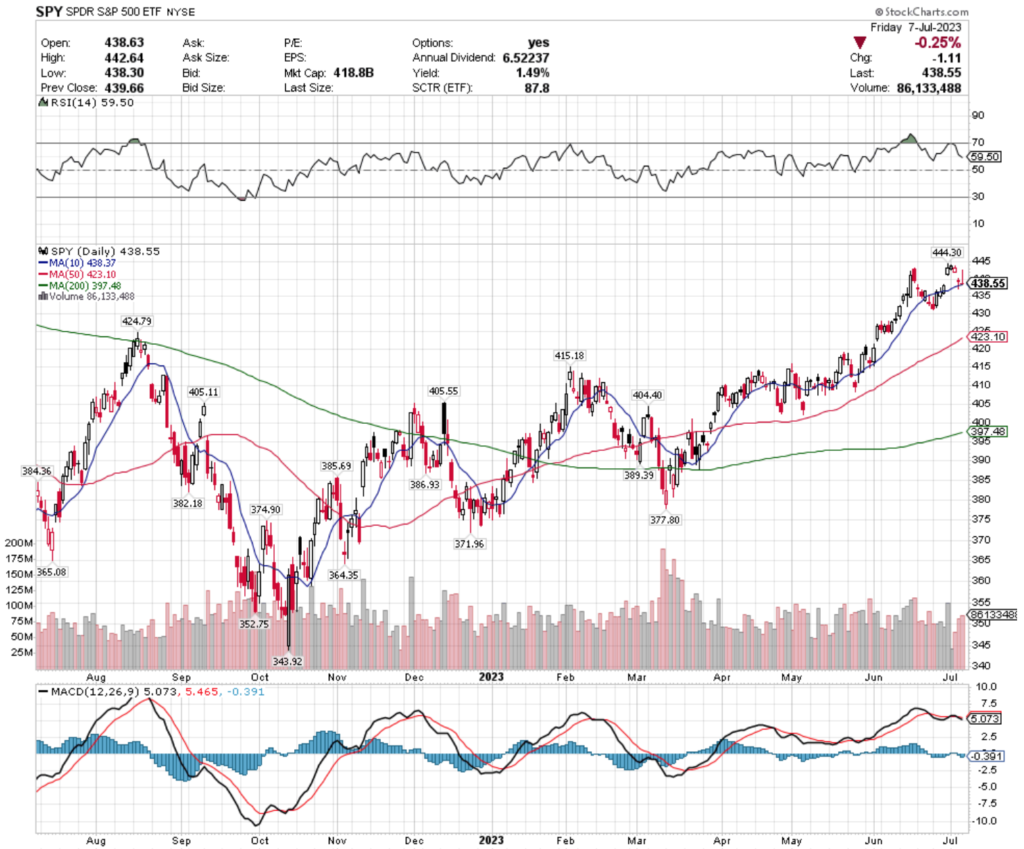
Their RSI is retreating from overbought territory & currently at 59.5 & their MACD is bearishly falling.
Sessions from early last week were on below average volume compared to the year prior, with the end of the week’s volume levels returning more to about average, which could be a sign of indecisiveness among investors, or just less people trading during the holiday week.
Monday’s spinning top candle ultimately set the tone for the rest of the week declining, after the previous Friday’s session’s gap up.
Thursday’s gap down began a new price range, but Friday’s gravestone doji signals that more declines are on the near-term horizon & suggests a lack of confidence in current price levels among investors.
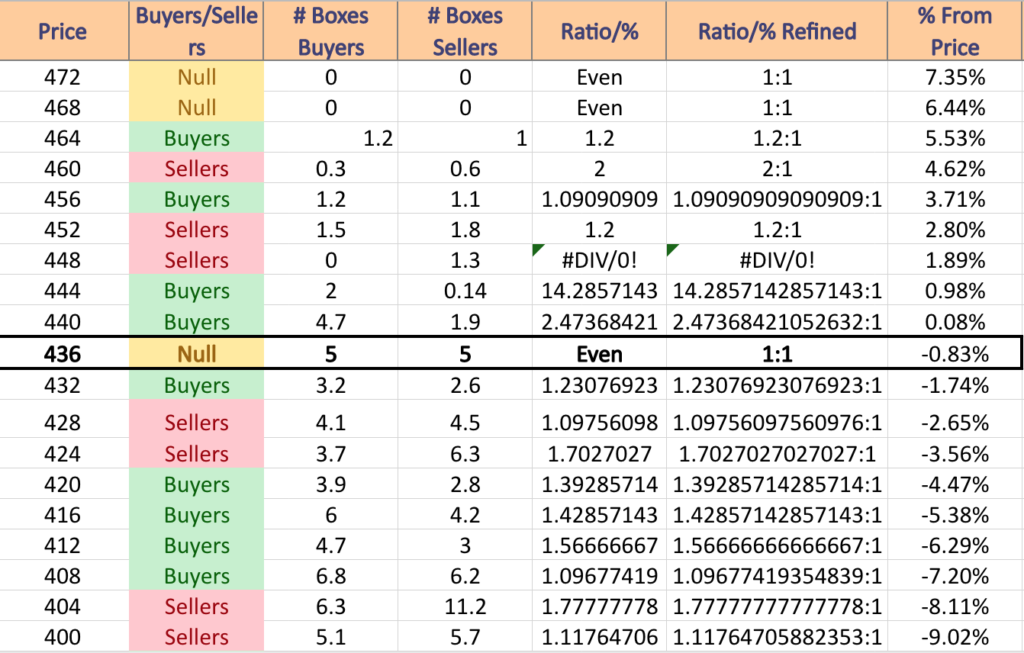
SPY has support at the $438.37 (10 Day Moving Average; Volume Sentiment: Even, 1:1), $424.79 (Volume Sentiment: Sellers, 1.70:1), $423.10 ( 50 Day Moving Average; Volume Sentiment: Buyers, 1.39:1) & $415.18/share (Volume Sentiment: Buyers, 1.57:1), with resistance at the $444.30 (Volume Sentiment: Buyers, 14.29:1), $447.43 (Volume Sentiment: Buyers, 14.29:1), $452.69 (Volume Sentiment: Sellers, 1.2:1) & $460.87/share (Volume Sentiment: Sellers, 2:1).
QQQ, the Invesco QQQ Trust ETF fell -0.86% last week, as the NASDAQ performed strongest of all of the major indexes.
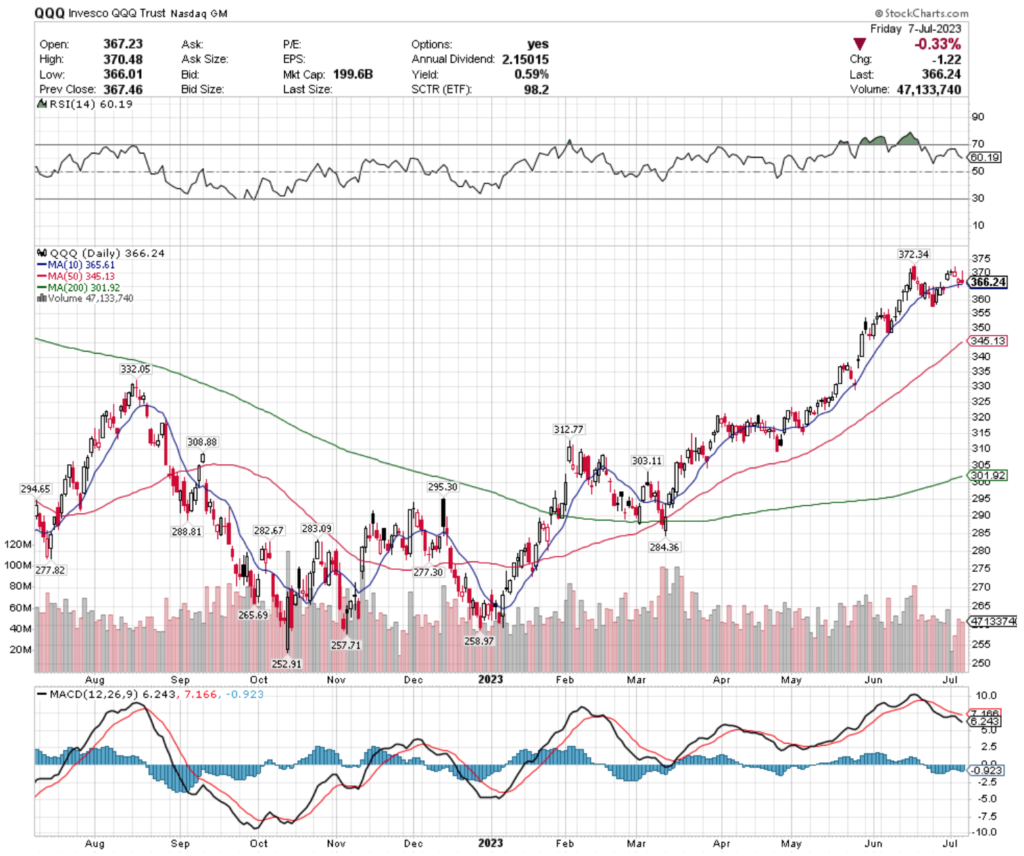
Their RSI is on the oversold end of neutral at 60.19, while their MACD is bearish.
Overall, volumes were below average last week compared to the year prior, as there is a lot of uncertainty about the Federal Reserve’s course of interest rate hikes, which will impact the tech-heavy NASDAQ more than most stocks.
Monday’s doji followed by Wednesday’s shooting star candlestick show that the near-term sentiment among investors & traders is more bearish, with Thursday & Friday’s price action mostly opening & closing around the exact same price levels, being supported by the 10 day moving average.
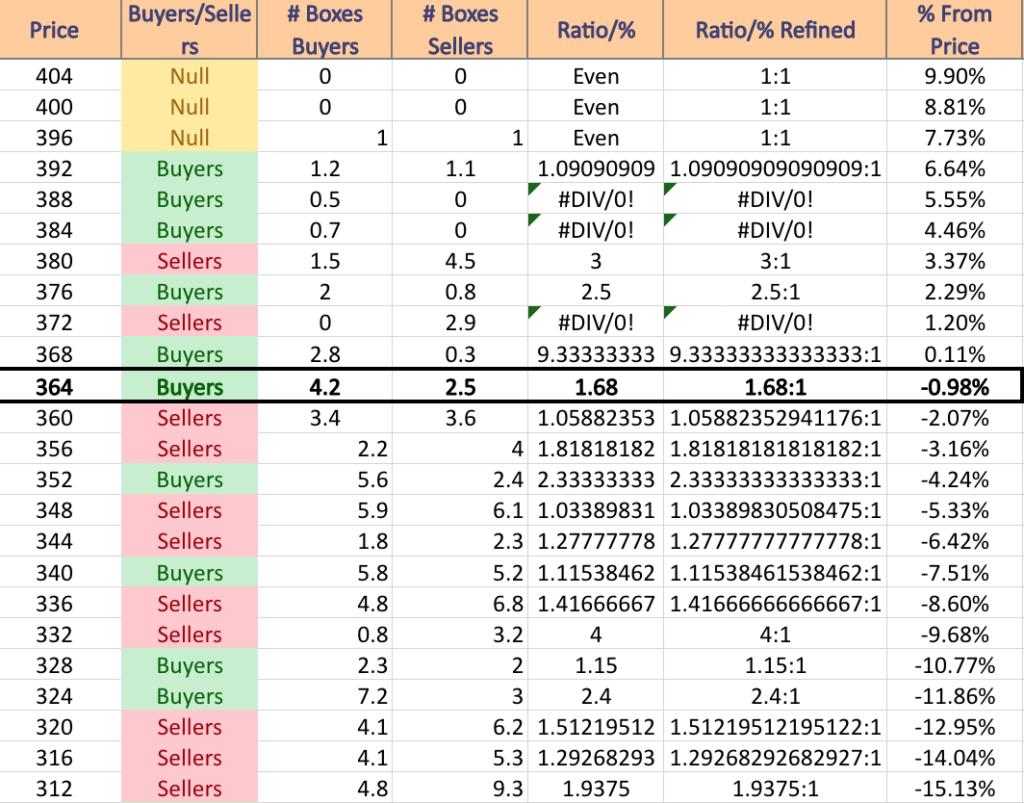
QQQ has support at the $365.61 (10 Day Moving Average; Volume Sentiment: Buyers, 1.68:1), $345.13 (50 Day Moving Average; Volume Sentiment: Sellers, 1.28:1), $332.05 (Volume Sentiment: Sellers, 4:1) & $312.77/share (Volume Sentiment: Sellers, 1.94:1), with resistance at the $372.34 (Volume Sentiment: Sellers, 2.9:0*), $374.55 (Volume Sentiment: Sellers, 2.9:0*), $377.90 (Volume Sentiment: Buyers, 2.5:1) & $400.45/share (Volume Sentiment: NULL, 0:0*).
IWM, the iShares Russell 2000 ETF dropped -1.37% last week, as investors were selling smaller cap names.
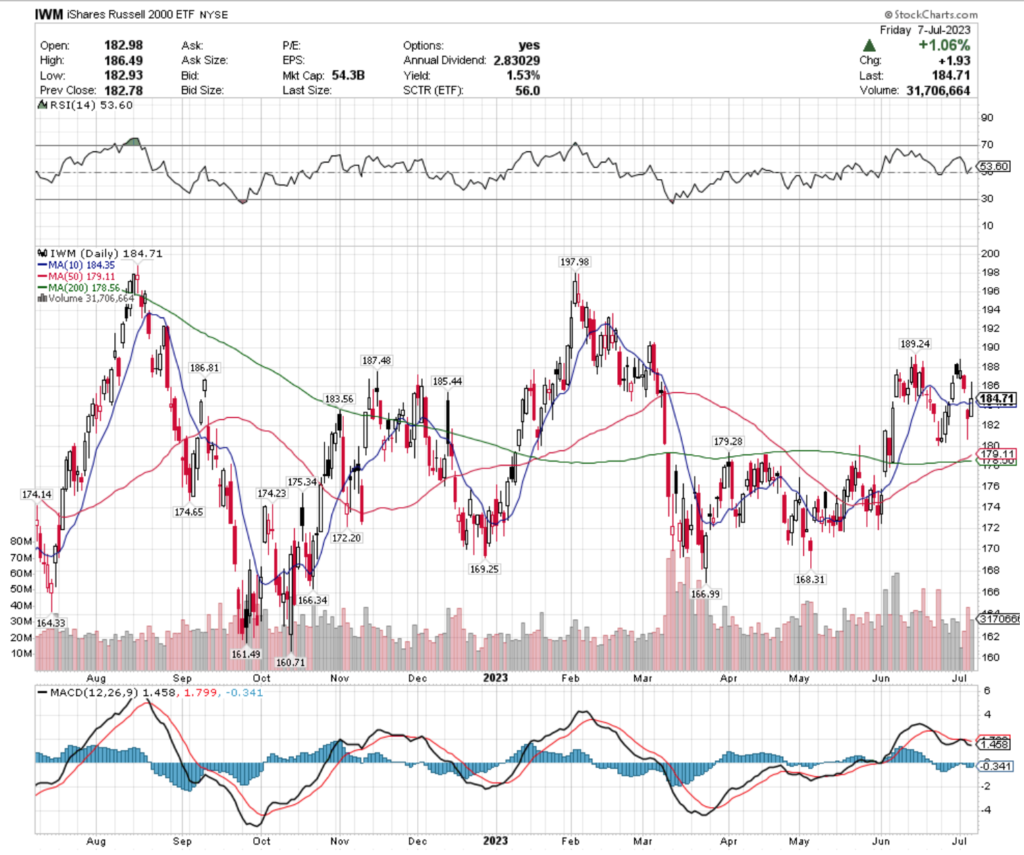
Their RSI is about neutral at 53.6, but their MACD is currently giving bearish signals.
Monday & Wednesday’s sessions had below average volumes compared to the year prior, but the end of the week’s levels returned to about average.
Monday kicked the week off with a shooting star candlestick to set the tone off as bearish for the week, leading to Thursday’s large gap down session that tested price levels well below the range that the open & closing prices occurred in.
Friday attempted to reclaim the window’s range created by Thursday’s gap, but was ultimately won by the bears who kept prices to the lower half of the day’s candle & below the prior Thursday’s candle, indicating sentiment is still widely bearish.
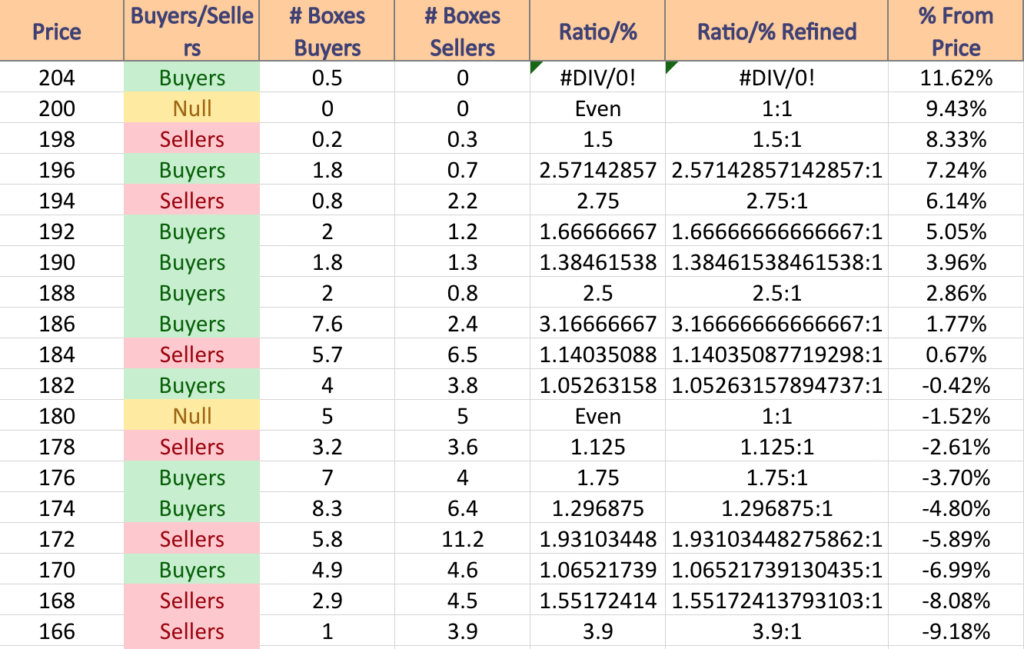
IWM has support at the $184.35 (Volume Sentiment: Sellers, 1.14:1), $183.56 (Volume Sentiment: Buyers, 1.05:1), $179.28 (Volume Sentiment: Sellers, 1.13:1) & $179.11/share (50 Day Moving Average; Volume Sentiment: Sellers, 1.13:1), with resistance at the $187.48 (Volume Sentiment: Buyers, 3.17:1), $189.24 (Volume Sentiment: Buyers, 2.5:1), $197.98 (Volume Sentiment: Buyers, 2.57:1) & $198.74/share (Volume Sentiment: Sellers, 1.5:1) price levels.
DIA, the SPDR Dow Jones Industrial Average ETF lost -1.87% last week, as even the largest companies were not immune against the selling pressure across the overall market.
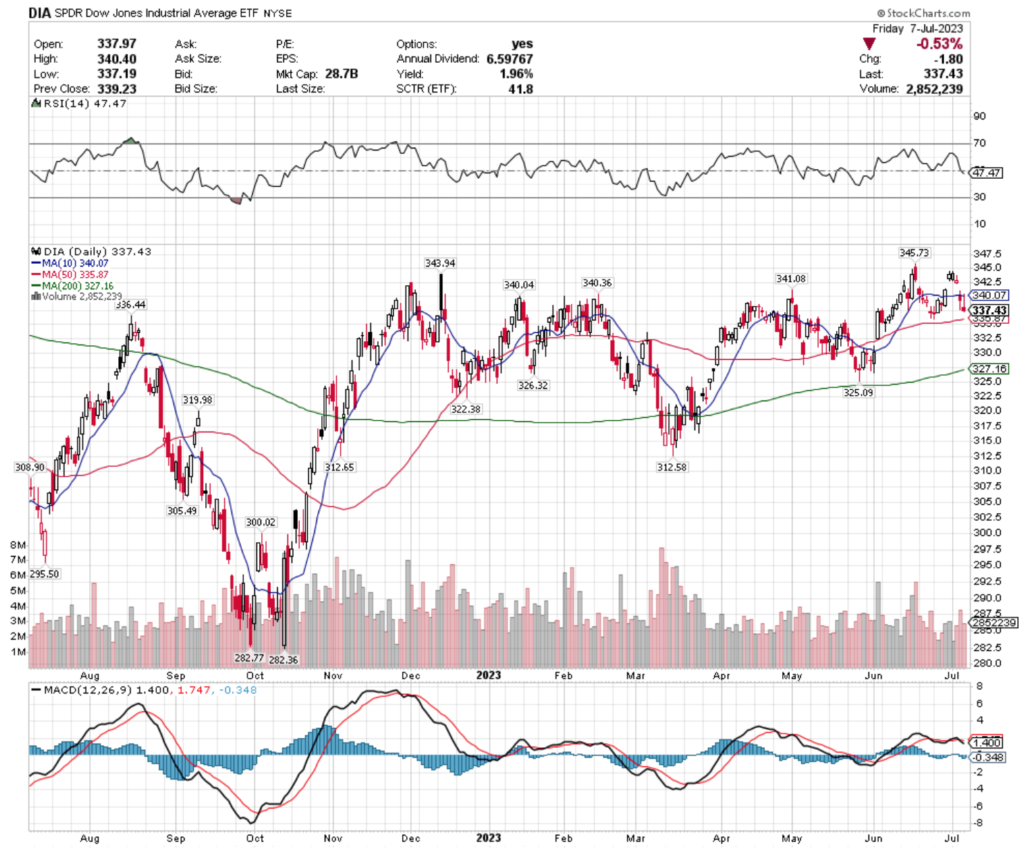
Their RSI is about neutral at 47.47, but their MACD is also signaling impending bearishness.
Thursday had the week’s strongest volumes, but overall the levels were not noteworthy compared to the year prior, indicating either caution on the part of investors, or being attributable to the holiday on Tuesday.
Their 10 day moving average was not able to provide the support needed to keep prices from the declines seen on Thursday’s gap down session & Friday’s session’s open/closing prices were trending closer to the 50 day moving average.
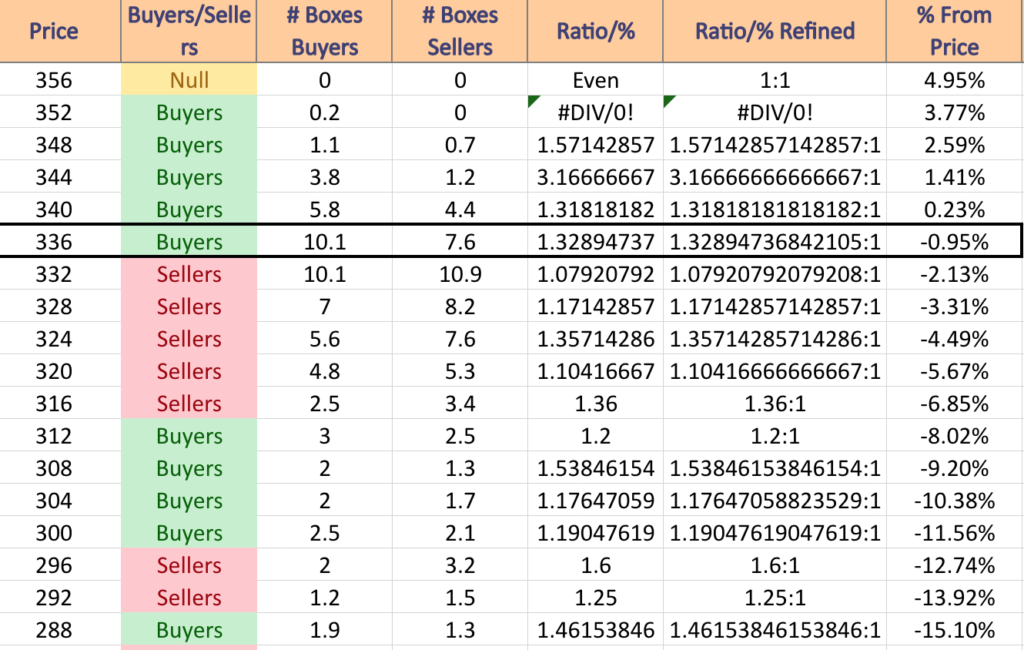
DIA has support at the $336.44 (Volume Sentiment: Buyers, 1.33:1), $335.87 (50 Day Moving Average; Volume Sentiment: Sellers, 1.08:1), $327.16 (200 Day Moving Average; Volume Sentiment: Sellers, 1.36:1) & $326.32/share (Volume Sentiment: Sellers, 1.36:1), with resistance at the $340.04 (Volume Sentiment: Buyers, 1.32:1), $340.07 (10 Day Moving Average; Volume Sentiment: Buyers, 1.32:1), $$340.46 (Volume Sentiment: Buyers, 1.32:1) & $341.08/share (Volume Sentiment: Buyers, 1.32:1) price levels.
Semiconductors (SOXL), Brazil (BRZU), Japan (DXJ) & Dynamic Oil & Gas Services (PXJ) Are All Bullishly Leading The Market
SOXL, the Direxion Daily Semiconductors Bull 3x Shares ETF has gained +79.61% over the past year, improving an astonishing +296.73% since its 52-week low in October of 2022 (ex-distributions).
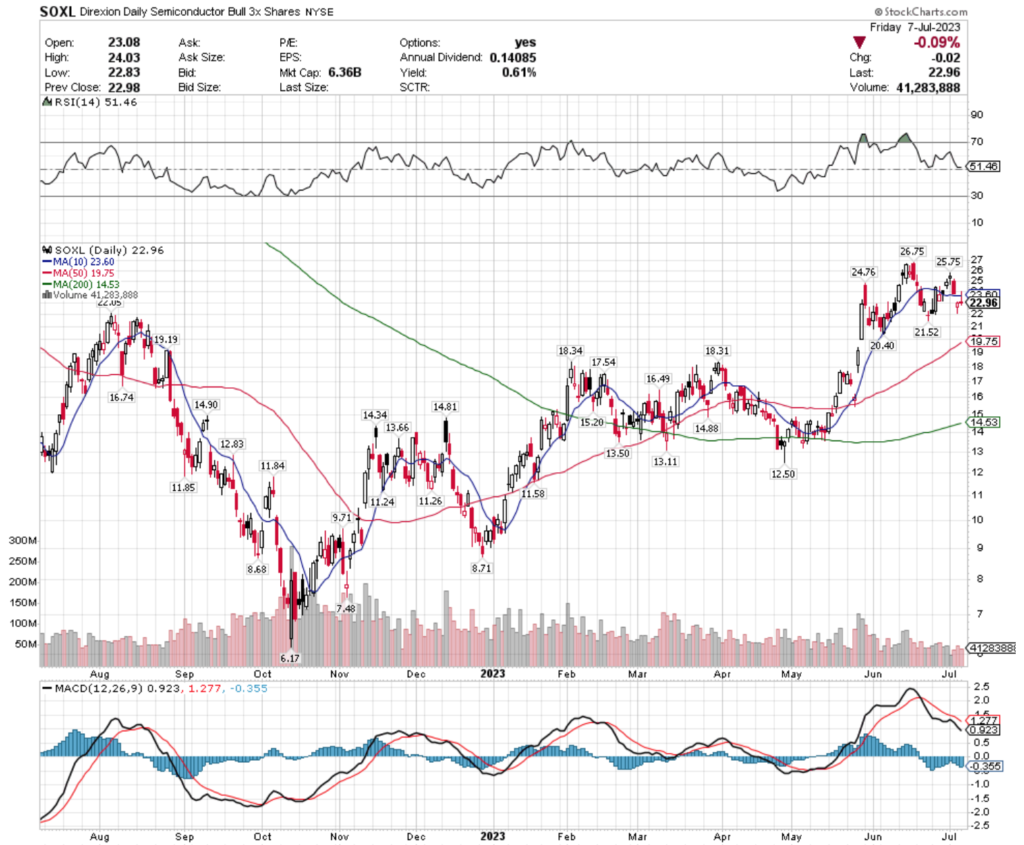
Their RSI is neutral at 51.46, but their MACD is currently in a bearish decline.
Volumes were below average compared to the year prior all week, signaling waning enthusiasm among investors & traders.
Last Monday’s session resulted in a spinning top, following another in the Friday before’s session as investors signaled uncertainty.
Thursday’s gap down couldn’t find any support from the 10 day moving average & Friday’s gravestone doji signals that there looks to be more bearish sentiment in the near-term.
SOXL pays a modest 0.61% distribution yield to long-term shareholders, which does not provide much of a cushion against losses, making it wise for holders of existing positions to have an insurance policy in place, such as selling calls or buying puts while waiting to see how their price behaves around other levels of support.
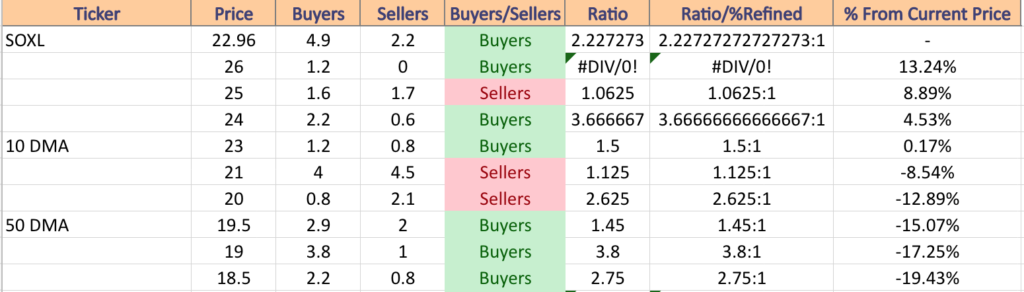
SOXL has support at the $22.05 (Volume Sentiment: Buyers, 2.23:1), $21.52 (Volume Sentiment: Sellers, 1.13:1), $20.40 (Volume Sentiment: Sellers, 2.63:1) & $19.75/share (50 Day Moving Average; Volume Sentiment: Buyers, 1.45:1), with resistance at the $23.60 (10 Day Moving Average; Volume Sentiment: Buyers, 1.5:1), $24.76 (Volume Sentiment: Buyers, 3.67:1), $25.75 (Volume Sentiment: Sellers, 1.06:1) & $26.75/share (Volume Sentiment: Buyers, 1.2:0*) price levels.
BRZU, the Direxion Daily Brazil Bull 2x Shares ETF has added +52.74% over the past year, including a 64.33% gain from their 52-week low in March of 2023 (ex-distributions).
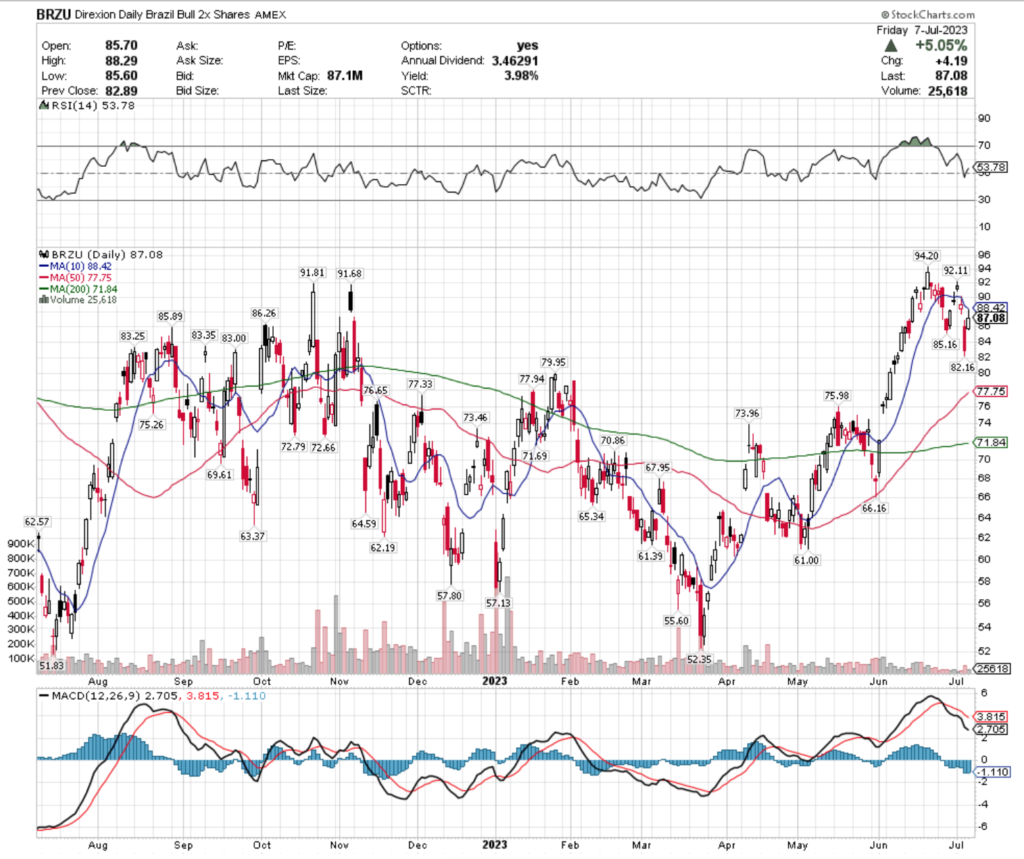
Their RSI is relatively neutral at 53.78, but their MACD is in a bearish decline following mid-June’s price correction.
Volumes have been well below average recently compared to the year prior, signaling that there is uncertainty ahead & that enthusiasm is waning among investors.
Monday & Wednesday’s sessions were spinning tops, indicating uncertainty among market participants, before Thursday’s gap down & Friday’s shooting star candle indicates that there is likely more declines on the horizon.
BRZU pays a 3.98% distribution yield to long-term shareholders, which offers some protection against losses, but as with any other name & a chart that is flashing caution, it is wise to have some form of insurance against losses in the forms of an options hedge for the coming weeks.
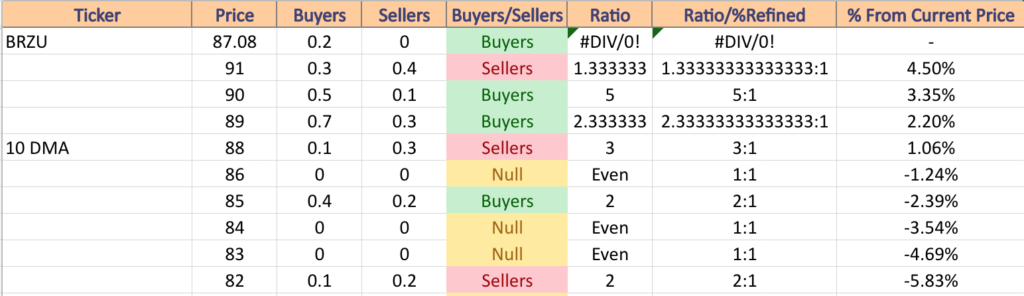
BRZU has support at the $86.26 (Volume Sentiment: NULL, 0:0*), $85.89 (Volume Sentiment: Buyers, 2:1), $85.16 (Volume Sentiment: Buyers, 2:1) & $83.35/share (Volume Sentiment: NULL, 0:0*), with resistance at the $88.42 (10 Day Moving Average; Volume Sentiment: Sellers, 3:1), $91.68 (Volume Sentiment: Sellers, 1.33:1), $91.81 (Volume Sentiment: Sellers, 1.33:1) & $92.11/share (Volume Sentiment: NULL, 0:0*) price levels.
DXJ, the WisdomTree Japan Hedged Equity Fund ETF has risen +34.56% over the past year, improving +32.88% since their 52-week low in September of 2022 (ex-distributions).
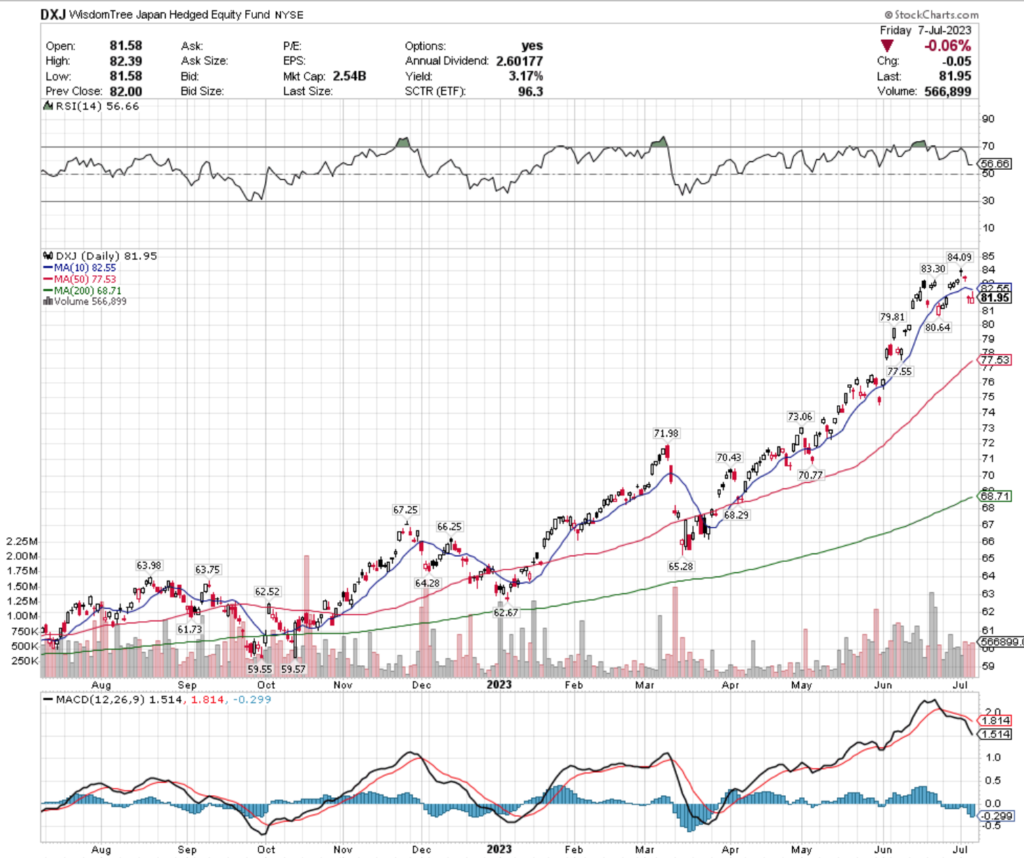
Their MACD is relatively neutral at 56.66, but their MACD is bearish, which became even steeper following Thursday’s gap down.
Volumes were roughly average compared to the year prior last week, but while there may have been conviction behind moves DXJ made, the candlesticks don’t paint the brightest of pictures for their near-term outlook.
Monday’s session resulted in a spinning top, followed by the dragonfly doji on Wednesday, a hanging man on Thursday & prices were unable to recover to the 10 day moving average on Friday, with the day’s opening & closing levels occurring at the bottom of the candle.
With bearish sentiment remaining after DXJ recently hit all time highs, it would be wisest to hedge a position against further near-term declines, as their 3.17% distribution yield will not cover against all losses.
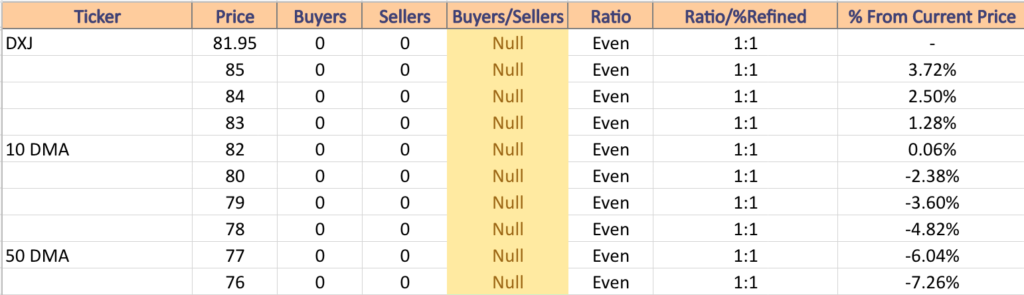
DXJ is near its all time high & has support at the $80.64 (Volume Sentiment: NULL, 0:0*), $79.81 (Volume Sentiment: NULL, 0:0*), $77.55 (Volume Sentiment: NULL, 0:0*) & $77.53/share (50 Day Moving Average; Volume Sentiment: NULL, 0:0*), with resistance at the $82.55 (10 Day Moving Average; Volume Sentiment: NULL, 0:0*), $83.30 (Volume Sentiment: NULL, 0:0*), $84.09/share (Volume Sentiment: NULL, 0:0*) price level.
PXJ, the Invesco Dynamic Oil & Gas Services ETF has gained +49.92% over the past year, with a +61.85% rebound from their 52-week low in July of 2022 (ex-distributions).
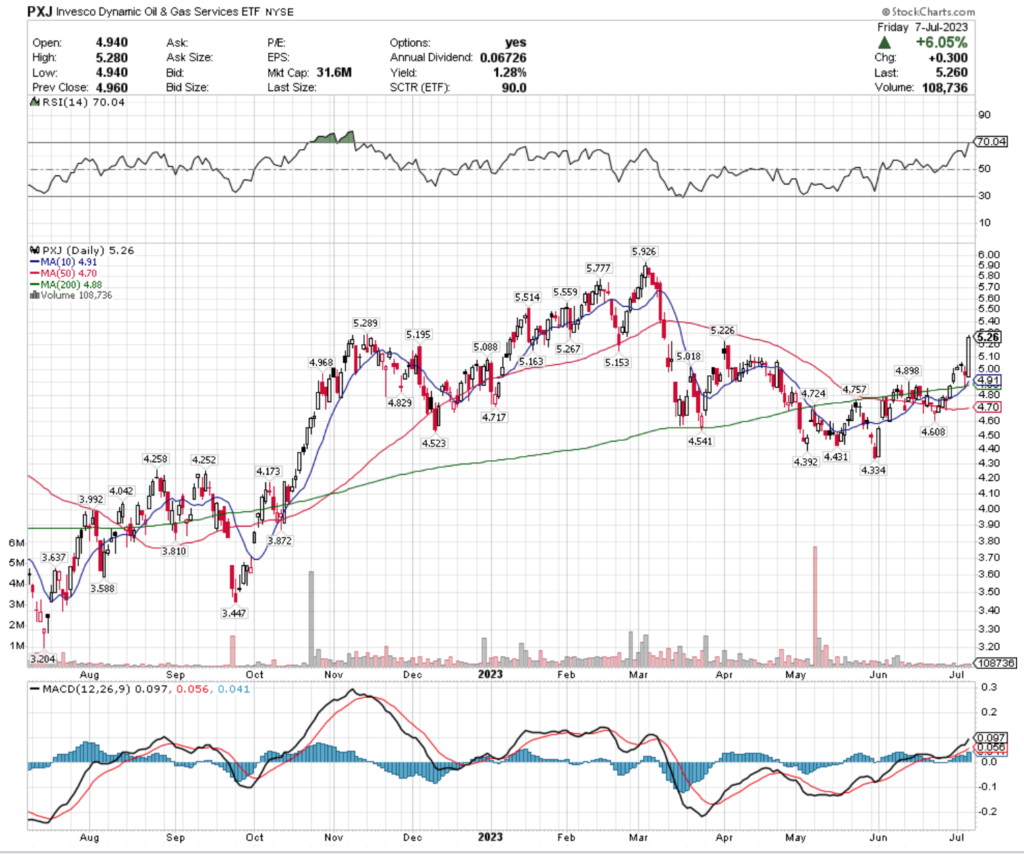
Their RSI is overbought at 70.04 & their MACD is still signaling bullishness, especially after Friday’s +6.05% gain.
Recent volumes have been below average compared to the year prior.
Last week’s candlesticks began signaling bearishness early in the week & with Wednesday’s dragonfly doji & Thursday’s spinning top, but Friday’s session showed solid price action with prices closing near the highs of the day.
Volume on Friday was relatively tame though, which does not provide much confirmation for the day’s price movement.
PXJ provides a 1.28% distribution yield to long-term investors, making it important to be monitoring open positions & being prepared to hedge against near-term declines, especially as the oscillators cool off from Friday’s large movement.
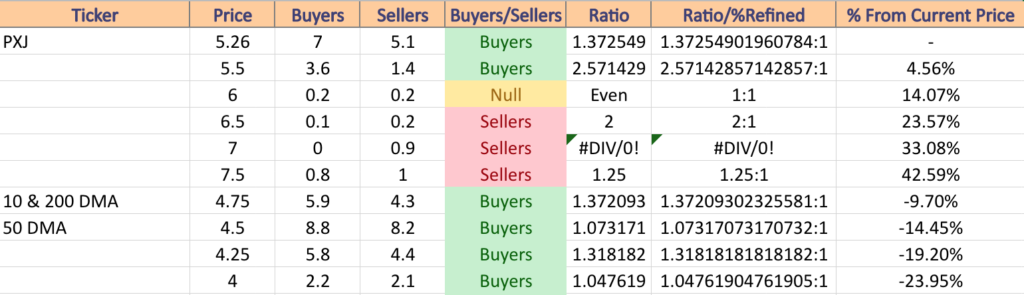
PXJ has support at the $5.23 (Volume Sentiment: Buyers, 1.37:1), $5.20 (Volume Sentiment: Buyers, 1.37:1), $5.16 (Volume Sentiment: Buyers, 1.37:1) & $5.15/share (Volume Sentiment: Buyers, 1.37:1), with resistance at the $5.27 (Volume Sentiment: Buyers, 1.37:1), $5.29 (Volume Sentiment: Buyers, 1.37:1), $5.51 (Volume Sentiment: Buyers, 2.57:1) & $5.56/share (Volume Sentiment: Buyers, 2.57:1) price levels.
Optimum Yield Diversified Commodity Strategy (PDBC), South Africa (EZA), Long-term Treasuries (SPTL) & Global Gold Miners (RING) Are All Bearishly Lagging The Market
PDBC, the Invesco Optimum Yield Diversified Commodity Strategy No. K-1 ETF has fallen -11.33% over the past year, losing -24.52% since their 52-week high in August of 2022, but has reclaimed +4.39% since their 52-week low in May of 2023 (ex-distributions).
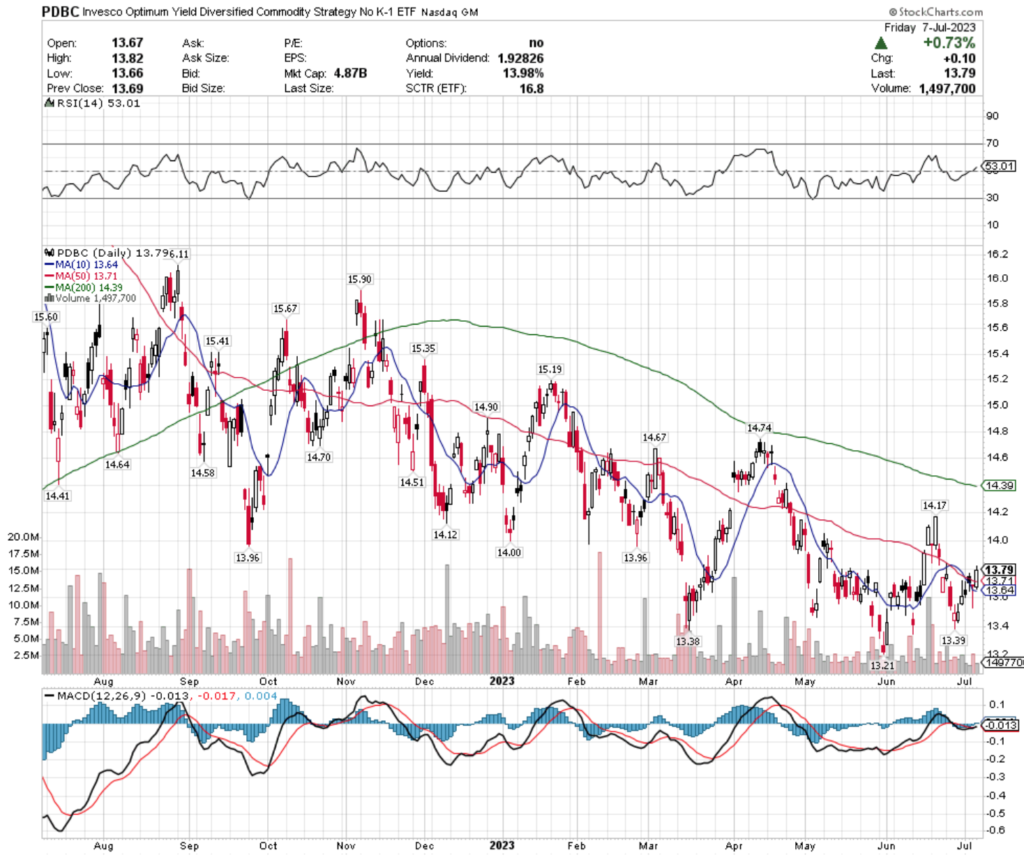
Their RSI is relatively neutral at 53.01, with their MACD signaling a bullish crossover on the horizon, after steady growth in price over the past two weeks.
Last week’s volumes were below average compared to the year prior though, which does not indicate a strong sense of confidence among investors, despite their price being held up by the 10 & 50 day moving averages functioning as levels of support on Friday.
The $14 price level will be an area of interest to watch if they continue climbing in the weeks ahead, but they will need more eager investor sentiment in order to continue upwards.
PDBC pays a handsome 13.98% distribution yield for long-term holders, but hedging would be wise, especially once you notice that they are being held up at resistance points down the line.
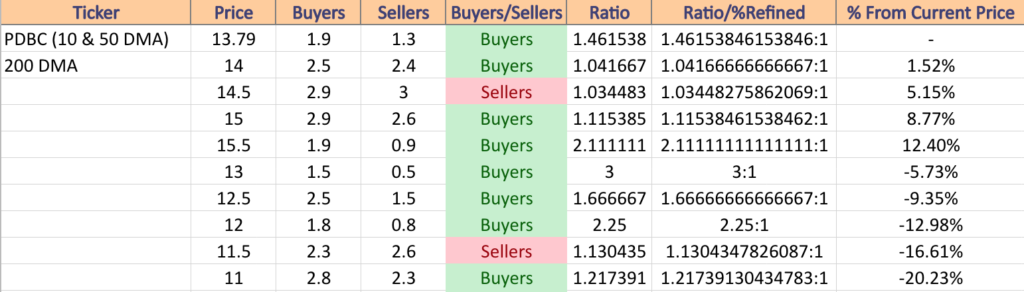
PDBC has support at the $13.71 (50 Day Moving Average; Volume Sentiment: Buyers, 1.46:1), $13.64 (10 Day Moving Average; Volume Sentiment: Buyers, 1.46:1), $13.39 (Volume Sentiment: Buyers, 1.46:1 ) & $13.38/share (Volume Sentiment: Buyers, 1.46:1), with resistance at the $13.96 (2 Touch-points in past 52-weeks; Volume Sentiment: Buyers, 1.46:1), $14.00 (Volume Sentiment: Buyers, 1.04:1), $14.12 (Volume Sentiment: Buyers, 1.04:1) & $14.17/share (Volume Sentiment: Buyers, 1.04:1) price levels.
EZA, the iShares MSCI South Africa ETF has lost -2.56% over the past year, declining -18.37% from their 52-week high in January of 2023, but has climbed back +9.37% since their 52-week low in October of 2022 (ex-distributions).
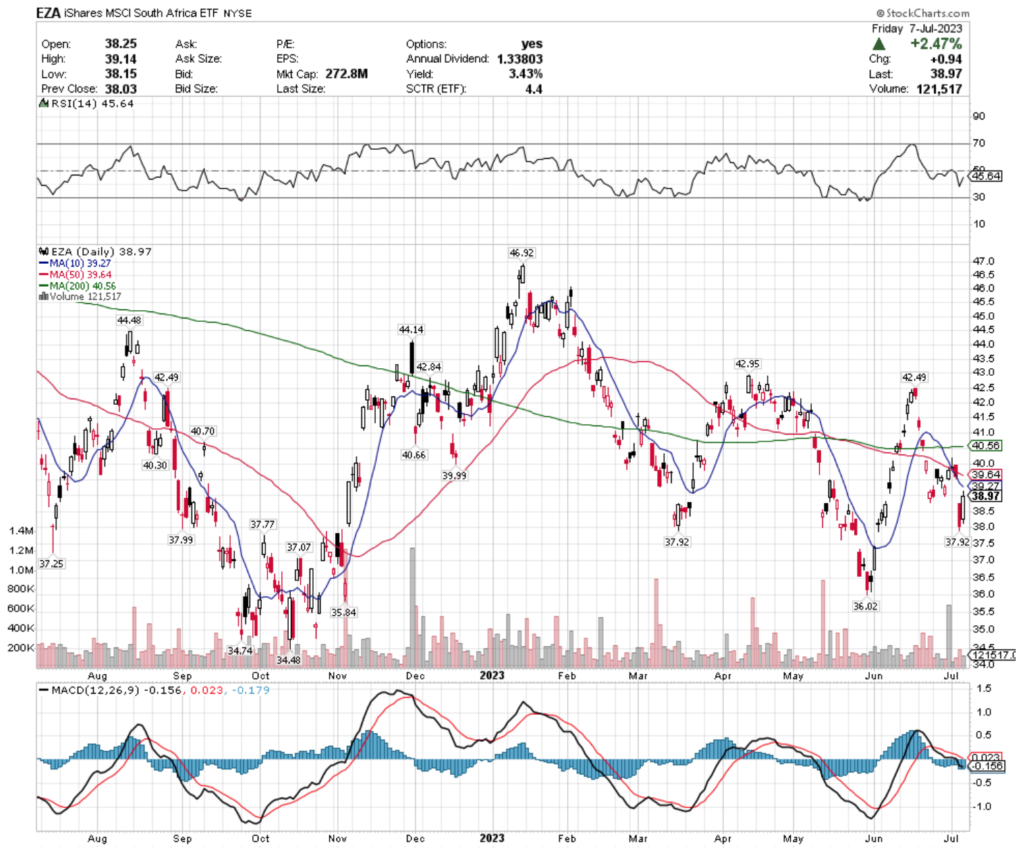
Their RSI is on the oversold end of neutral at 45.64, with their MACD signaling bearishness.
Last week’s volumes were below average compared to the year prior, signaling that there is uncertainty among investors currently.
In the coming week, it will be interesting to see if 10 & 50 day moving averages apply downward pressure on their share price or if their resistance levels will be able to be broken.
EZA provides a 3.43% distribution yield for long-term investors which will provide some protection against losses, but hedging a position would be wise if they begin to falter around resistance levels.
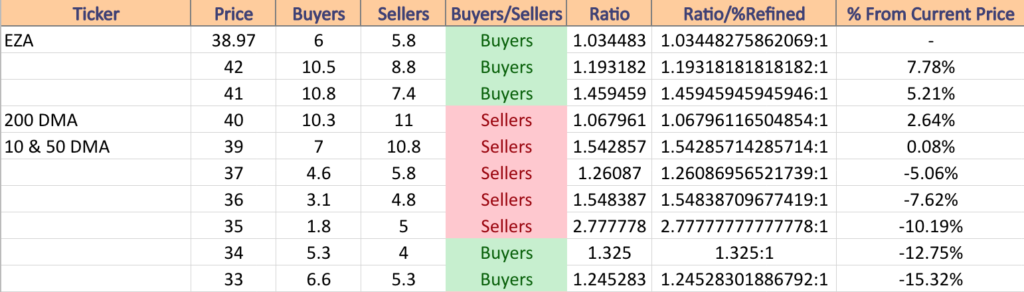
EZA has support at the $37.99 (Volume Sentiment: Sellers, 1.26:1), $37.92 (Two Touch-points In The Past 52-Weeks; Volume Sentiment: Sellers, 1.26:1), $37.77 (Volume Sentiment: Sellers, 1.26:1) & $37.25/share (Volume Sentiment: Sellers, 1.26:1), with resistance at the $39.27 (10 Day Moving Average; Volume Sentiment: Sellers, 1.54:1), $39.64 (50 Day Moving Average; Volume Sentiment: Sellers, 1.54:1), $40.56 (200 Day Moving Average; Volume Sentiment: Sellers, 1.07:1) & $40.66/share (Volume Sentiment: Sellers, 1.07:1) price levels.
SPTL, the SPDR Barclays Long Term Treasury ETF has fallen -10.5% over the past year, dropping -16.85% from their 52-week high in August of 2022, but has regained +7.41% from their 52-week low in October of 2022 (ex-distributions).
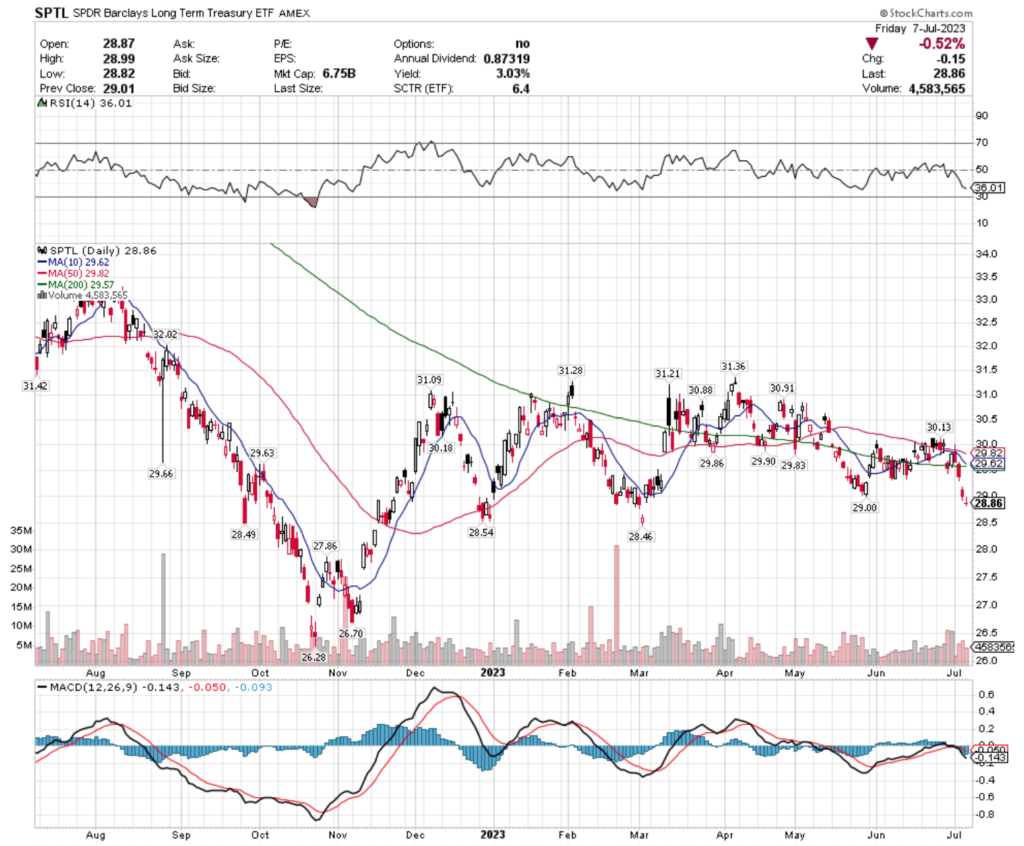
Their RSI is trending towards oversold levels at 36.01, with a bearish reading also coming from their MACD.
Volumes were below average during a week of declines, as prices on Monday were unable to overcome the resistance level set by the 10 & 50 day moving averages & broke down through the 200 day moving average as well.
Friday’s gravestone doji implies that the market views there being more pain on the way for SPTL, as they try to establish a floor in the coming week.
While they pay a 3.03% distribution yield, it would be wise to check into the costs of hedges on any bullish days in the coming weeks to see if there are any discounts on insurance against losses.
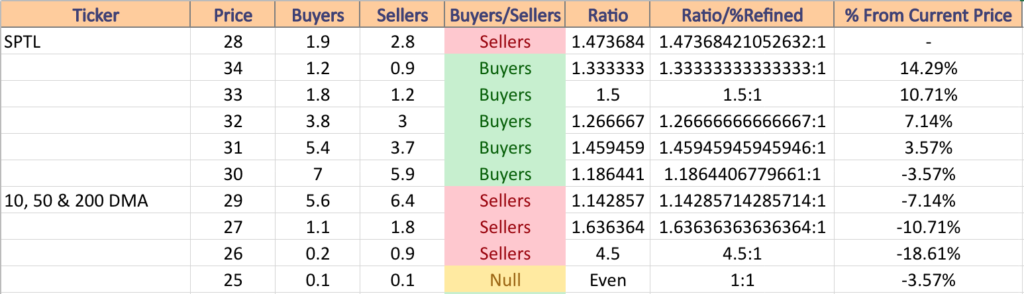
SPTL has support at the $28.54 (Volume Sentiment: Sellers, 1.47:1), $28.49 (Volume Sentiment: Sellers, 1.47:1), $28.46 (Volume Sentiment: Sellers, 1.47:1) & $27.86/share (Volume Sentiment: Sellers, 1.64:1), with resistance at the $29.00 (Volume Sentiment: Sellers, 1.14:1), $29.57 (200 Day Moving Average; Volume Sentiment: Sellers, 1.14:1), $29.62 (10 Day Moving Average; Volume Sentiment: Sellers, 1.14:1) & $29.82/share (50 Day Moving Average; Volume Sentiment: Sellers, 1.14:1) price levels.
RING, the iShares MSCI Global Gold Miners ETF has advanced +10.5% over the past year, but has fallen -19.1% from their 52-week high in May of 2023, while recovering +35.65% from their 52-week low in September of 2022 (ex-distributions).
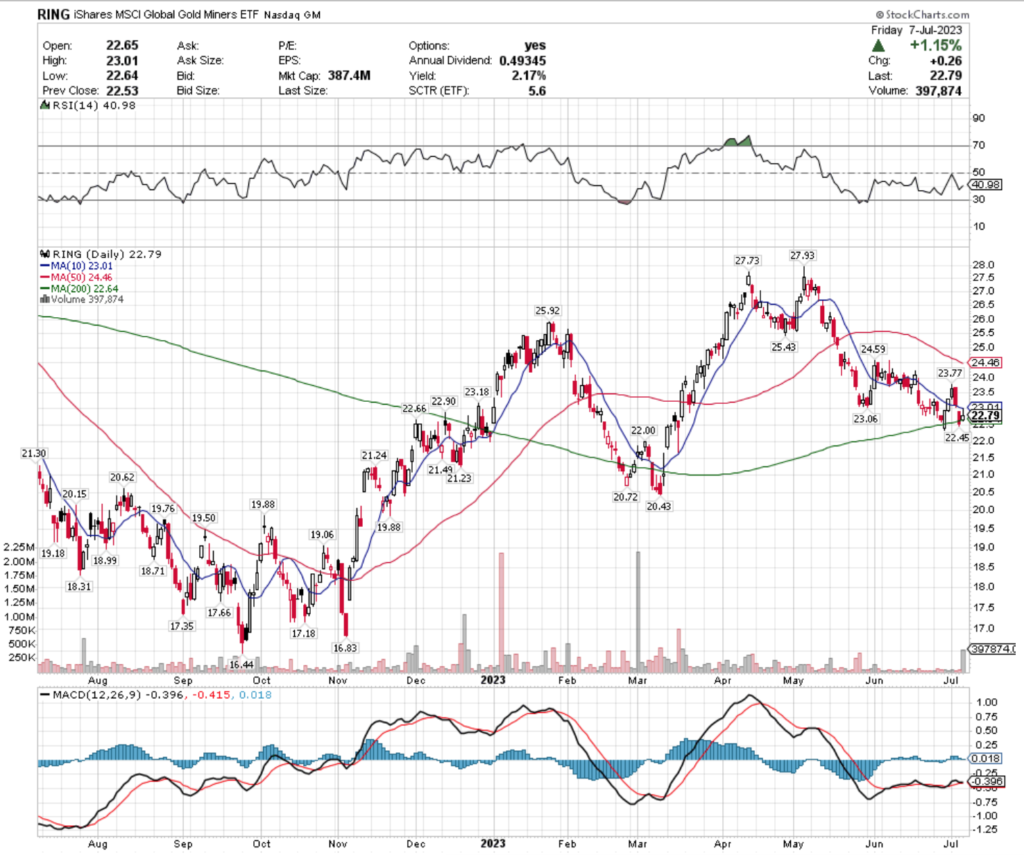
Their RSI is on the oversold end of neutral at 40.98, but their MACD is flashing signs of a bearishness in the coming days.
Volumes were below average all of last week, with the exception of on Friday, a day where prices were caught between support from the 200 day moving average & resistance overhead from the 10 day moving average & candle formed a harami pattern with Thursday’s candle, with the prices opening & closing close to the bottom of the day’s range.
Wednesday’s candle was a bearish engulfing candle, which implies that there are further declines in store for RING in the near-term.
While they pay a 2.17% distribution yield to long-term shareholders, market participants with a position in RING would be wise to look for hedges as protection from additional declines.
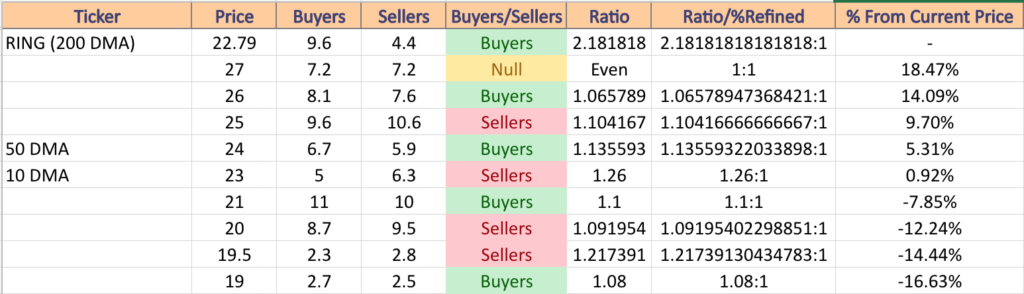
RING has support at the $22.66 (Volume Sentiment: Buyers, 2.18:1), $22.64 (200 Day Moving Average; Volume Sentiment: Buyers, 2.18:1), $22.45 (Volume Sentiment: Buyers, 2.18:1) & $22.00/share (Volume Sentiment: Buyers, 2.18:1), with resistance at the $22.90 (Volume Sentiment: Buyers, 2.18:1), $23.01 (10 Day Moving Average; Volume Sentiment: Sellers, 1.26:1), $23.06 (Volume Sentiment: Sellers, 1.26:1) & $23.18/share (Volume Sentiment: Sellers, 1.26:1) price levels.
Tying It All Together
Monday kicks off with Wholesale Inventories reported at 10 am, followed by Consumer Credit at 3 pm.
Also on Monday, PriceSmart & WD-40 are set to report earnings.
On Tuesday we get the NFIB Optimism Index reading at 6 am & there are no earnings reports scheduled.
Wednesday is the much anticipated Consumer Price Index, Core CPI, CPI Year-over-Year & Core CPI Year-over-Year at 8:30 am, followed by the Fed Beige Book at 2pm, with earnings reports due to AngioDynamics & MillerKnoll.
On Thursday morning we get the Initial Jobless Claims, Producer Price Index, Core PPI, PPI Year-over-Year & Core PPI Year-over-Year data, all reported at 8:30 am.
Thursday’s earnings include PepsiCo, Delta Airlines, Conagra, Fastenal, Progressive & Washington Federal.
Friday the week winds down with Import Price Index & Import Price Index Minus Fuel data at 8:30 am & Consumer Sentiment reported at 10 am.
JPMorgan Chase, BlackRock, Citigroup, State Street, United Health Group & Wells Fargo are all due to report earnings on Friday.
*** I DO NOT OWN SHARES OR OPTIONS CONTRACT POSITIONS IN SPY, QQQ, IWM, DIA, SOXL, BRZU, DXJ, PXJ, PDBC, EZA, SPTL, or RING AT THE TIME OF PUBLISHING THIS ARTICLE ***