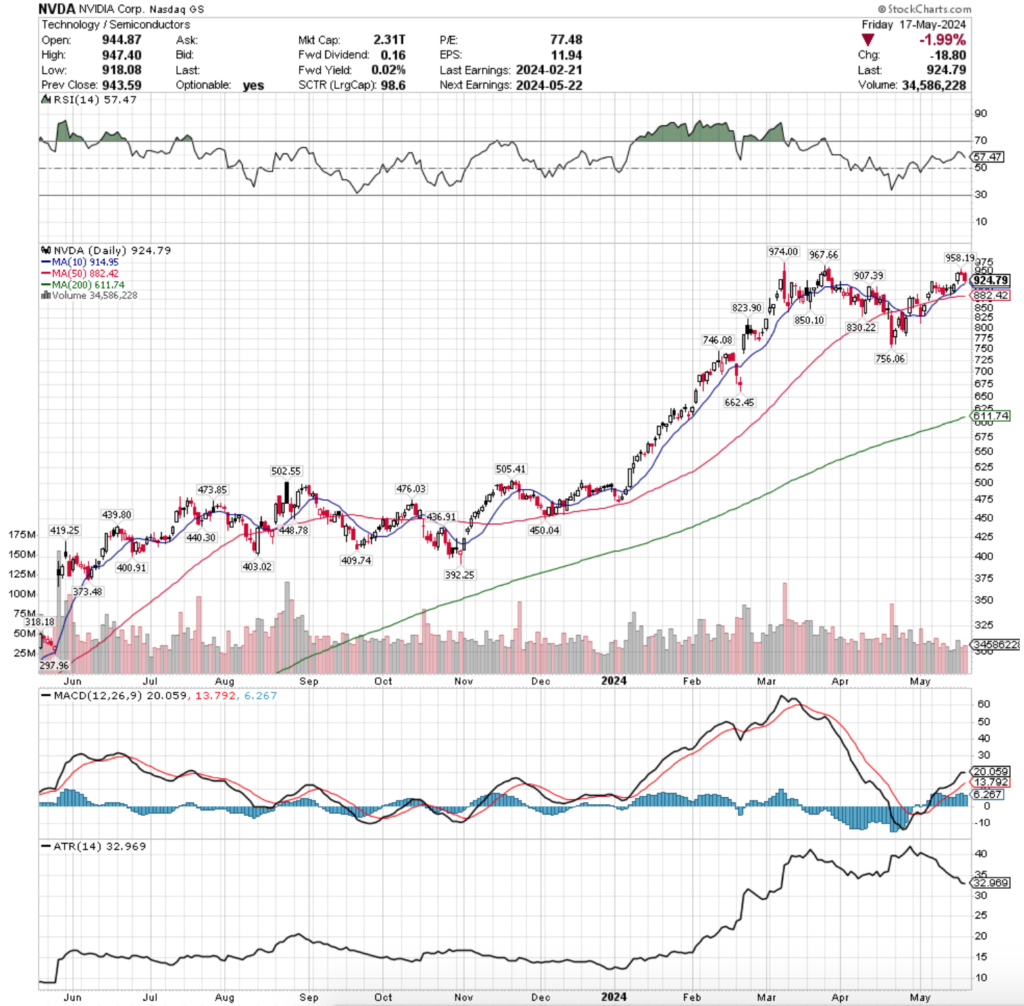
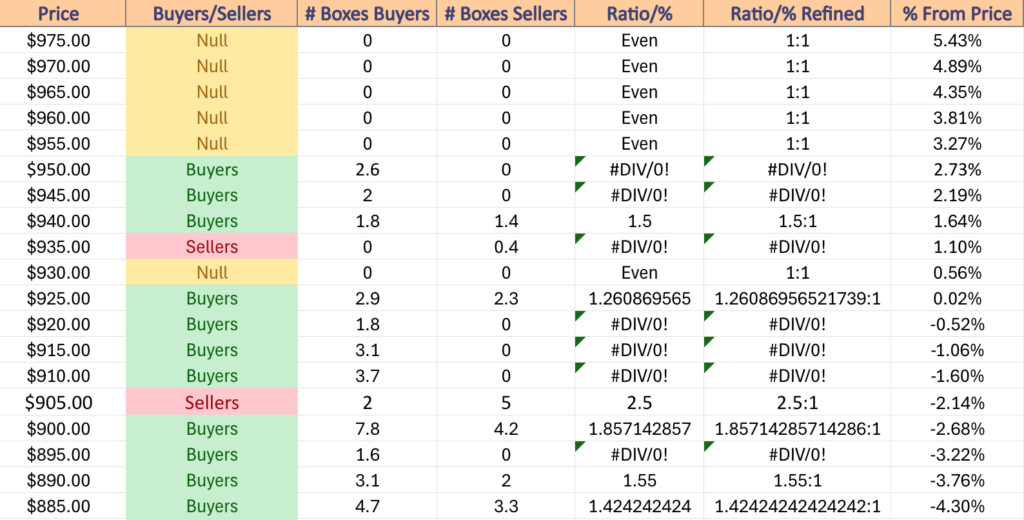
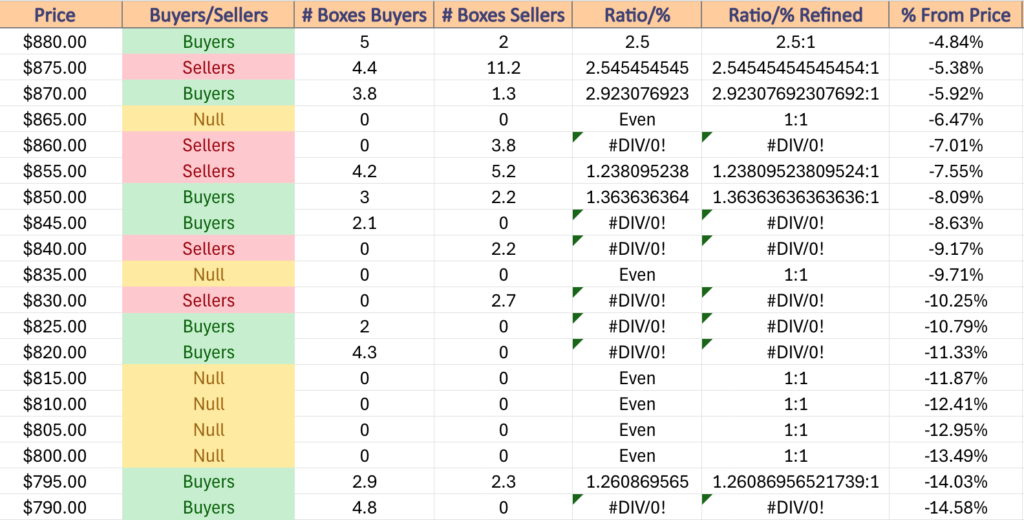
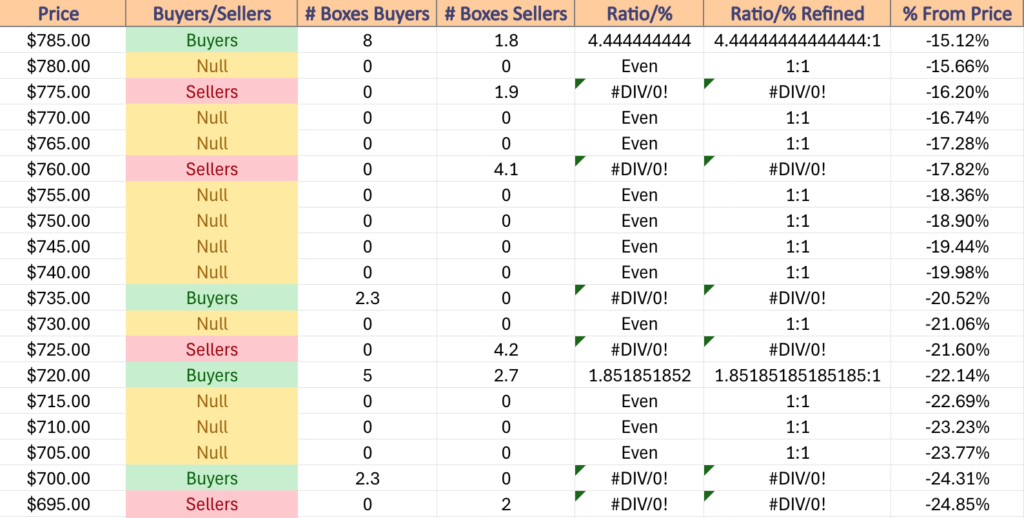
SJW Group Inc. SJW Stock Analysis

SJW Group Inc. stock trades under the ticker SJW & has shown some recent bullish signals that traders & investors should research further into for when markets become less consolidated.

SJW stock closed at $76.28/share on 5/30/2023.

SJW Group Inc. SJW Stock’s Technical Performance Broken Down

SJW Group Inc. SJW Stock's Technical Performance Over The Past Year
SJW Group Inc. SJW Stock’s Technical Performance Over The Past Year

SJW Stock Price: $76.28

10 Day Moving Average: $75.39

50 Day Moving Average: $76.44

200 Day Moving Average: $72.53

RSI: 51.36

MACD: -0.313, -0.377, 0.064

Yesterday, SJW stock completed a bullish MACD crossover, gaining +0.18% on the day’s session.

Their RSI is neutral at 51.36 & recent trading volumes have been about average compared to the year prior.

However, yesterday’s session resulted in a gravestone doji candle, which signals more bearish sentiment is on the horizon, making it best for investors to wait to see how they behave around support levels in the near-term, while waiting for the market to break out of its recent sideways trend.

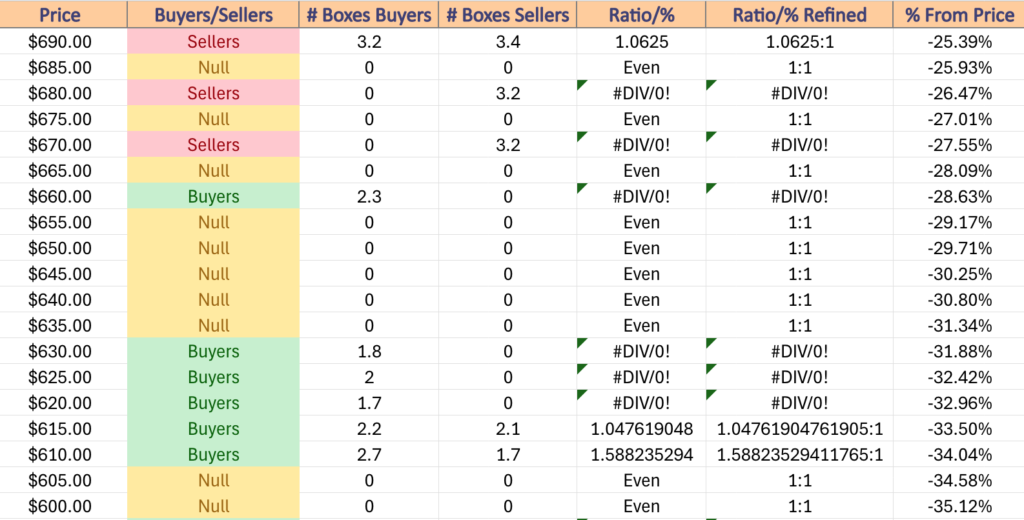
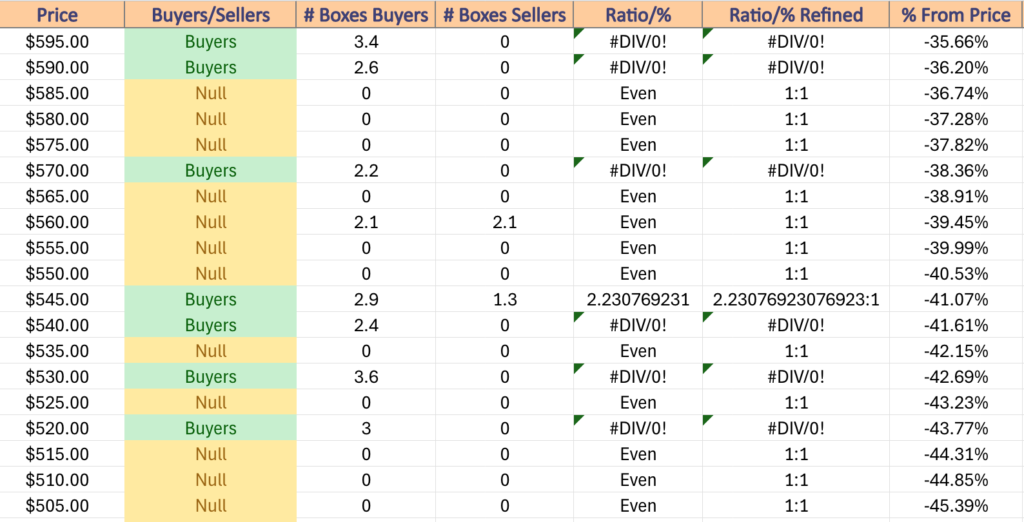
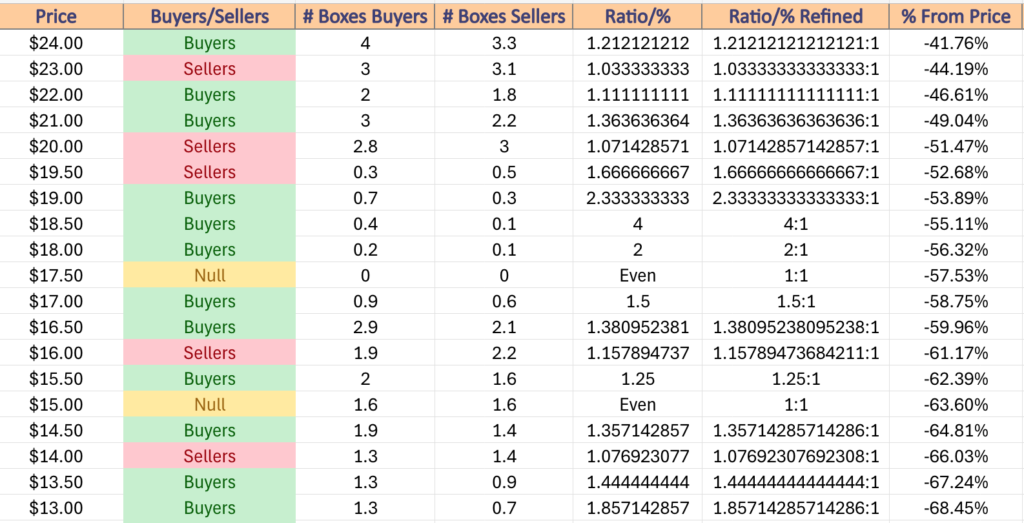
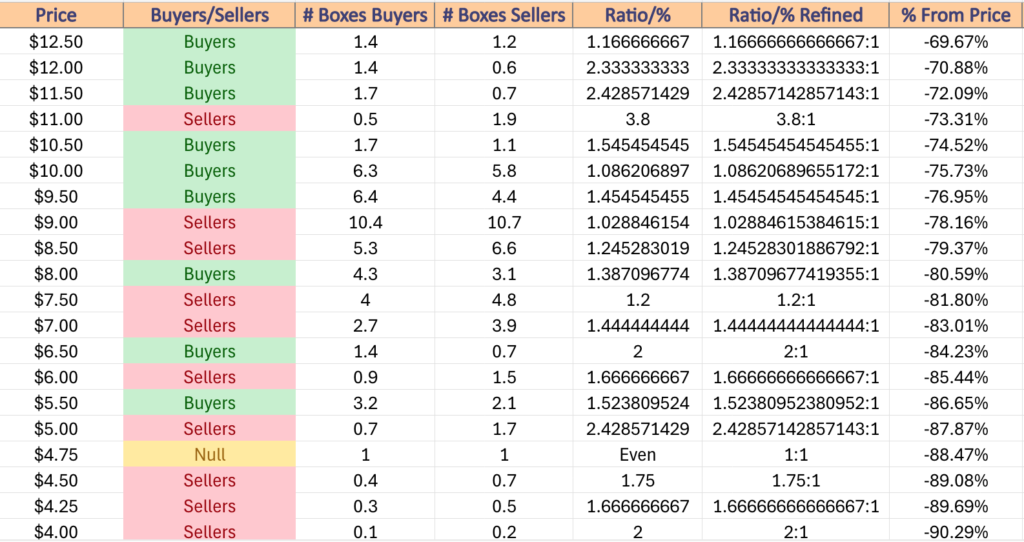
SJW stock has support at the $75.39 (10 day moving average, Volume Sentiment: Sellers, 5.19:1) , $74.49 (Volume Sentiment: Sellers, 1.63:1) , $74.41 (Volume Sentiment: Sellers, 1.63:1) & $73.92/share (Volume Sentiment: Sellers, 1.4:1) price levels, with resistance at the $76.44 (50 day moving average, Volume Sentiment: Buyers, 1.81:1) , $76.99 (Volume Sentiment: Buyers, 1.81:1) , $77.47 (Volume Sentiment: Sellers, 1.09:1) & $77.83/share (Volume Sentiment: Sellers, 1.09:1) price levels.

SJW Group Inc. SJW Stock  Point & Figure Chart With Volume Level Overlay, 10 & 50 Day Moving Averages & Trend Lines
SJW Group Inc. SJW Stock Point & Figure Chart With Volume Level Overlay, 10 & 50 Day Moving Averages & Trend Lines

SJW Group Inc. SJW Stock As A Long-Term Investment

Long-term focused investors will like SJW stock’s valuation metrics, with a 31.2 P/E (ttm) & a 2.11 P/B (mrq).

They recently reported 10.5% Quarterly Revenue Growth Y-o-Y, with 208.5% Quarterly Earnings Growth Y-o-Y.

Their balance sheet will require a more thorough analysis, with $23.33M of Total Cash (mrq) & $1.64B of Total Debt (mrq).

SJW stock pays a 1.92% dividend, which may not be sustainable in the long-run, as their payout ratio is 54.58%.

91.88% of SJW stock is owned by institutional investors.

SJW Group Inc. SJW Stock As A Short-Term Trade Using Options

Traders with shorter time horizons can trade options to profit from SJW stock’s price movements, while protecting their portfolio from broader market volatility.

I am looking at the contracts with the 6/16 expiration date.

The $75 call options are the only strike price that is in-the-money at that expiration date.

The $85 & $80 puts are in-the-money, with the former being more liquid than the latter strike.

Tying It All Together

SJW stock has many interesting characteristics that traders & investors should research further into.

Investors will like their recent growth metrics & dividend, but may want to research how sustainable their yield is, as well as dig deeper into their balance sheet.

Traders will like their recent technical performance, but may be disappointed by how illiquid their options are.

Overall, it is worth taking a closer look into SJW stock to see how it fits into your portfolio strategy for once the markets have begun trending upwards again.

*** I DO NOT OWN SHARES OR OPTIONS CONTRACT POSITIONS IN SJW AT THE TIME OF PUBLISHING THIS ARTICLE ***
Houlihan Lokey, Inc. HLI Stock Analysis

Houlihan Lokey, Inc. stock trades under the ticker HLI & has shown recent bullish signals that traders & investors should research further into, in anticipation of when market conditions become less rangebound.

HLI stock closed at $89.00/share on 5/30/2023.

Houlihan Lokey, Inc. HLI Stock’s Technical Performance Broken Down

Houlihan Lokey, Inc. HLI Stock's Technical Performance Over The Past Year
Houlihan Lokey, Inc. HLI Stock’s Technical Performance Over The Past Year

HLI Stock Price: $89.00

10 Day Moving Average: $88.21

50 Day Moving Average: $89.24

200 Day Moving Average: $88.79

RSI: 50.63

MACD: -0.435, -0.499, 0.064

Yesterday, HLI stock completed a bullish MACD crossover, gaining +0.39% on the day’s session.

Their RSI is neutral at 50.63 & recent trading volumes have been about average compared to the year prior.

Given how markets have been stuck in a range for the past month, investors would be best suited to watch how they behave around support levels & wait to make a move on HLI until they are in a non-sideways trend again.

HLI stock has support at the $88.21 (10 day moving average; Volume Sentiment: Sellers, 1.33:1), $87.61 (Volume Sentiment: Buyers, 1.14:1), $86.39 (Volume Sentiment: Sellers, 1.68:1) & $86.20/share (Volume Sentiment: 1.68:1) price levels, with resistance at the $89.24 (50 day moving average; Volume Sentiment: Sellers, 10.75:1), $93.26 (Volume Sentiment: Sellers, 2.07:1), $93.55 (Volume Sentiment: Sellers, 2.07:1) & $93.92/share (Volume Sentiment: Sellers, 2.07:1) price level.

Houlihan Lokey, Inc. HLI Stock Point & Figure Chart With Volume Level Overlay, 10 & 50 Day Moving Averages & Trend Lines

Houlihan Lokey, Inc. HLI Stock As A Long-Term Investment

Long-term oriented investors will like HLI stock’s 23.53 P/E (ttm), but may find their 3.95 P/B (mrq) to be a bit too rich.

Before investing, investors may want to look deeper into their recently reported -5.6% Quarterly Revenue Growth Y-o-Y, with -8.5% Quarterly Earnings Growth Y-o-Y.

Their balance sheet looks strong, with $714.44M of Total Cash (mrq) & $374.87M of Total Debt (mrq).

HLI stock pays a 2.39% dividend, but investors should make sure that they are able to cover it in the long-term sustainably, as their payout ratio is 53.27%.

98.47% of HLI stock’s outstanding share float is owned by institutional investors.

Houlihan Lokey, Inc. HLI Stock As A Short-Term Trade Using Options9

Traders with shorter time horizons can trade options to profit from HLI stock’s price movements, while protecting their portfolios from volatility.

I am looking at the contracts with the 6/16 expiration date.

There are currently no in-the-money call options for this expiration date.

The $90, $95 & $100 puts are all in-the-money, listed from highest to lowest level of open interest.

Tying It All Together

HLI stock has many interesting attributes that traders & investors will find appealing.

Investors will like their balance sheet & dividend yield, but may want to look into their recent growth metrics, before investing once markets have broken out of the recent sideways trend.

Traders will like their recent technical performance, but will dislike how illiquid their options are.

All-in-all, it is worth taking a closer look into HLI stock to see how it fits into your portfolio strategy.

*** I DO NOT OWN SHARES OR OPTIONS CONTRACT POSITIONS IN HLI STOCK AT THE TIME OF PUBLISHING THIS ARTICLE ***
Morgan Stanley MS Stock Analysis

Morgan Stanley stock trades under the ticker MS & has shown recent bullishness that traders & investors should look further into.

MS stock closed at $83.90/share on 5/26/2023.

Morgan Stanley MS Stock’s Technical Performance Broken Down

Morgan Stanley MS Stock's Technical Performance Over The Past Year
Morgan Stanley MS Stock’s Technical Performance Over The Past Year

MS Stock Price: $83.90

10 Day Moving Average: $82.85

50 Day Moving Average: $85.23

200 Day Moving Average: $86.80

RSI: 48.51

MACD: -1.056, -1.150, 0.093

On Friday, MS stock completed a bullish MACD crossover, settling +1.08% 0n the day’s session.

Their RSI is about neutral at 48.51 & recent trading volumes have been roughly average compared to the year prior.

Investors now would be wisest to watch how their price behaves around their support levels in the near-term, while planning where they may want to enter into a position once their price is in an uptrend again.

MS stock has support at the $83.77 (Volume Sentiment: Sellers,1.23:1), $83.53 (Volume Sentiment: Sellers,1.23:1), $82.85 (10 day moving average, Volume Sentiment: Sellers, 1.08:1) & $82.67/share (Volume Sentiment: Sellers, 1.08:1) price levels, with resistance at the $84.98 (Volume Sentiment: Sellers, 1.06:1), $85.23 (50 day moving average; Volume Sentiment: Sellers, 1.63:1), $86.72 (Volume Sentiment: Sellers, 1.18:1) & $86.80/share (200 day moving average; Volume Sentiment: Sellers, 1.18:1) price levels.

Morgan Stanley MS Stock As A Long-Term Investment

Investors with long time horizons will like MS stock’s valuation metrics, with a 14.56 P/E (ttm) & a 1.54 P/B (mrq).

They will want to look closer into their recent growth metrics though, with a reported -3.1% Quarterly Revenue Growth Y-o-Y & -18.7% Quarterly Earnings Growth Y-o-Y.

Their balance sheet looks appealing, with $573.24B of Total Cash (mrq) & $363.96B of Total Debt (mrq).

MS stock pays a 3.73% dividend, which appears to be sustainable in the long-run, as their payout ratio is 51.89%.

63.44% of MS stock’s outstanding share float is owned by institutional investors.

Morgan Stanley MS Stock As A Short-Term Trade Using Options

Traders with shorter time horizons can trade options to profit from movements in MS stock’s price, while hedging their portfolios against market volatility.

I am looking at the contracts with the 6/16 expiration date.

The $82.50, $80 & $83 call options are all in-the-money, listed from highest to lowest level of open interest.

The $85, $87.50 & $84 puts are also all in-the-money, with the former being more liquid than the latter strike prices.

Tying It All Together

MS stock has many interesting characteristics that traders & investors will find appealing.

Investors will like their dividend yield, valuation metrics & balance sheet, but will want to look a bit deeper into their recent growth.

Traders will like their recent technical performance, as well as how liquid their options are.

All-in-all, it is worth taking a closer look into how MS stock fits into your portfolio strategy.

*** I DO NOT OWN SHARES OR OPTIONS CONTRACT POSITIONS IN MS STOCK AT THE TIME OF PUBLISHING THIS ARTICLE ***

Weekly Stock & ETF Market Review 5/28/2023

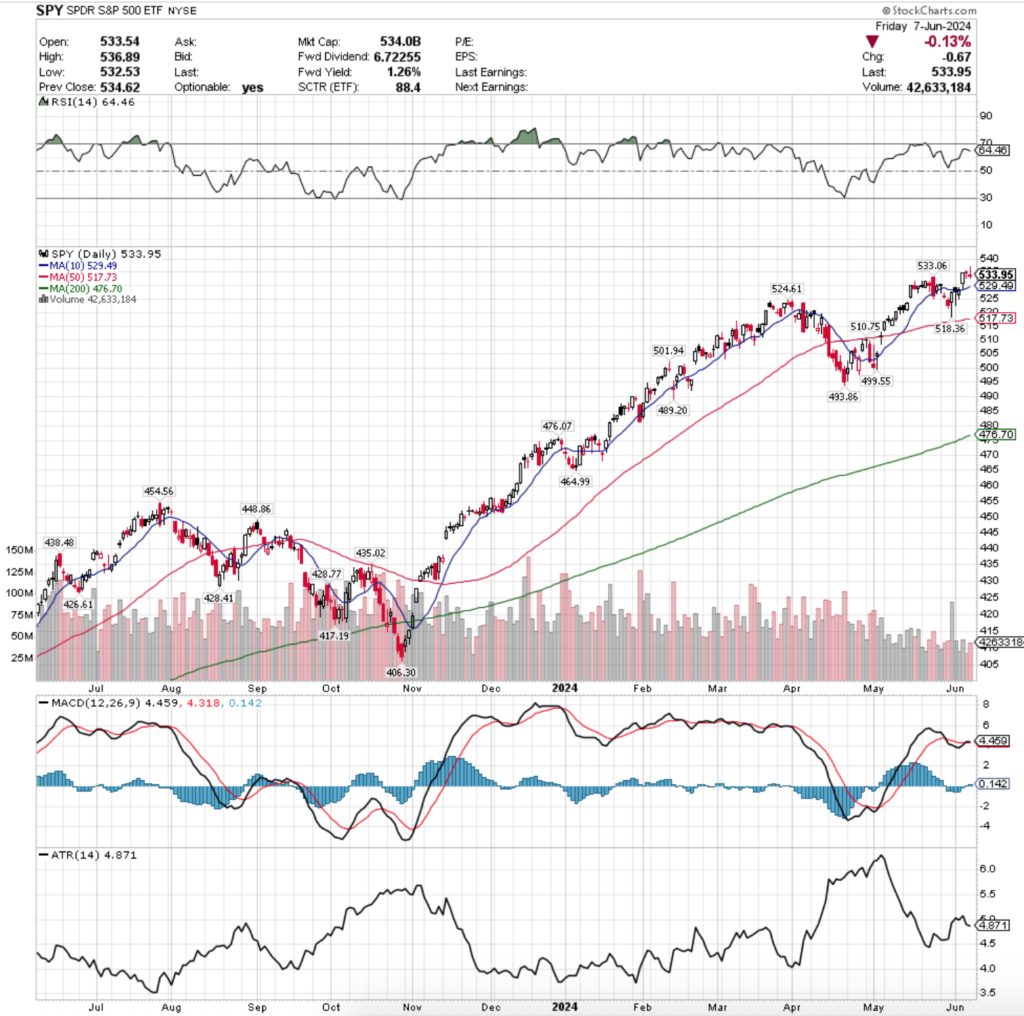
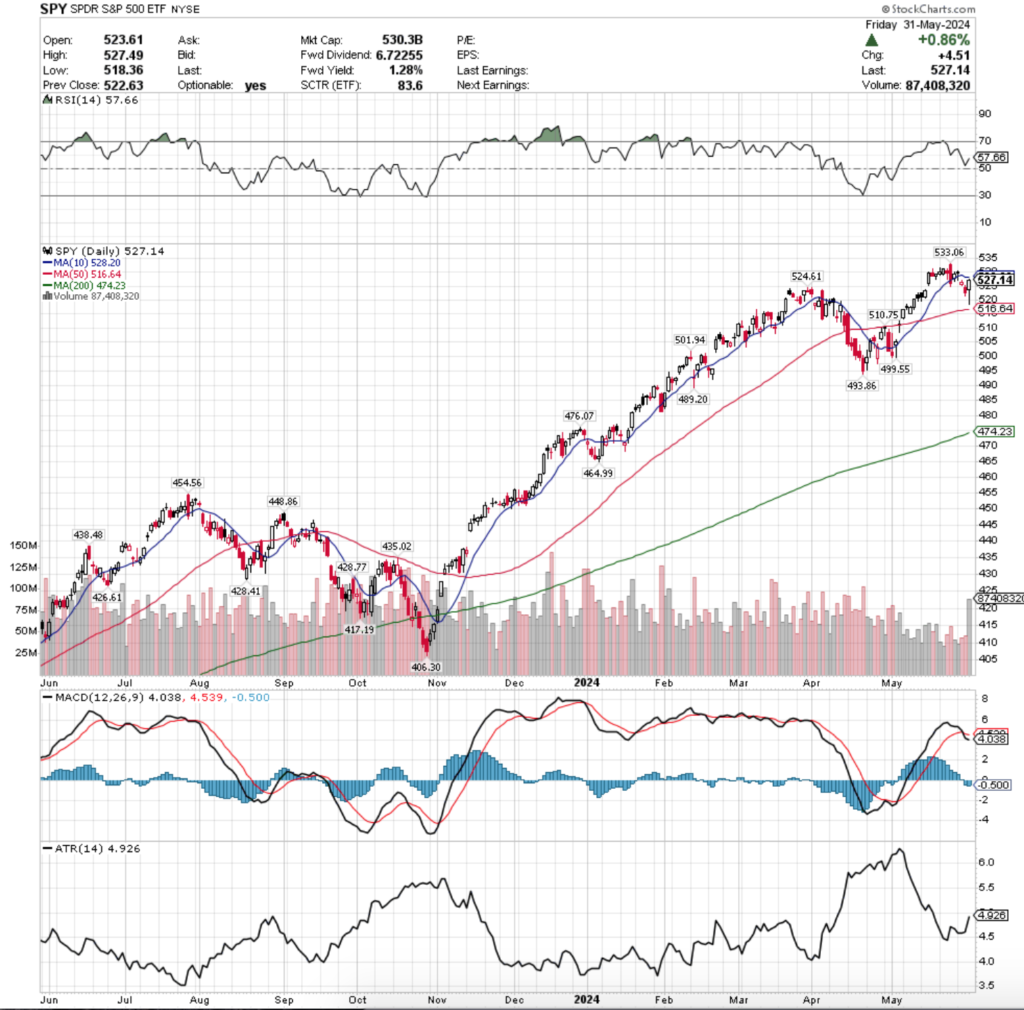
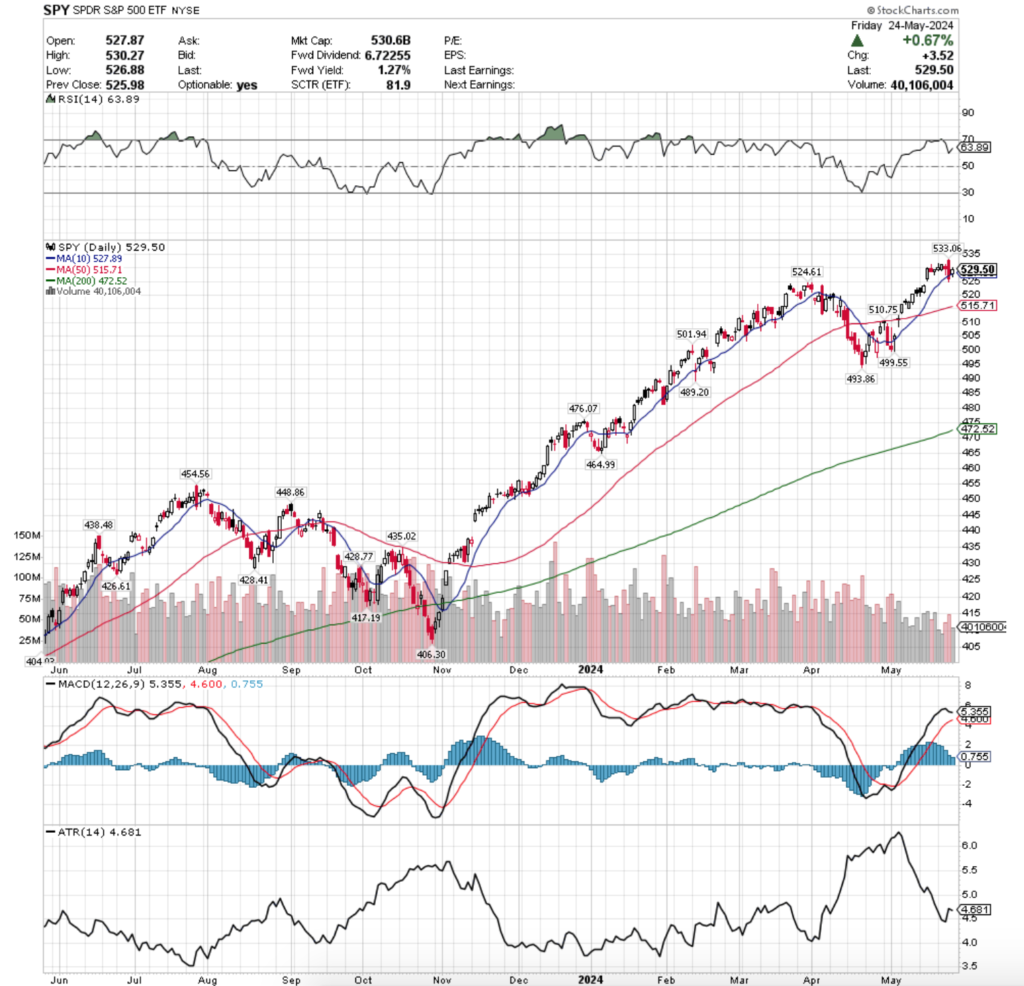
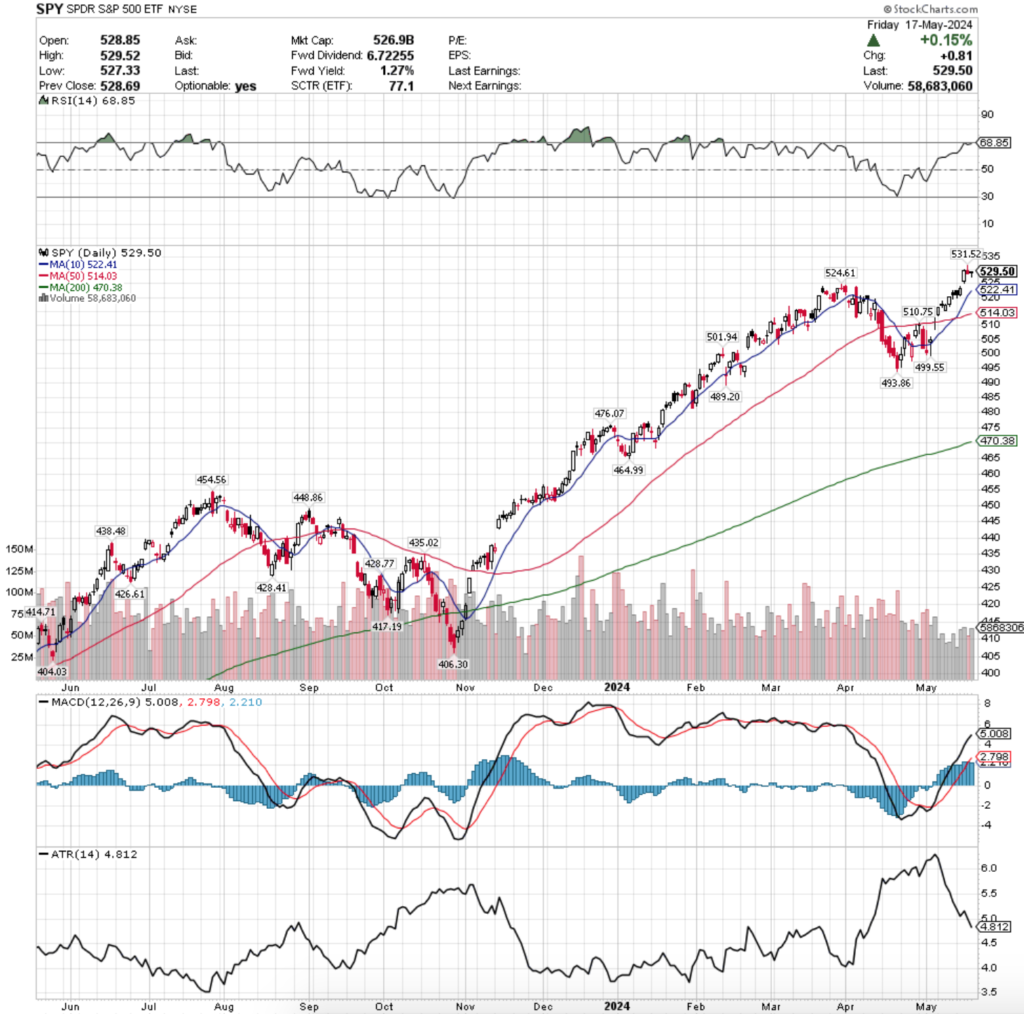
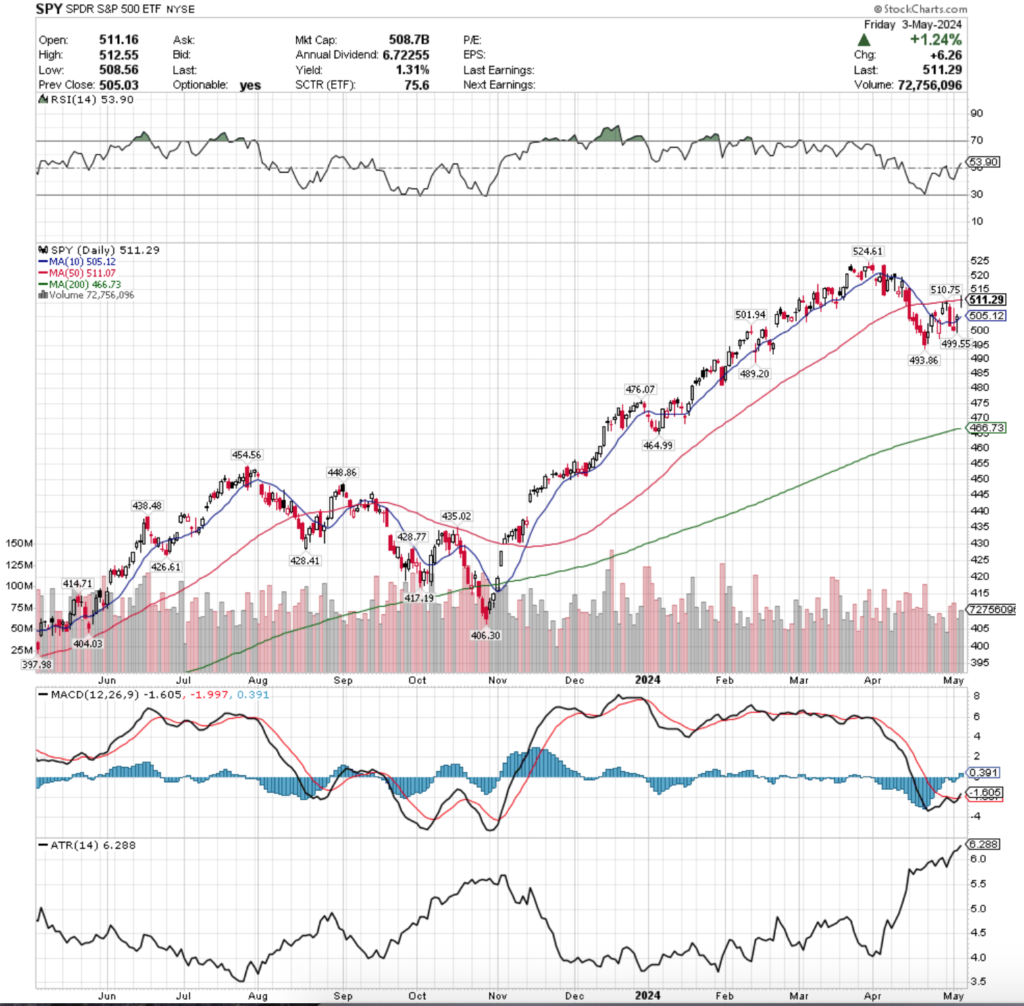
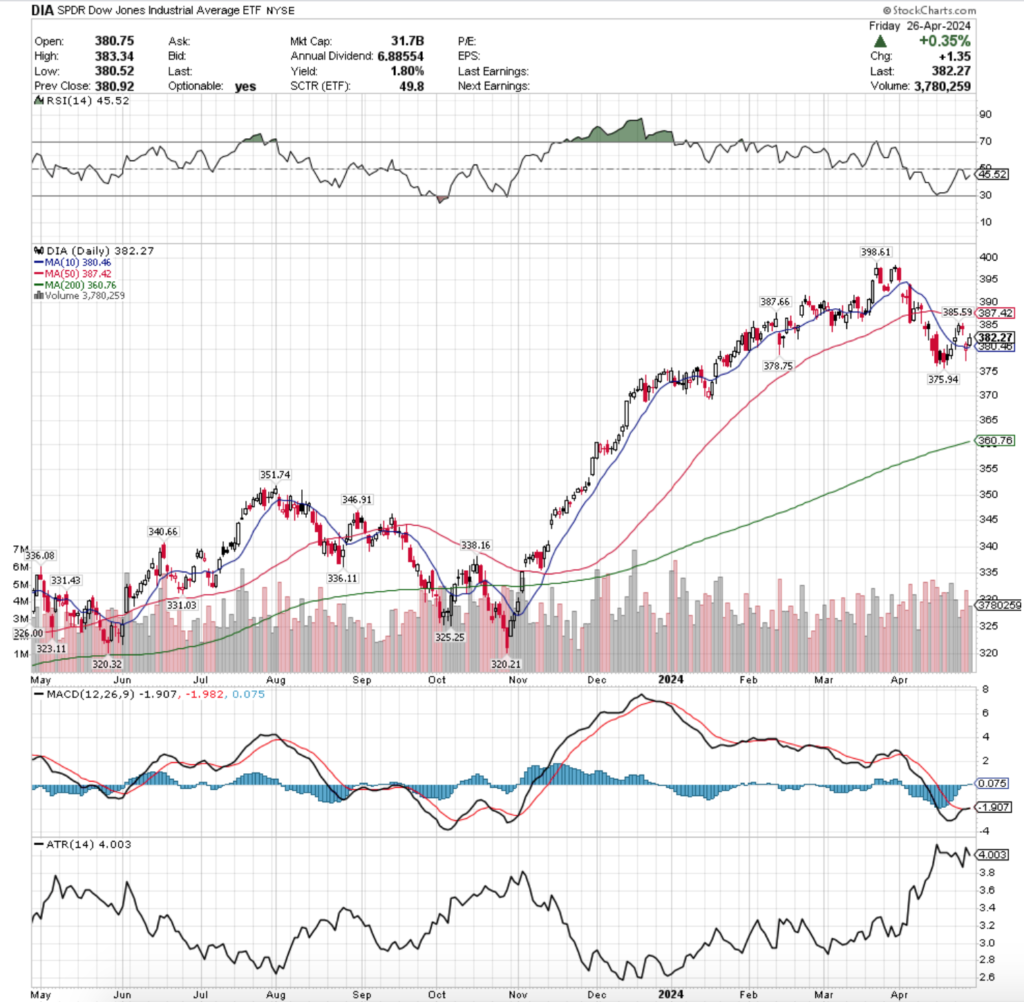
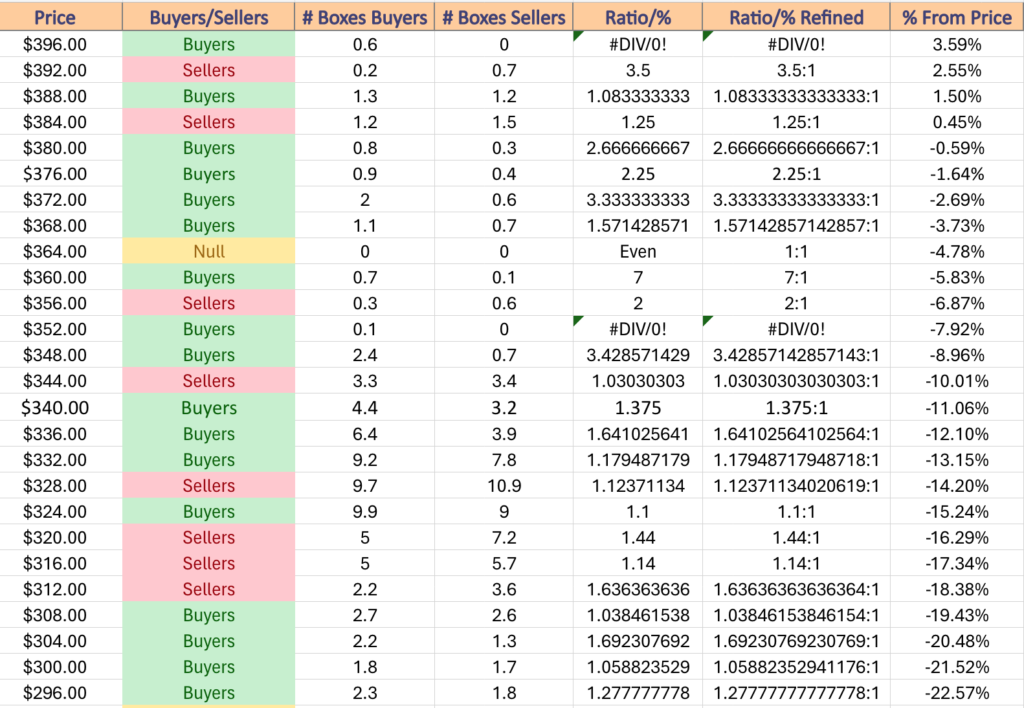
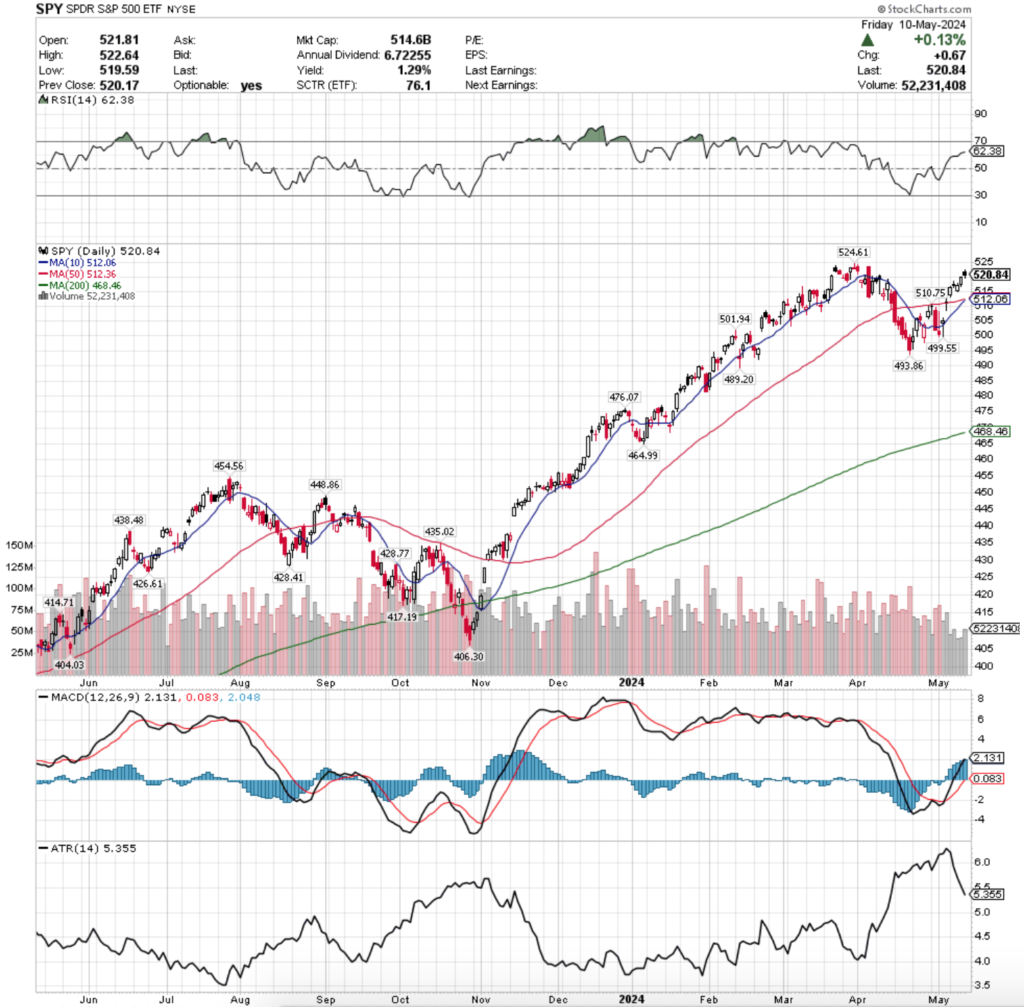
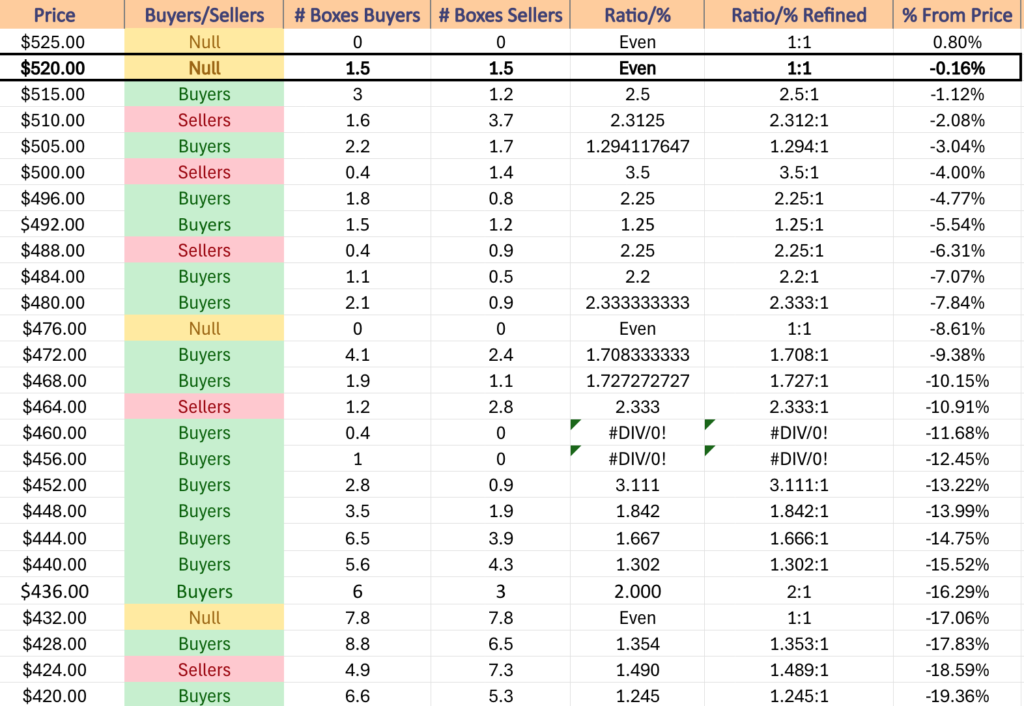
SPY, the SPDR S&P 500 ETF gained +0.33% over the past week, as S&P 500 stocks recovered from their early week losses over Thursday & Friday, led by NVIDIA’s strong earnings.

SPY ETF - SPDR S&P 500 ETF's Technical Performance Over The Past Year
SPY ETF – SPDR S&P 500 ETF’s Technical Performance Over The Past Year

Their RSI is still on the overbought end of neutral at 59.79, with volumes being about average compared to the year prior.

Their MACD has been in limbo for the last few weeks while they’ve been relatively rangebound, as investors are still unsure about which direction the market is going to head in in the near-term.

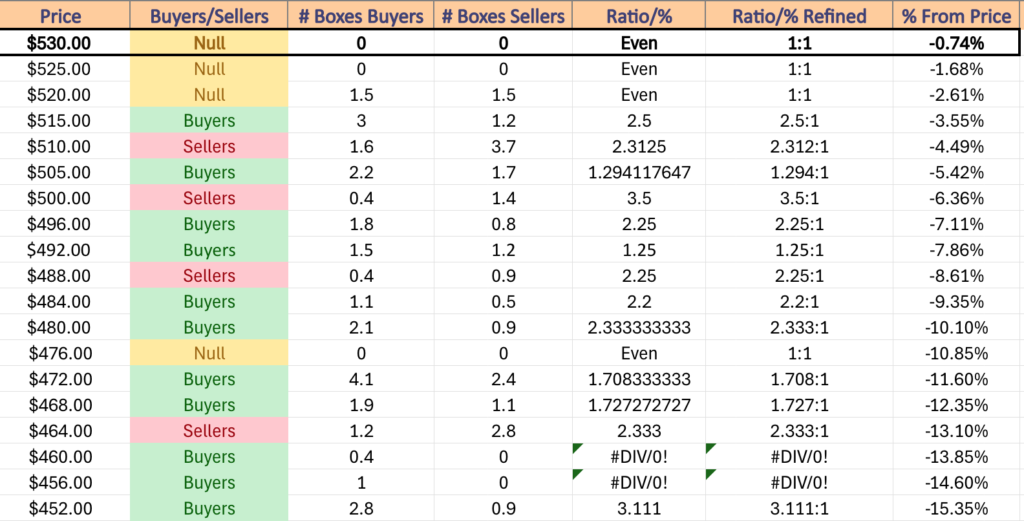
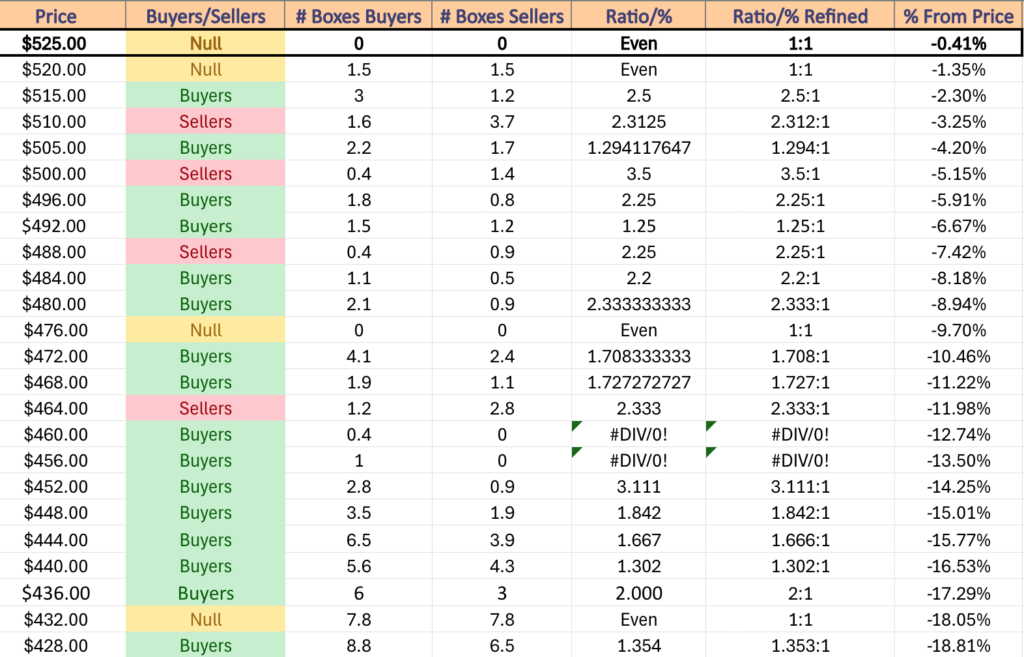
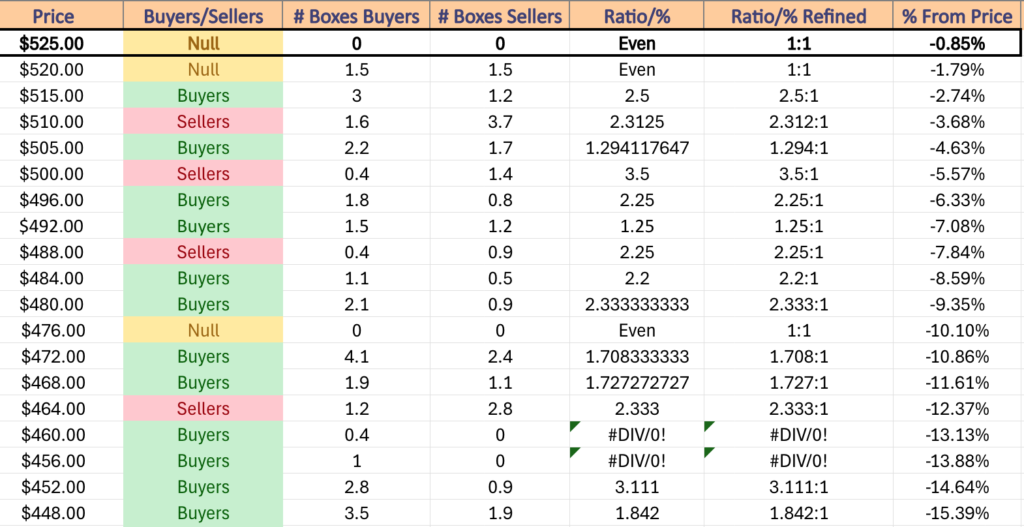
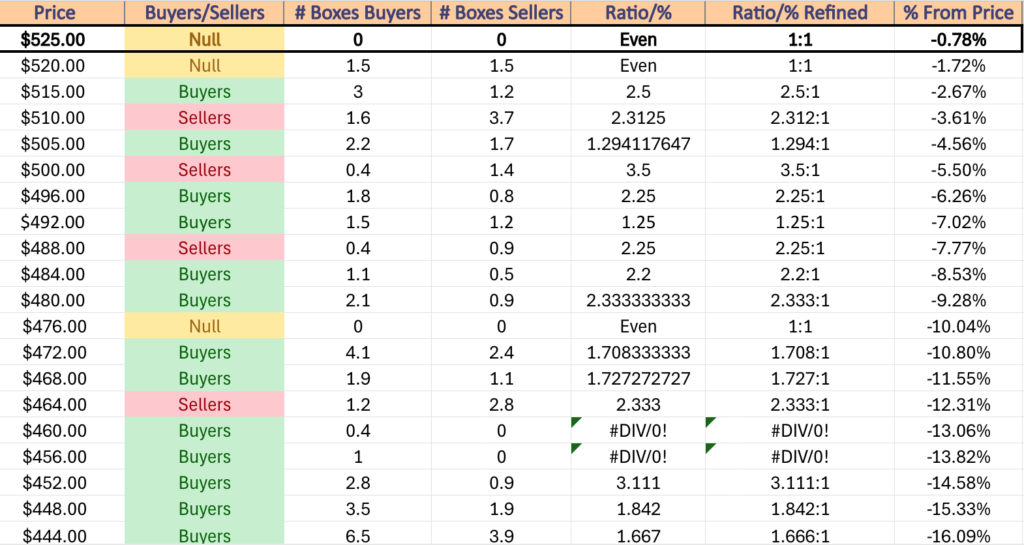
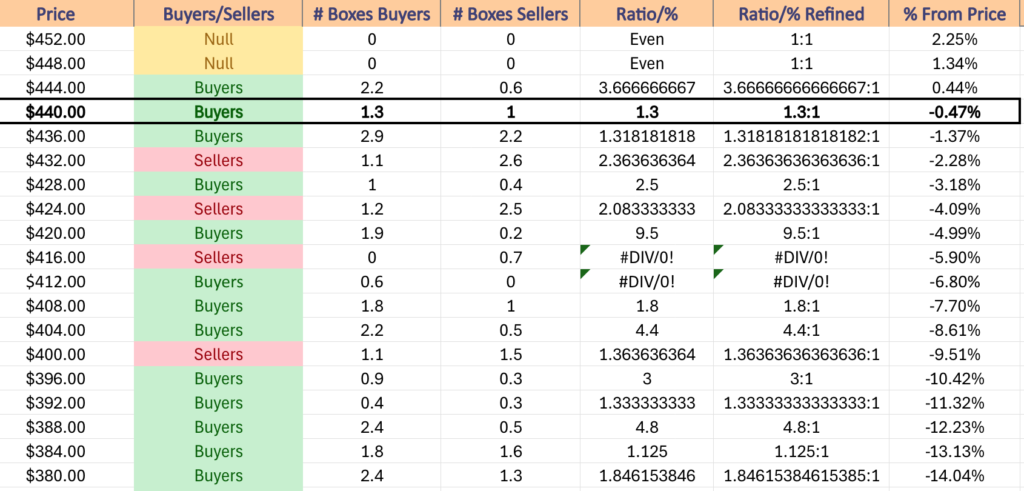
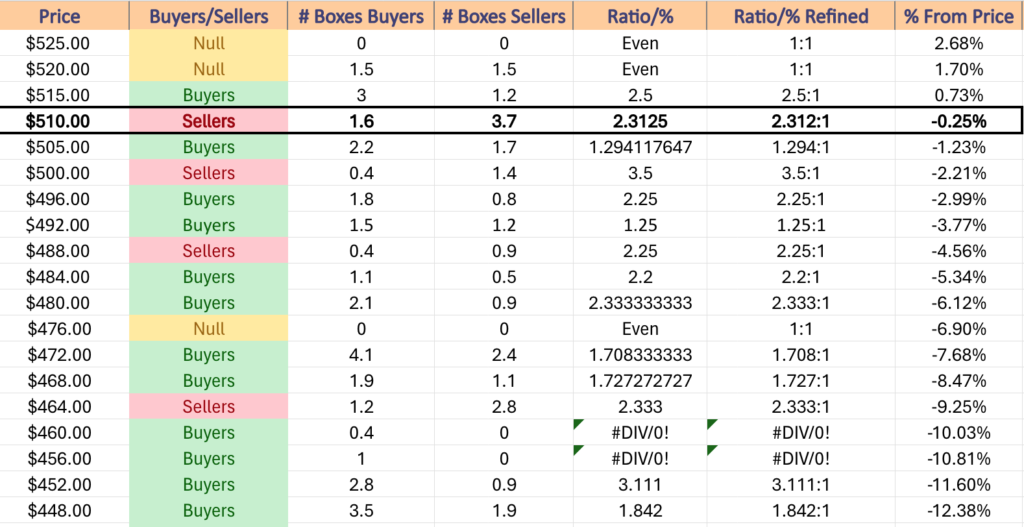
SPY has support at the $416.72 (Volume Sentiment: Sellers, 1.33:1), $415.50 (10 day moving average, Volume Sentiment: Buyers 3:1), $410.48 (Volume Sentiment: Sellers, 1.57:1) & $408.90/share (50 day moving average, Volume Sentiment: Sellers, 1.57:1), with resistance at the $426.37 (Volume Sentiment: Sellers, 1.24:1), $438.53 (Volume Sentiment: Sellers, 1.32:1), $442.12 (Volume Sentiment: Sellers, 1.35:1)& $449.09/share (Volume Sentiment: Buyers, 1.89:1) price levels.

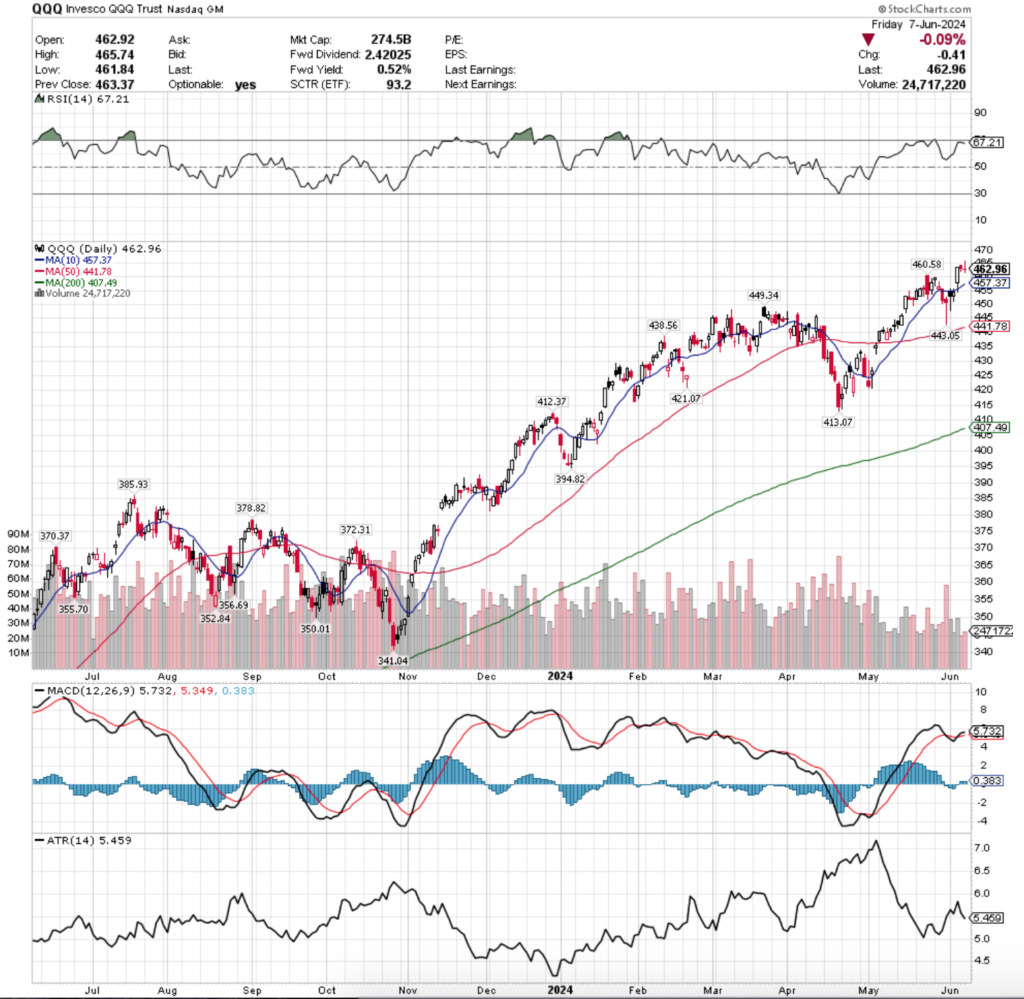
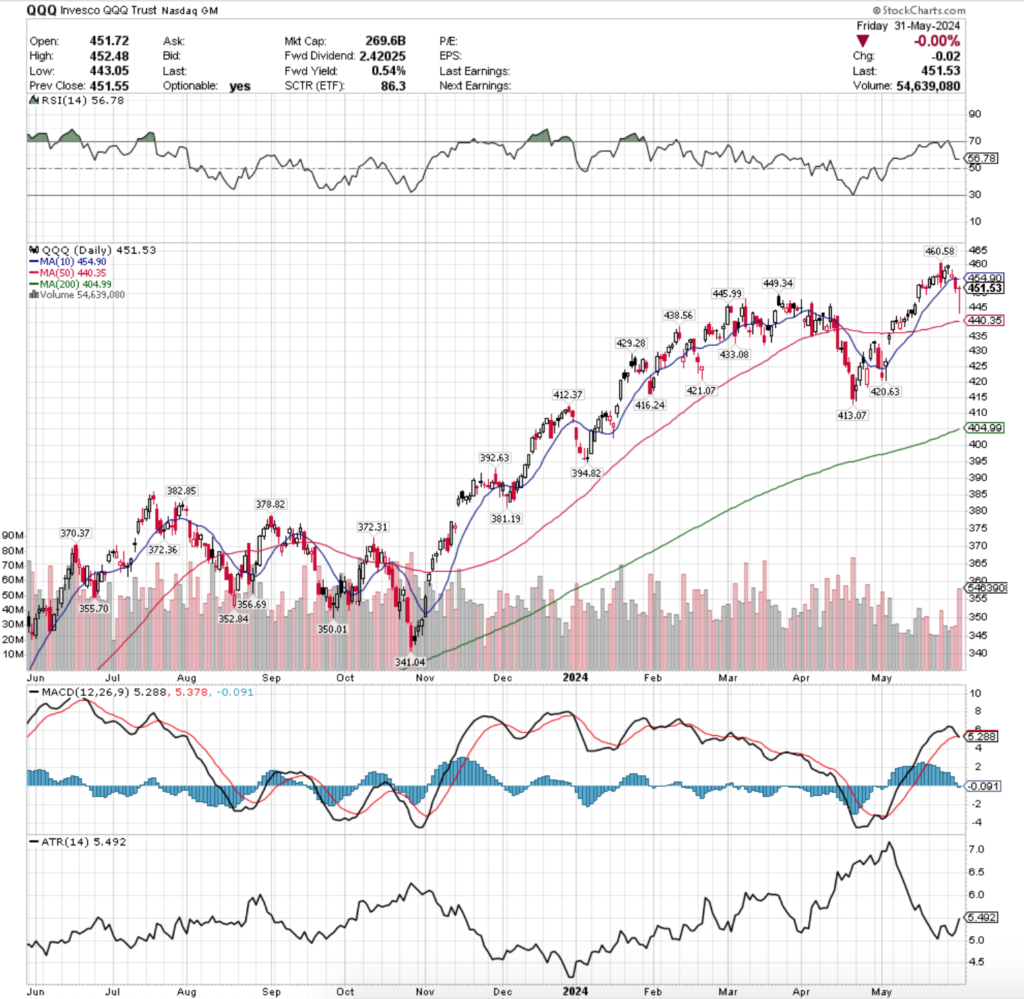
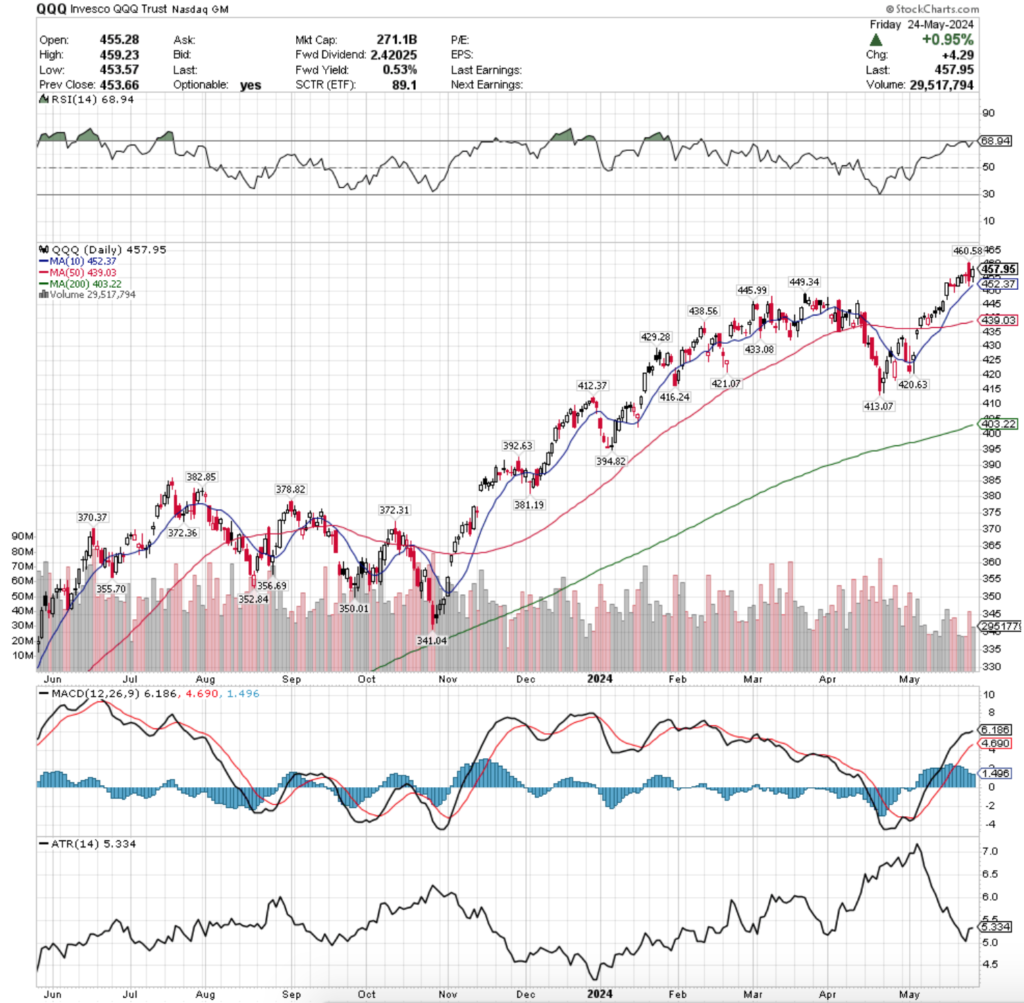
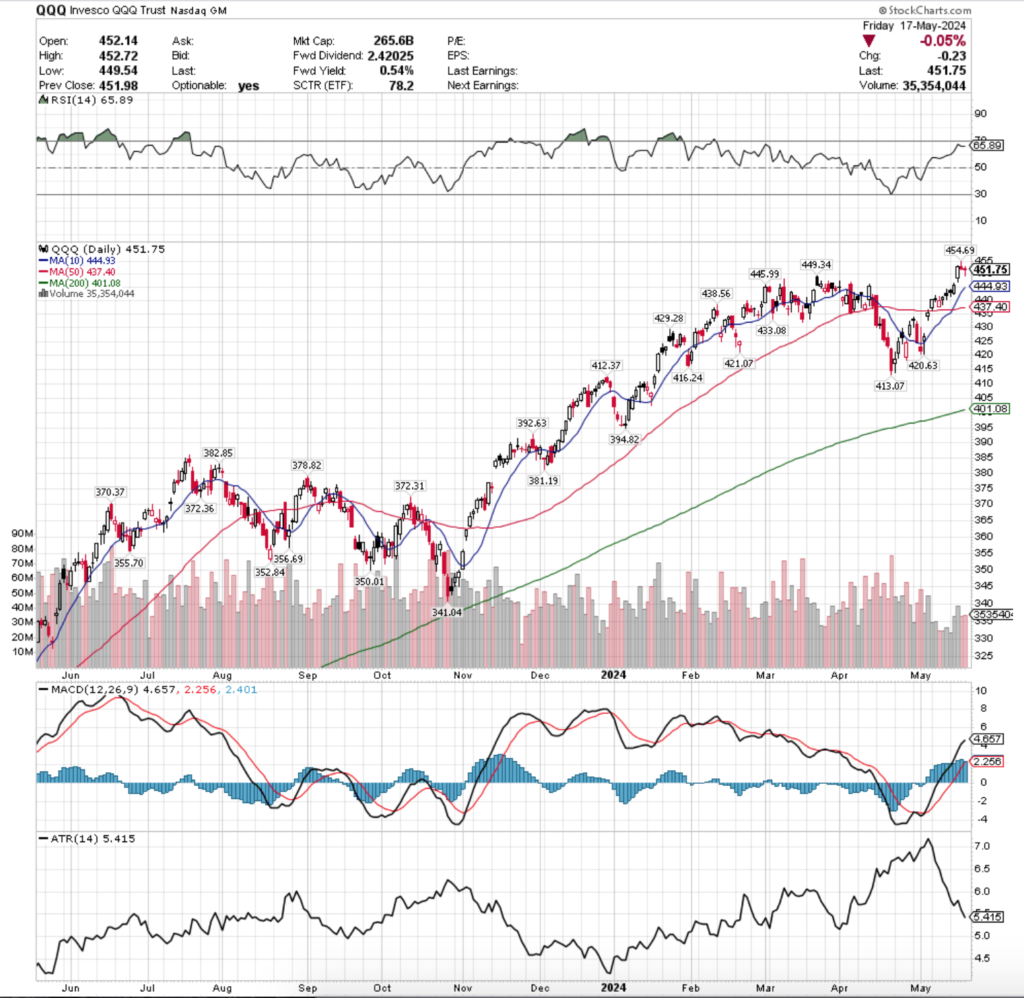
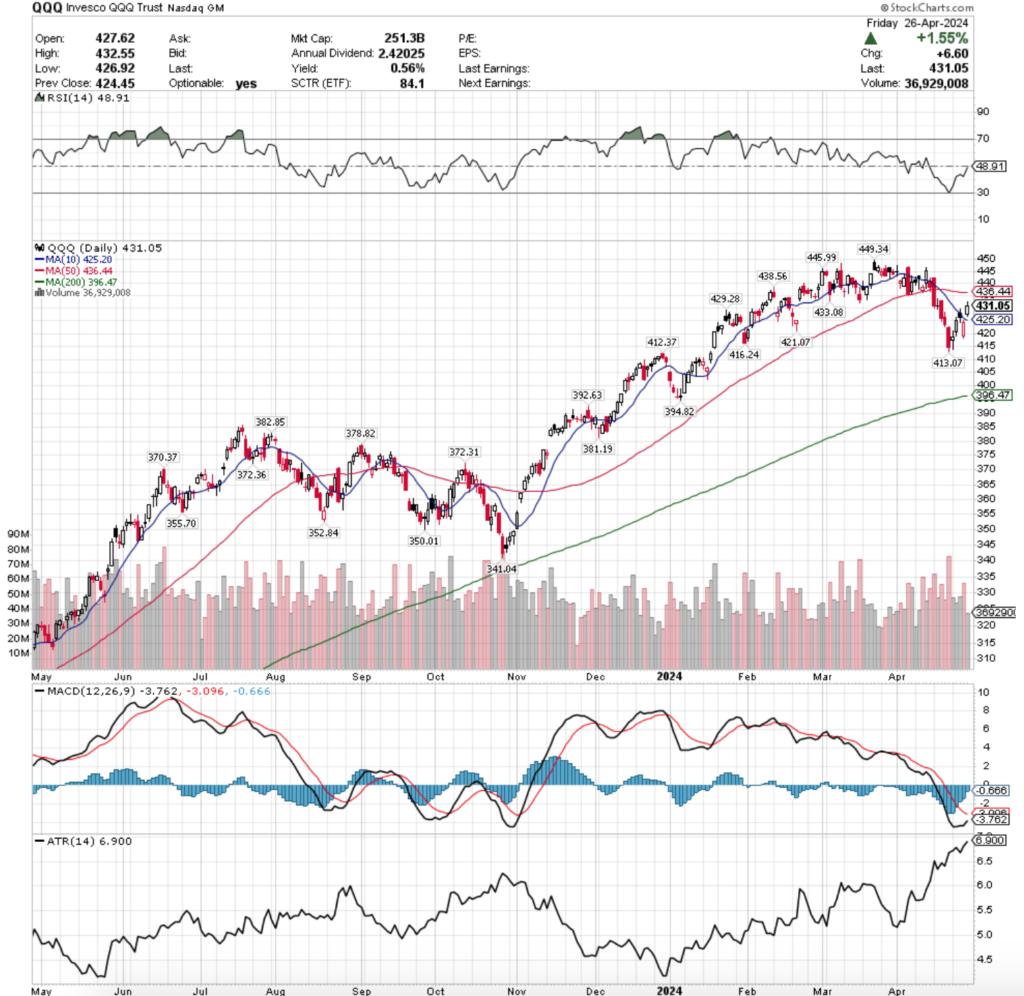
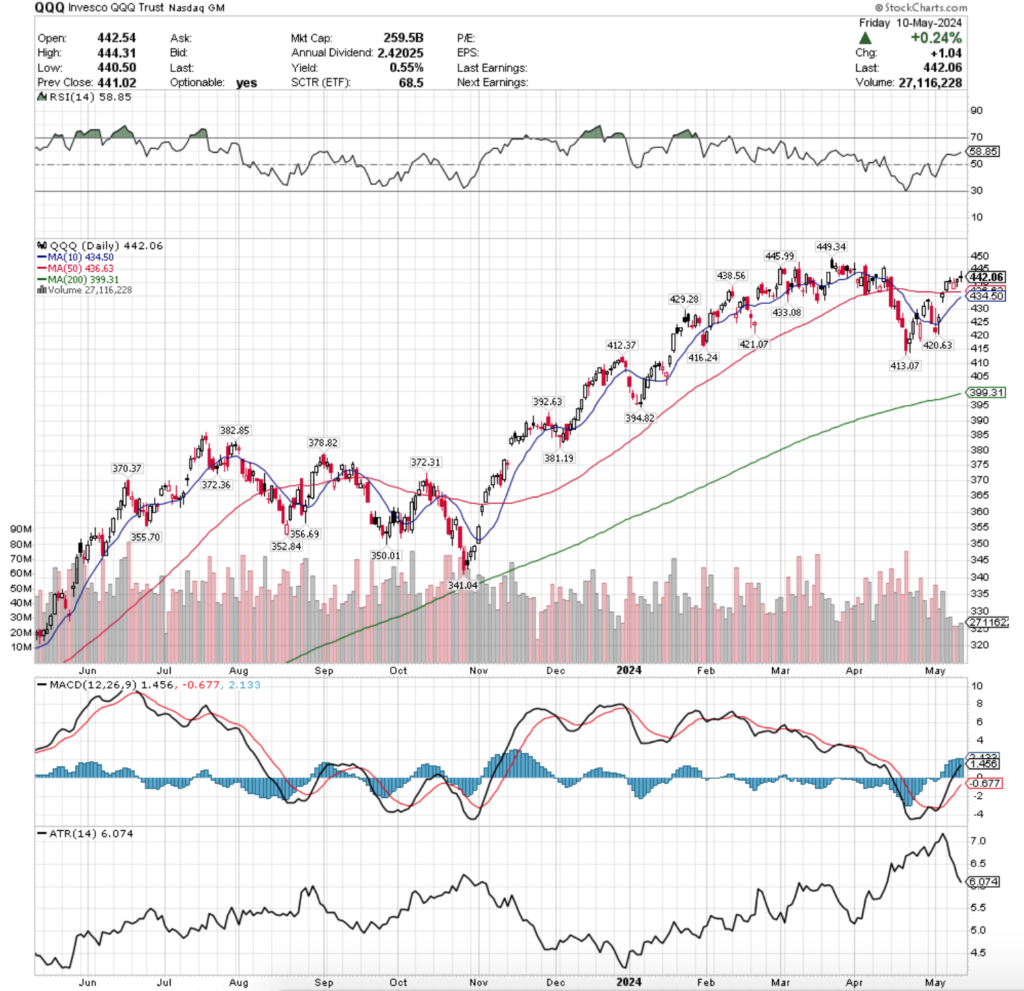
QQQ, the Invesco QQQ Trust ETF gained +3.53% over the past week, as investors favored Technology names after the NVDA earnings news, causing a gap up on Thursday’s session, after gapping done the session prior.

QQQ ETF - Invesco QQQ Trust ETF's Technical Performance Over The Past Year
QQQ ETF – Invesco QQQ Trust ETF’s Technical Performance Over The Past Year

Volumes remained relatively average compared to the year prior, with their RSI being in overbought territory at 74.35.

Their MACD is bullish, with their 10 day moving average closing in on the price range that they ended the week prior in to act as support.

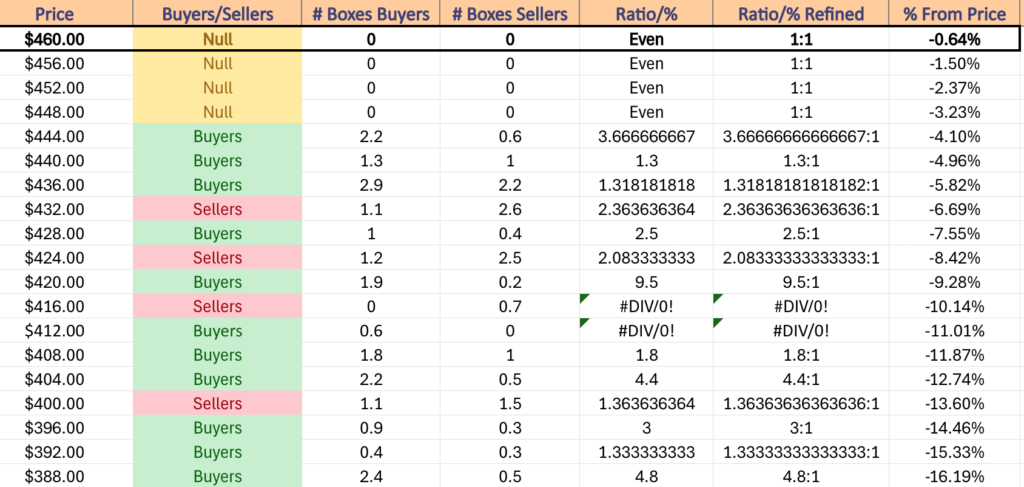
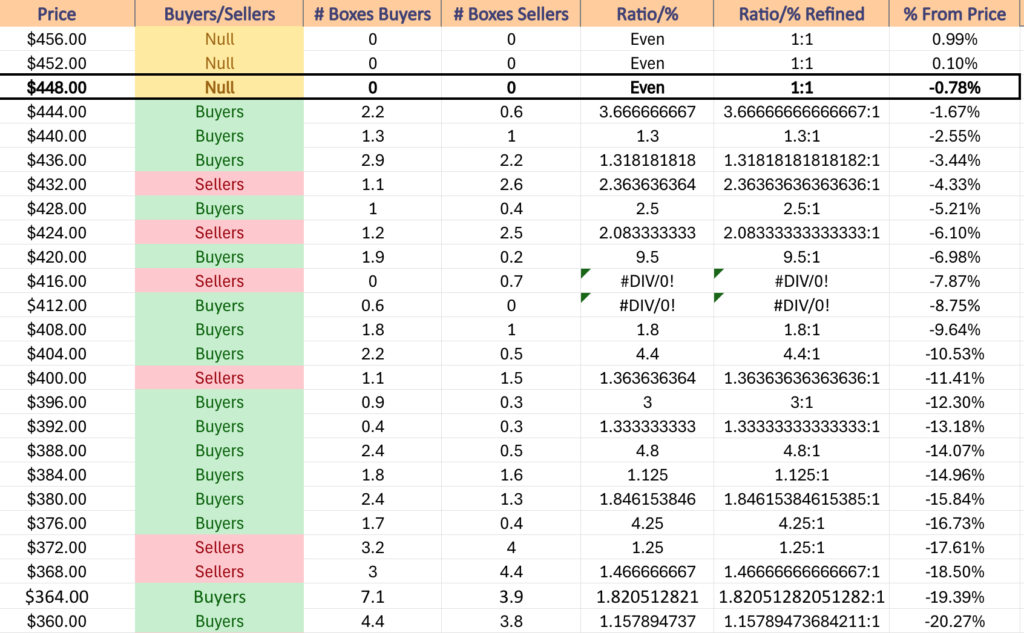
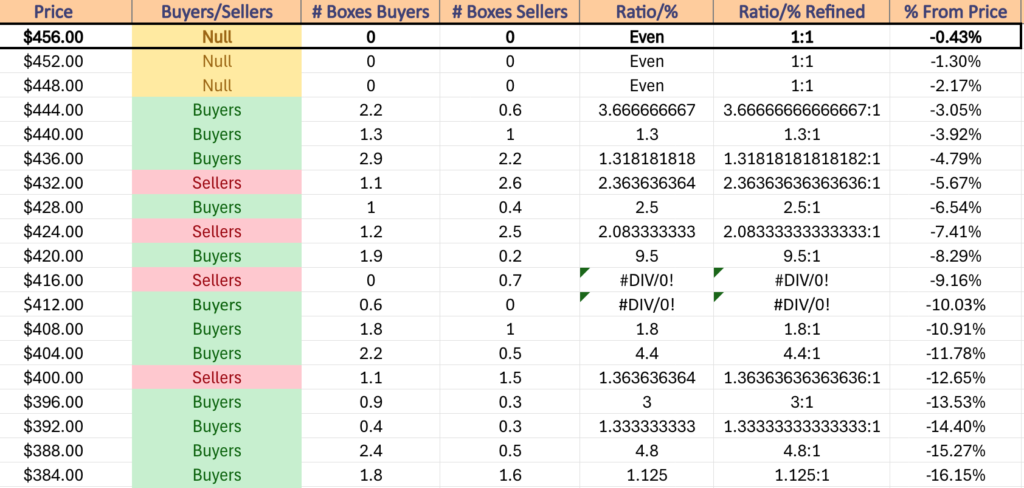
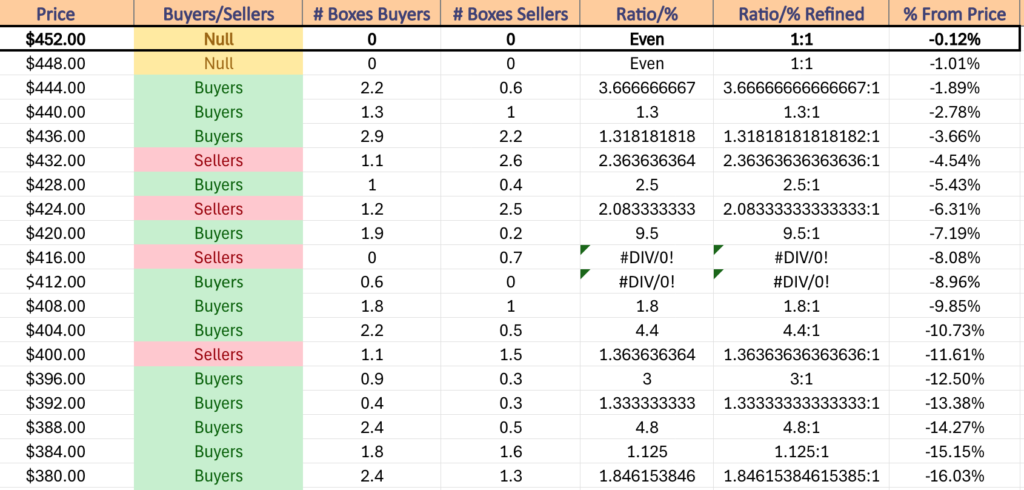
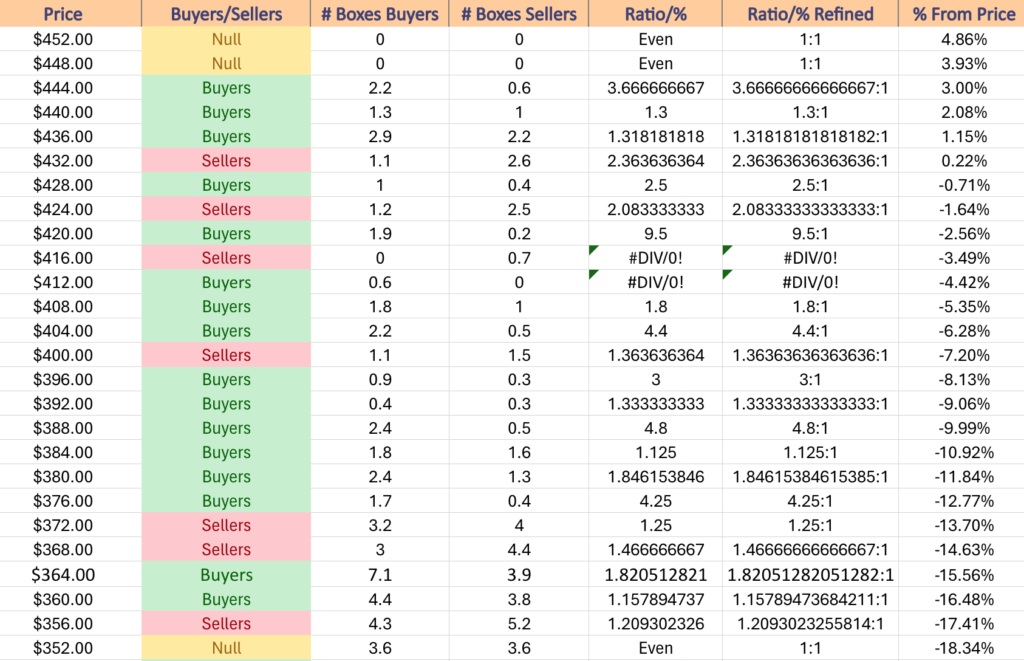
QQQ has support at the $334.96 (10 day moving average, Volume Sentiment: Sellers, 3.2:1), $332.51 (Volume Sentiment: Sellers, 3.2:1), $320.20 (Volume Sentiment: Sellers, 2:1) & $313.19/share (Volume Sentiment: Sellers, 3.64:1) price levels, with resistance overhead at the $368.99 (Volume Sentiment: Buyers, 0.75:0*), $375.07 (Volume Sentiment: Sellers, 1:0*), $378.49 (Volume Sentiment: Buyers, 1.33:1) & $401.00/share (Volume Sentiment: NULL, 0:0*)

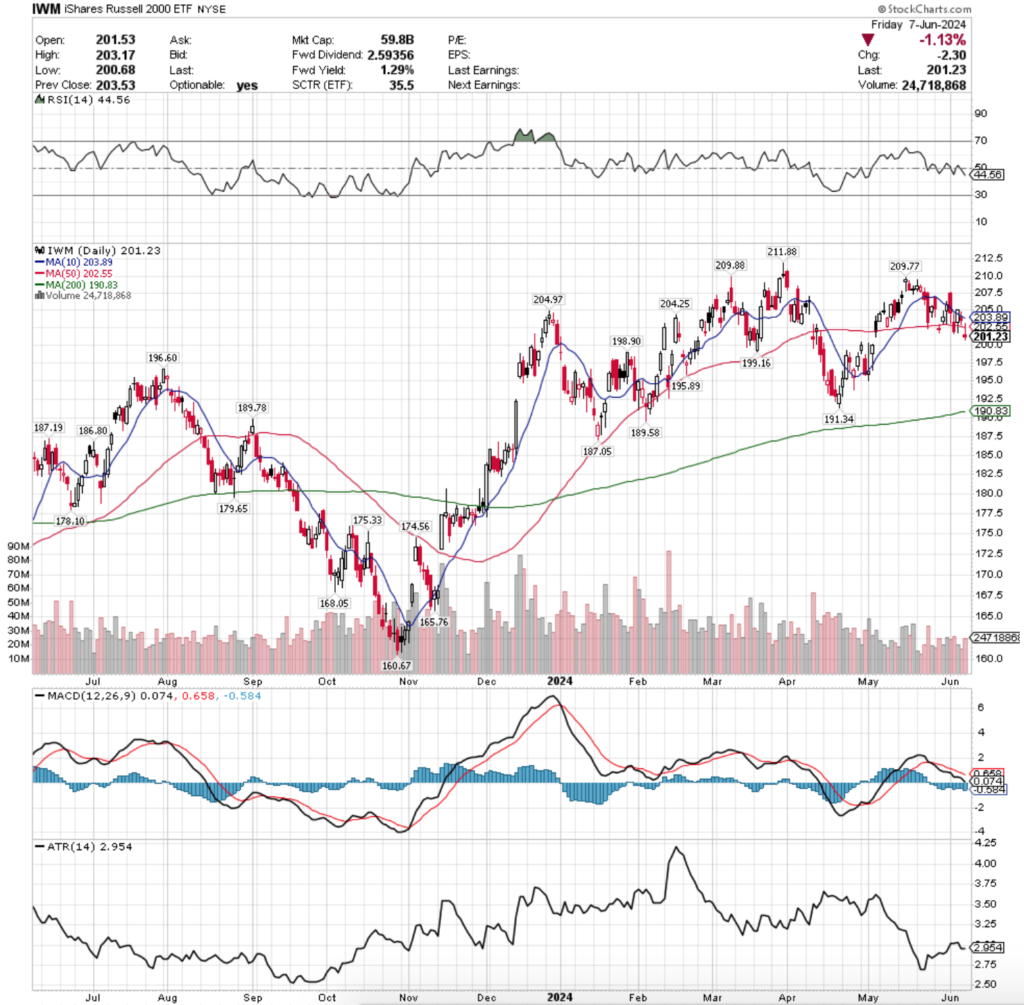
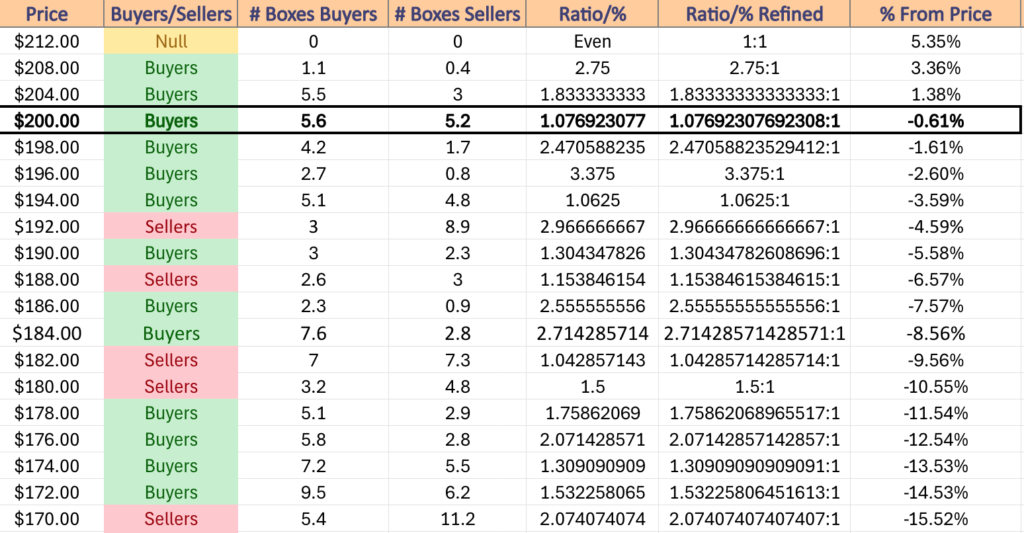
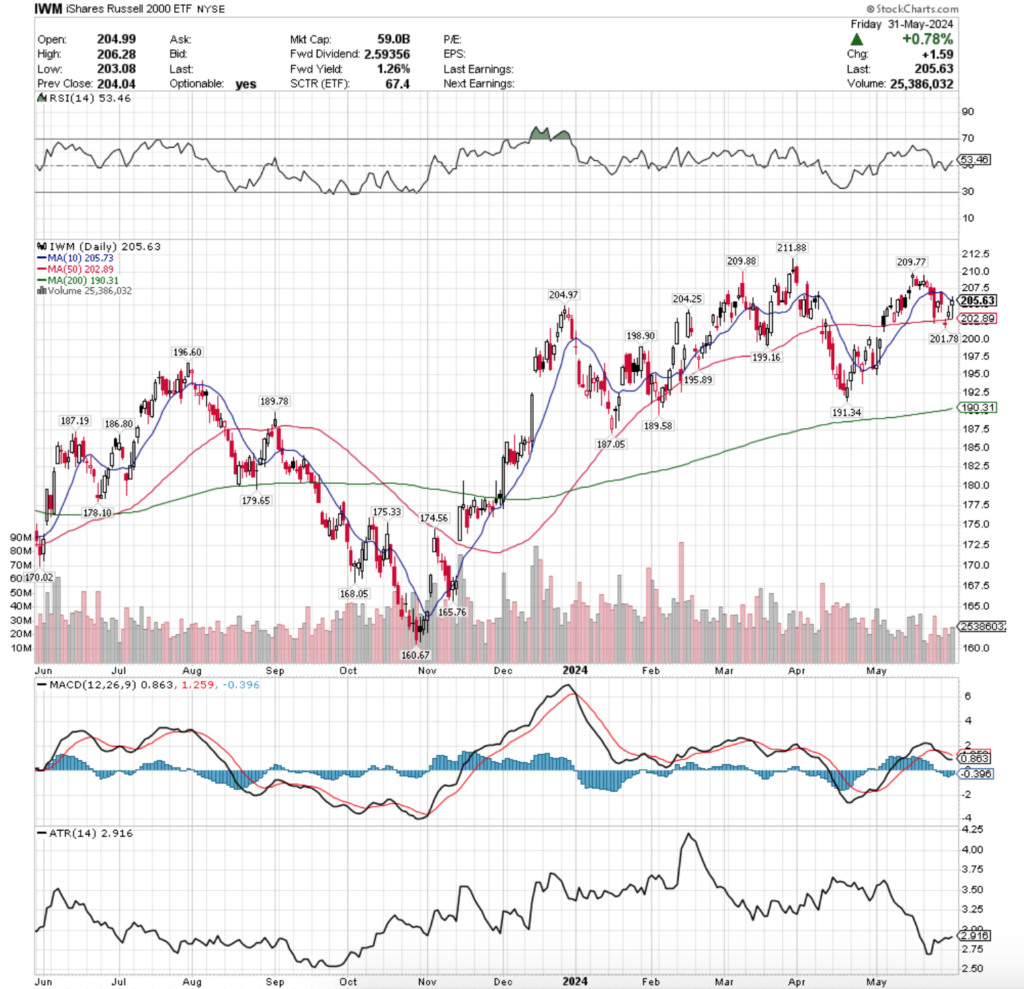
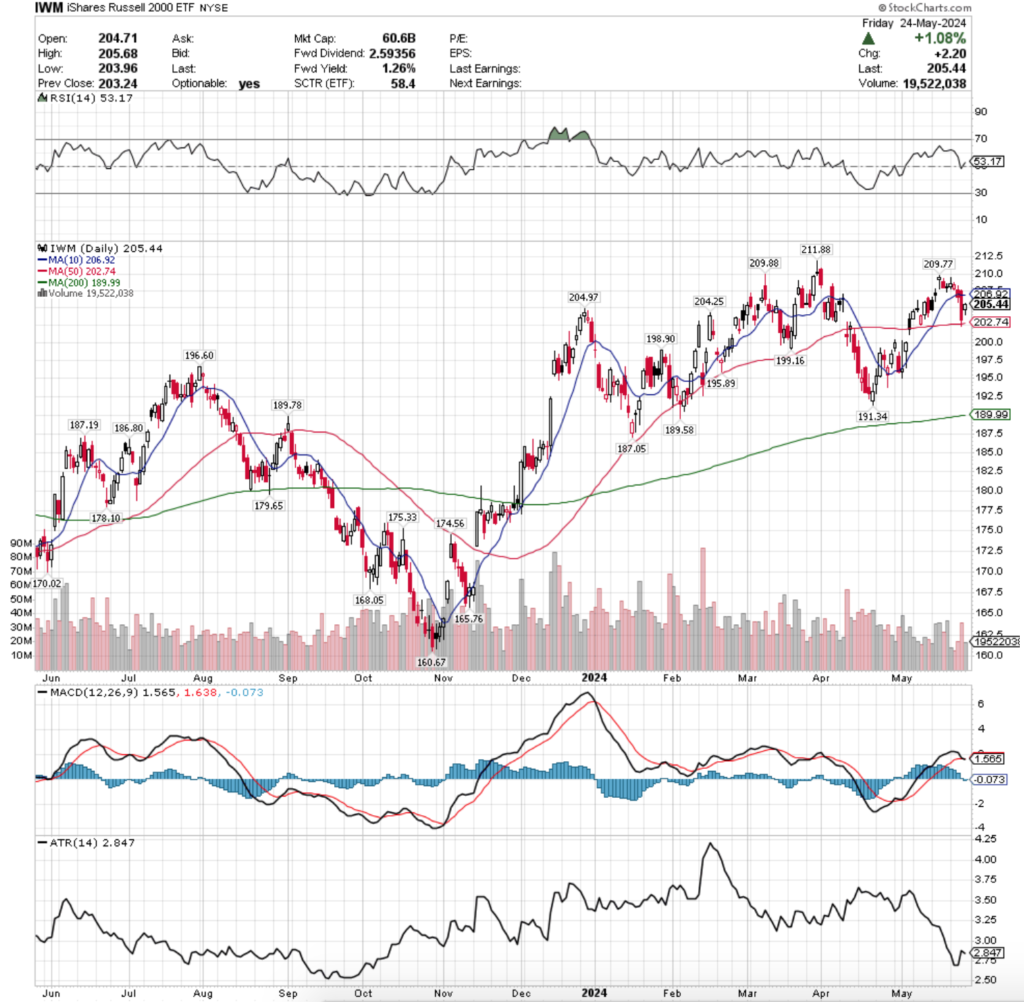
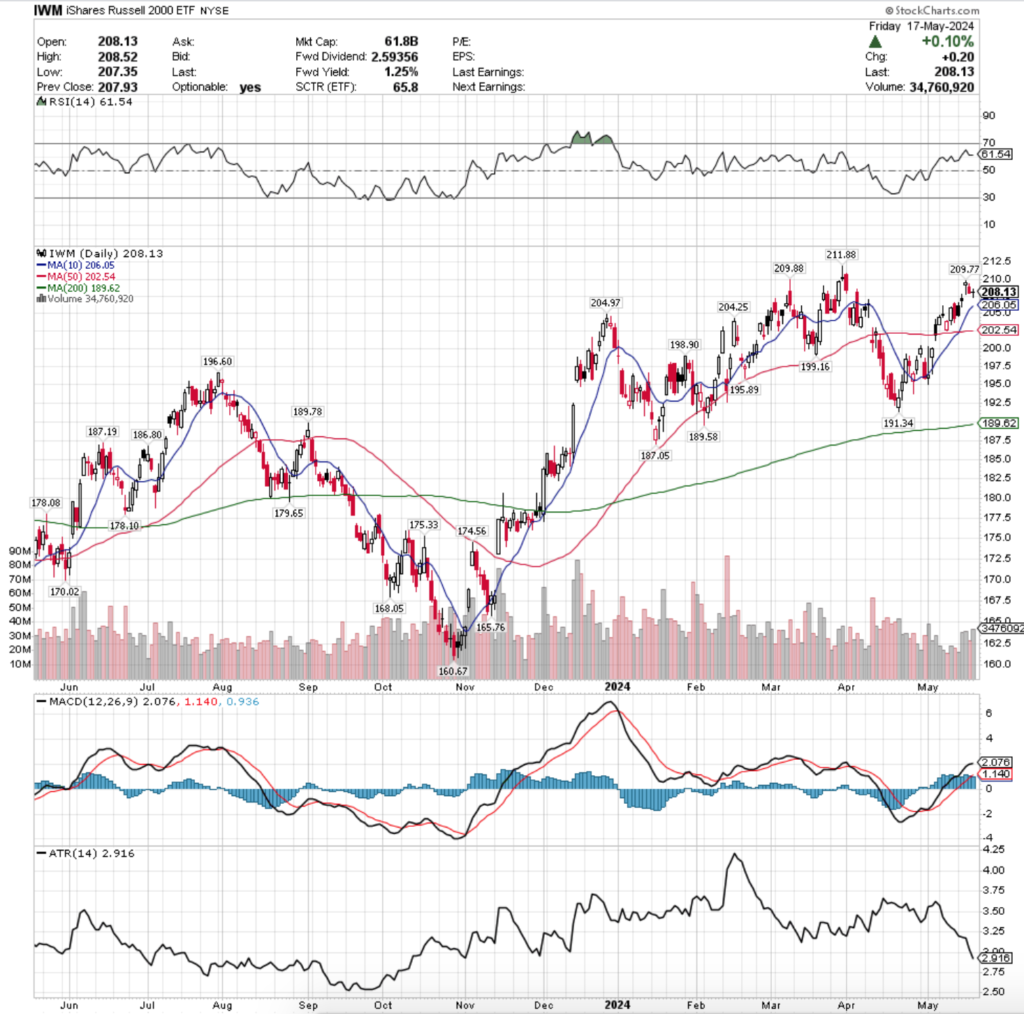
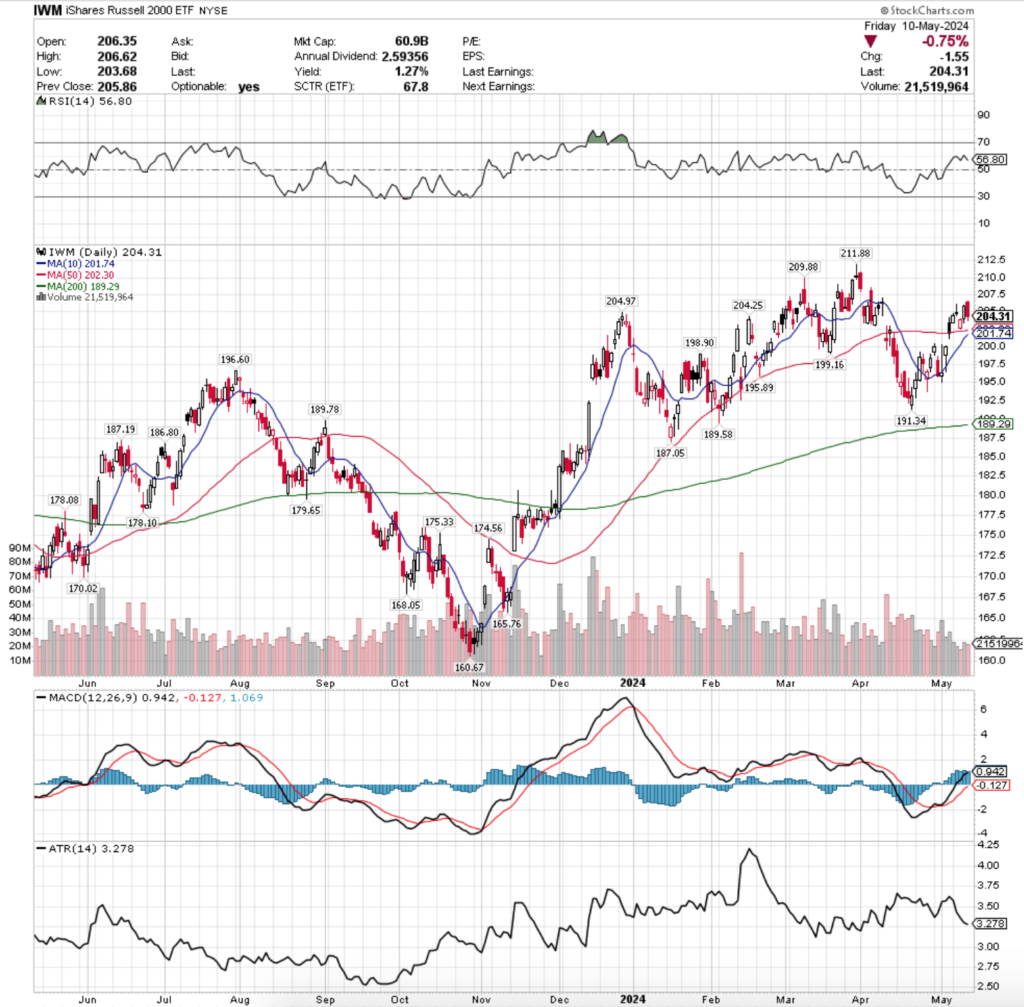
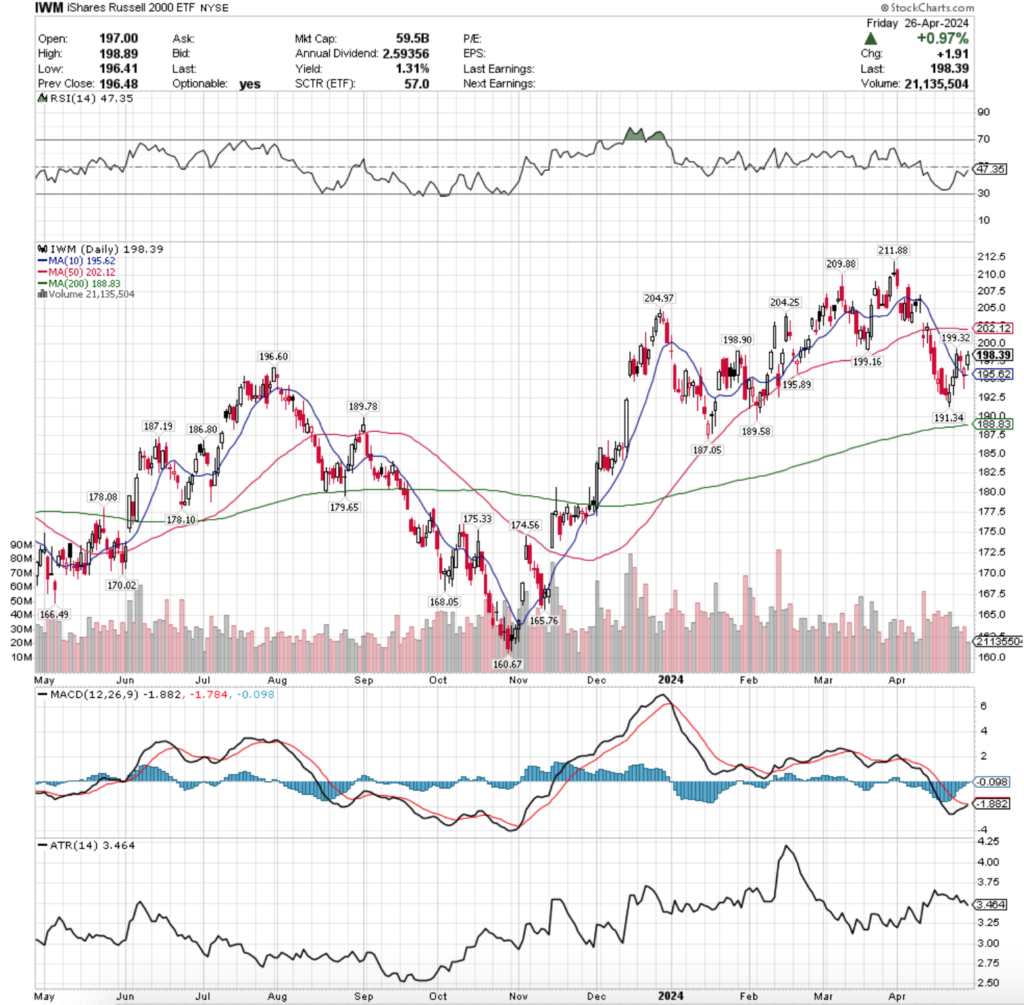
IWM, the iShares Russell 2000 ETF gained +0.02% over the past week, finishing just above where it closed on last Friday.

IWM ETF - iShares Russell 2000 ETF's Technical Performance Over The Past Year
IWM ETF – iShares Russell 2000 ETF’s Technical Performance Over The Past Year

Their RSI is neutral at 51.89, with volumes increasing week-over-week to be above average compared to the year prior.

Their MACD looks set to cross over bearishly in the coming days & their 10 & 50 day moving averages are both within Friday’s session’s candlestick.

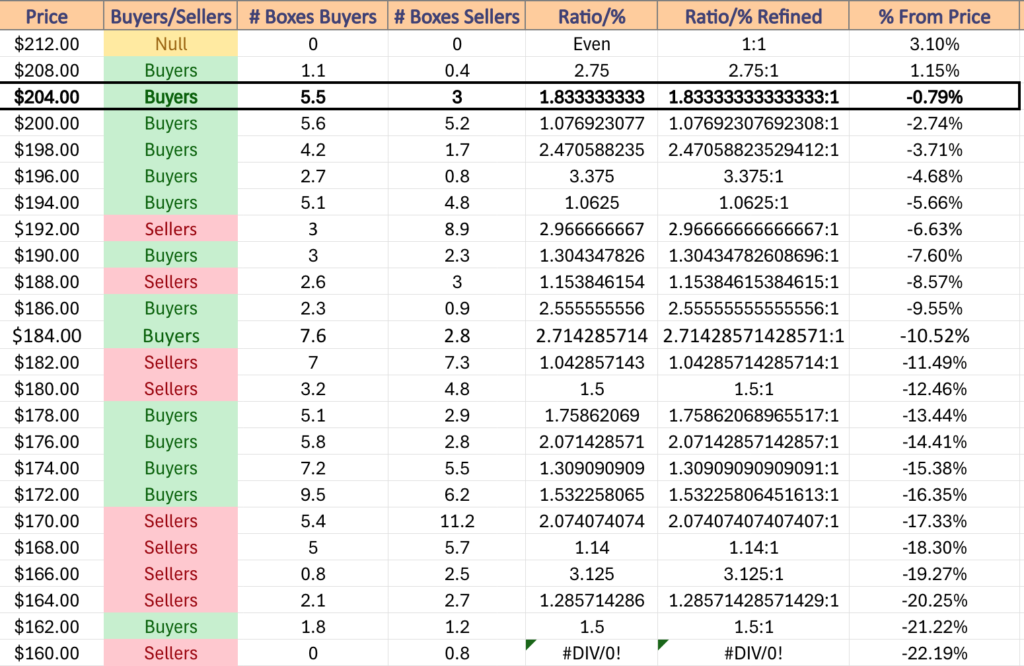
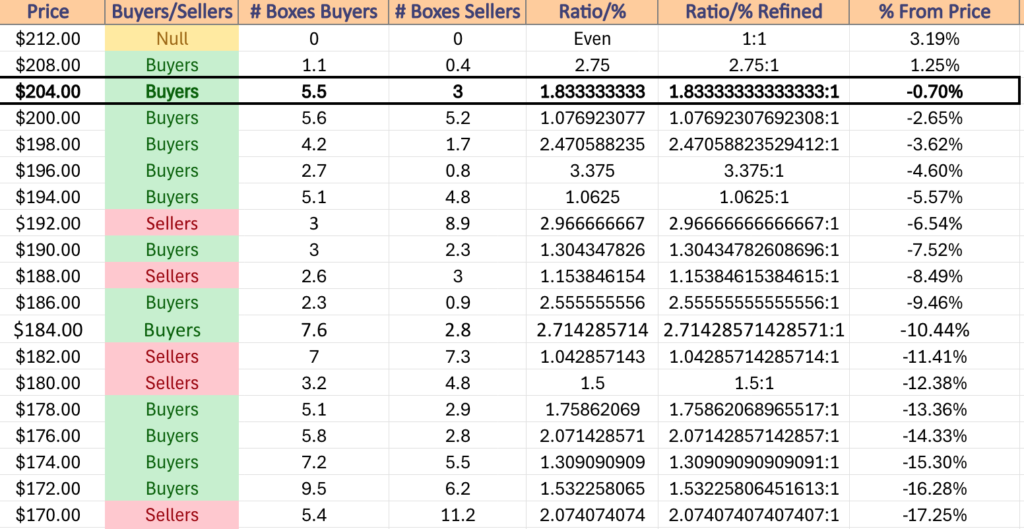
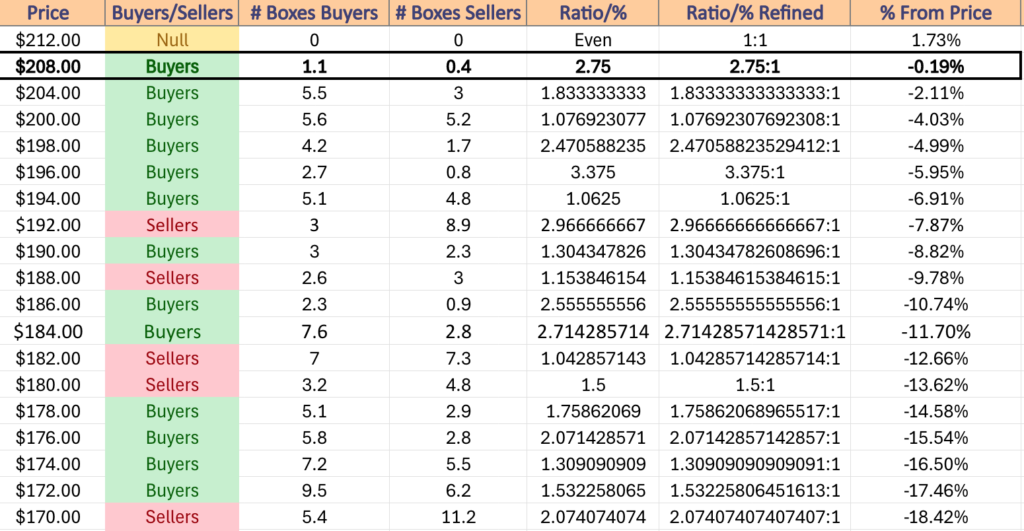
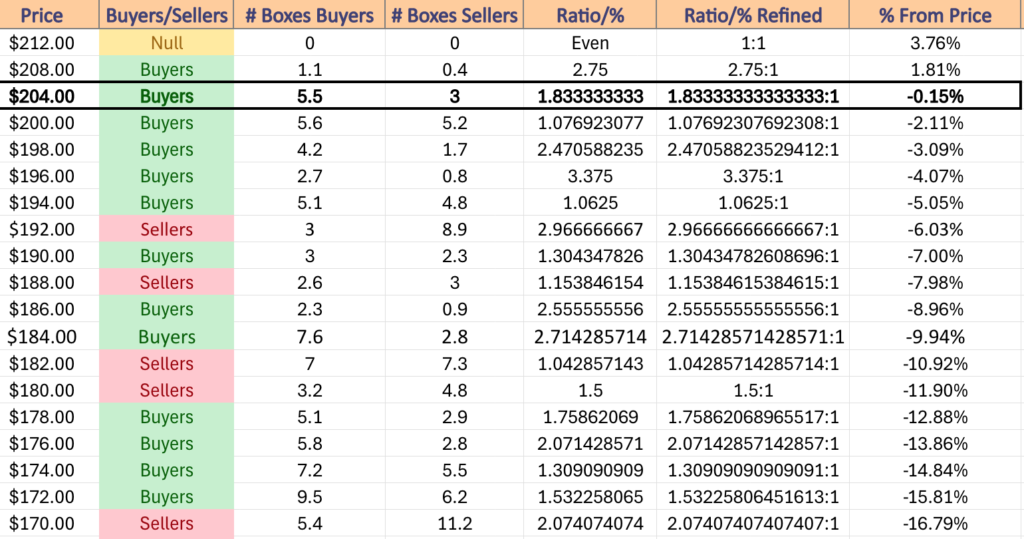
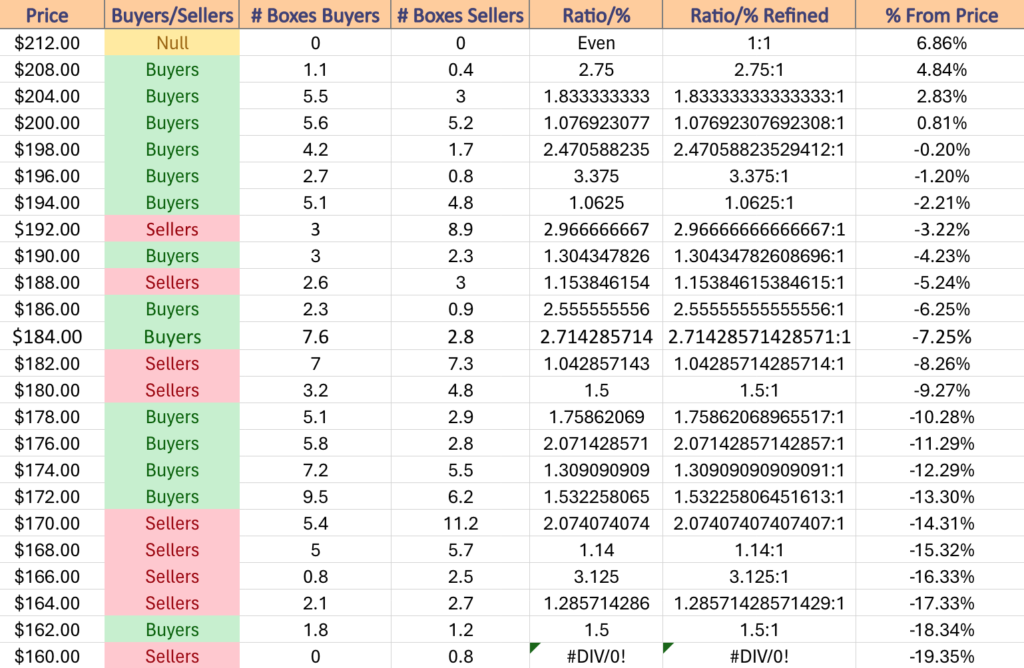
IWM has support at the $175.83 (Volume Sentiment: Buyers, 1.45:1), $175.81 (10 day moving average; Volume Sentiment: Buyers, 1.45:1), $175.77 (Volume Sentiment: Buyers, 1.45:1) & $175.13/share (Volume Sentiment: Buyers, 1.45:1) price levels, with resistance at the $179.33 (200 day moving average, Volume Sentiment: Buyers, 1.84:1), $179.78 (Volume Sentiment: Buyers, 1.84:1), $180.53 (Volume Sentiment: Sellers, 1.09:1) & $184.07/share (Volume Sentiment: Buyers, 1.75:1) price levels.

Let’s dive into some of the best & worst performing market sectors, industries & geo-locations in this week’s technical analysis rating review!

NASDAQ Technology Dividend (TDIV), Japanese Hedged Equities (DXJ), Emerging Market Dividend (EDIV) & Autonomous & Electric Vehicles (DRIV) Are All Bullishly Leading The Market

TDIV, the First Trust NASDAQ Technology Dividend Fund has gained +0.59% over the past year, with a +32.73% rebound after their 52-week low in September of 2022 (ex-distributions).

TDIV ETF - First Trust NASDAQ Technology Dividend Fund's Technical Performance Over The Past Year
TDIV ETF – First Trust NASDAQ Technology Dividend Fund’s Technical Performance Over The Past Year

Their RSI is approaching overbought territory at 65.58, on about average volume compared to the year prior.

Their MACD is bullishly climbing, with Friday’s gap up adding strength to its bullish curve.

Given market volatility & that they’re approaching their 52-week high level, investors would be smart to watch how they behave around their resistance & support levels, while eyeing where to enter a position once volatility has cooled down.

In the meantime, a protective options strategy would be beneficial, as their 2.10% distribution yield for long-term holders does not protect against much in the event of price consolidation.

TDIV has support at the $54.41 (Volume Sentiment: Sellers, 1.5:1), $54.29 (Volume Sentiment: Sellers, 1.5:1), $53.65 (Volume Sentiment: Buyers, 1.36:1) & $53.44/share (10 day moving average; Volume Sentiment: Buyers, 1.36:1) price levels, with resistance at the $55.41 (Volume Sentiment: Buyers, 1.25:1), $57.10 (Volume Sentiment: Buyers, 1.67:1), $57.12 (Volume Sentiment: Buyers, 1.67:1) & $59.19/share (Volume Sentiment: Buyers, 2:1) price levels.

TDIV Point & Figure Chart With Volume Overlay
TDIV Volume Sentiment At Current Price & Next Support & Resistance Levels

DXJ, the WisdomTree Japan Hedged Equity Fund has gained +24.44% over the past year, climbing +25.55% since their 52-week low in July of 2022 (ex-distributions).

DXJ ETF - WisdomTree Japan Hedged Equity Fund's Technical Performance Over The Past Year
DXJ ETF – WisdomTree Japan Hedged Equity Fund’s Technical Performance Over The Past Year

They have been on a relatively steady ascent since March 2023, with exception to one week in April.

DXJ’s RSI is approaching overbought at 67.8, but recent volumes have been roughly average compared to the year prior, signaling investors have confidence.

Their MACD is beginning to curl down bearishly, after Tuesday & Wednesday’s sessions produced losses for the ETF.

DXJ is at the highest price level in its history, making caution imperative to investors.

With a 3.33% distribution yield for long-term holders there is some protection against losses, but an options strategy such as selling calls or buying puts would be advisable while waiting to see how they behave at their support levels upon consolidation.

DXJ has support at the $76.21 (10 day moving average), $73.76, $72.67, $72.04/share (50 day moving average) price levels, with no overhead resistance, as they are at their all time high price level.

As the charts below show, there is very limited volume data at these levels.

DXJ Point & Figure Chart With Volume Overlay
DXJ Volume Sentiment At Current Price & Next Support & Resistance Levels

EDIV, the SPDR S&P Emerging Markets Dividend ETF has improved +4.05% over the past year, gaining +27.37% since their 52-week low in November of 2022 (ex-distributions).

EDIV ETF - SPDR S&P Emerging Markets Dividend ETF's Technical Performance Over The Past Year
EDIV ETF – SPDR S&P Emerging Markets Dividend ETF’s Technical Performance Over The Past Year

Their RSI is on the overbought end of neutral at 56.86, but volumes sunk towards the end of the week into below average levels compared to the year prior, signaling uncertainty & caution among investors.

Their MACD is currently bearish, as a result of Tuesday’s gap down & Wednesday’s losing session.

EDIV offers a 4.4% distribution yield for long-term holders, but given the uncertainty in their volume & Friday’s gap up whose candlestick closed lower than it opened, there is a need to have insurance protection in the near-term, while watching their behavior around support levels.

EDIV has support at the $27.38 (Volume Sentiment: Buyers, 1.26:1), $27.14 (Volume Sentiment: Buyers, 1.26:1), $26.85 (Volume Sentiment: 1.06:1) & $26.67/share (50 day moving average; Volume Sentiment: 1.06:1) price levels, with resistance at the $27.84 (Volume Sentiment: Buyers, 1.26:1), $28.46 (Volume Sentiment: Sellers, 1.08:1), $28.58 (Volume Sentiment: Sellers, 1.08:1) & $28.64/share (Volume Sentiment: Sellers, 1.08:1) price levels.

EDIV Point & Figure Chart With Volume Overlay
EDIV Volume Sentiment At Current Price & Next Support & Resistance Levels

DRIV, the Global X Autonomous & Electric Vehicles ETF has fallen -4.05% over the past year, but has recovered +25.54% since their 52-week low in October of 2022 (ex-distributions).

DRIV ETF - Global X Autonomous & Electric Vehicles ETF's Technical Performance Over The Past Year
DRIV ETF – Global X Autonomous & Electric Vehicles ETF’s Technical Performance Over The Past Year

Their RSI is approaching oversold territory as it climbed over 60 in Friday’s session, with volumes coming in at about average level.

Their MACD is still bullish due in part to Friday’s +2.46% session, as they look to retest the $23.74/share price level.

With a modest 1.04% distribution yield for long-term holders, there is not much cushion against losses, making an insurance policy essential while waiting to see how they fare in the near-term.

DRIV has support at the $23.62 (Volume Sentiment: Buyers, 1.45:1), $23.35 (Volume Sentiment: Buyers, 1.45:1), $23.25 (10 day moving average; Volume Sentiment: Buyers, 1.45:1), $23.09/share (Volume Sentiment: Buyers, 1.45:1) price levels, with resistance at the $23.84 (Volume Sentiment: Buyers, 1.45:1), $23.85 (Volume Sentiment: Buyers, 1.45:1), $24.29 (Volume Sentiment: Buyers, 1.87:1) & $24.94/share (Volume Sentiment: Buyers, 1.87:1) price levels.

DRIV Point & Figure Chart With Volume Overlay
DRIV Volume Sentiment At Current Price & Next Support & Resistance Levels

South Africa (EZA), Base Metals (DBB), China (GXC) & Retail (XRT) Are All Bearishly Lagging The Market

EZA, the iShares MSCI South Africa ETF has lost -18.74% over the past year, falling -23.76% since their 52-week high in May of 2022 & has recovered +5.28% since their 52-week low in October of 2022 (ex-distributions).

EZA ETF - iShares MSCI South Africa ETF's Technical Performance Over The Past Year
EZA ETF – iShares MSCI South Africa ETF’s Technical Performance Over The Past Year

Their RSI just exited official oversold territory & currently sites at 30.46, but very timid below average volume last week is signaling that there is still uncertainty among investors regarding their near-term performance prospects, which is confirmed by Friday’s doji candlestick.

Their MACD is still in a bearish downtrend, which became steeper after Thursday’s gap down session, where they’ll try to hold $37.20/share at support.

Despite a 4.41% cushion for long-term holders in the form of a distribution yield, a wait & see approach appears best while watching how EZA behaves at its support levels in the coming weeks, unless you are holding an insurance position with options as a hedge.

EZA has support at the $37.20 (Volume Sentiment: Sellers, 1.33:1), $36.47 (Volume Sentiment: 2.72:1), $35.35 (Volume Sentiment: 1.5:1) & $35.08/share (Volume Sentiment: 1.5:1) price levels, with resistance at the $37.72 (Volume Sentiment: Sellers, 1.33:1), $37.91 (Volume Sentiment: Sellers, 1.33:1), $38.43 (Volume Sentiment: Sellers 1.1:1) & $38.59/share (Volume Sentiment: Sellers 1.1:1) price levels.

EZA Point & Figure Chart With Volume Overlay
EZA Volume Sentiment At Current Price & Next Support & Resistance Levels

DBB, the Invesco DB Base Metals Fund ETF has fallen -21.82% over the past year, losing -24.19% since their 52-week high in June of 2022, but has reclaimed +3.05% since their 52-week low in May of 2023 (ex-distributions).

DBB ETF - Invesco DB Base Metals Fund ETF's Technical Performance Over The Past Year
DBB ETF – Invesco DB Base Metals Fund ETF’s Technical Performance Over The Past Year

Their RSI has just recovered from oversold territory & is currently at 37.65 & their MACD has smoothed & looks to cross over bullishly in early next week after Friday’s gap up of +2.46%.

Volumes have been very low compared to average this past week, as investors will see how they feel about the $17.40-17.93 price range, with the current signal being uncertainty.

DBB’s modest 1.02% distribution yield for long-term holders provides limited downside protection, making it wisest to wait to see how their support levels hold up, with some type of hedge against possible poor performance.

DBB has support at the $17.51 (Volume Sentiment: Sellers, 1.06:1), $17.40 (Volume Sentiment: Sellers, 1.09:1), $17.31 (Volume Sentiment: Sellers, 1.09:1) & $17.27/share (Volume Sentiment: Sellers, 1.09:1) price levels, with resistance at the $18.10 (10 day moving average; Volume Sentiment: Buyers, 1.2:1), $18.15 (Volume Sentiment: Buyers, 1.2:1), $18.58 (Volume Sentiment: Buyers, 1.15:1) & $18.86/share (Volume Sentiment: Buyers, 1.15:1) price levels.

DBB Point & Figure Chart With Volume Overlay
DBB Volume Sentiment At Current Price & Next Support & Resistance Levels

GXC, the SPDR S&P China ETF has shed -9.21% over the past year, declining -21.39% from their 52-week high in June of 2022, but has reclaimed +22.85% since their 52-week low in October of 2022 (ex-distributions).

GXC ETF - SPDR S&P China ETF's Technical Performance Over The Past Year
GXC ETF – SPDR S&P China ETF’s Technical Performance Over The Past Year

Their MACD is still in bearish descent, despite their RSI spiking after Friday’s +1.5% session to settle at 36.66.

Volumes has been above average the last 3 sessions, with Friday’s session attempting to fill in the gap down caused by Thursday’s session.

GXC offers a 2.84% distribution yield for long-term shareholders, which provides a slight cushion against losses, but they do not appear to be out of the woods just yet, as investors should be eyeing where to target an entry in less volatile markets.

GXC has support at the $73.55 (Volume Sentiment: Sellers, 36:1), $72.46 (Volume Sentiment: Buyers, 2.75:1), $70.08 (Volume Sentiment: Buyers, 4.73:1) & $69.21/share (Volume Sentiment: Sellers, 2:1) price levels, with resistance at the $74.63 (Volume Sentiment: Buyers, 4.33:1), $76.03 (Volume Sentiment: Sellers, 36:1), $76.23 (10 day moving average; Volume Sentiment: Sellers, 36:1) & $76.71/share (Volume Sentiment: Sellers, 36:1) price levels.

GXC Point & Figure Chart With Volume Overlay
GXC Volume Sentiment At Current Price & Next Support & Resistance Levels

XRT, the SPDR S&P Retail ETF has lost -16.06% over the past year, losing -22.41% since their 52-week high in April of 2022, while climbing back +11.19% from their 52-week low in September of 2022 (ex-distributions).

XRT ETF - SPDR S&P Retail ETF's Technical Performance Over The Past Year
XRT ETF – SPDR S&P Retail ETF’s Technical Performance Over The Past Year

Their RSI climbed to 38.22 after Friday’s +0.83% session, which had higher than average volume.

Their MACD is still bearish, but is flatting out to attempt a bullish cross in the coming week.

XRT’s 2.41% distribution yield is a small cushion against potential losses, but unless you’re hedging against a position there is still more risk than worth taking here, but eyeing their behavior at support will give clues as to what levels to buy at when markets have calmed down.

XRT has support at the $58.01 (Volume Sentiment: Sellers, 2.9:1), $57.61 (Volume Sentiment: Sellers, 1.93:1), $57.28 (Volume Sentiment: Sellers, 1.93:1) & $56.44/share (Volume Sentiment: Sellers, 20:1) price levels, with resistance overhead at the $58.60 (Volume Sentiment: Sellers, 2.9:1), $58.80 (Volume Sentiment: Sellers, 2.9:1), $58.97 (Volume Sentiment: Sellers, 2.9:1) & $59.19/share (Volume Sentiment: Sellers, 1.47:1) price levels.

XRT Point & Figure Chart With Volume Overlay

XRT Point & Figure Chart With Volume Overlay
XRT Volume Sentiment At Current Price & Next Support & Resistance Levels

Tying It All Together

Monday the markets will be closed in observance of Memorial Day, so there will be no data being reported, nor earnings reports; thank you to all readers who have served our country.

Tuesday’s data kicks off with the S&P Case-Schiller Home Price Index (20 cities) at 9 am, followed by Consumer Confidence at 10 am & Richmond Fed President Barkin speaking at 1pm.

Tuesday’s earnings include Ambarella, Box, Canopy Growth, Hewlett Packard Enterprise, HP & Sportsman’s Warehouse.

ADP Employment data is reported Wednesday at 8:15 am, followed by the Chicago Business Barometer at 9:45 am, Job Openings at 10 am, Philadelphia Fed President Patrick Harker speaking at 12:30 pm & the Federal Reserve Beige Book at 2pm.

Salesforce is the most anticipated earnings call on Wednesday, along with Advanced Auto Parts, C3.ai, Chewy, Conn’s, CrowdStrike, GameStop, NetApp, Nordstrom, Victoria’s Secret & others.

Thursday at 8:30 am we get Initial Jobless Claims & U.S. Productivity data, with IS&P U.S. Manufacturing PMI data at 9:45 am, ISM Manufacturing & Construction Spending data at 10 am & Philadelphia Fed President Patrick Harker speaking at 1pm.

Thursday’s earnings calls include Broadcom, Lululemon Athletica, Cooper, Dell Technologies, Dollar General, Five Below, Hormel Foods, Macy’s, MongoDB, VMware & more.

Friday the week winds down at 8:30 am when we get U.S. Employment Report, U.S. Unemployment Rate, U.S. Hourly Wages & Hourly Wages Year-Over-Year reported, with limited earnings calls being held.

See you back here next week!

*** I DO NOT OWN SHARE OR OPTIONS CONTRACT POSITONS IN SPY, QQQ, IWM, TDIV, DXJ, EDIV, DRIV, EZA, DBB, GXC or XRT AT THE TIME OF PUBLISHING THIS ARTICLE ***

Old Dominion Freight Line, Inc. ODFL Stock Analysis

Old Dominion Freight Line, Inc. stock trades under the ticker ODFL & has shown recent bullishness that traders & investors should research further into for when market volatility has subsided.

ODFL stock closed at $310.19/share on 5/25/2023.

Old Dominion Freight Line, Inc. ODFL Stock’s Technical Performance Broken Down

Old Dominion Freight Line, Inc. ODFL Stock's Technical Performance Over The Past Year
Old Dominion Freight Line, Inc. ODFL Stock’s Technical Performance Over The Past Year

ODFL Stock Price: $310.19

10 Day Moving Average: $303.87

50 Day Moving Average: $324.60

200 Day Moving Average: $305.02

RSI: 46.99

MACD: -6.798, -7.300, 0.502

Yesterday, ODFL stock completed a bullish MACD crossover, gaining +3.23% on the day’s session.

Their RSI is returning back to neutral from being near over-sold levels, with recent trading levels being about average compared to the year prior.

Investors would be best suited to watch how ODFL behaves around support levels in the coming weeks in order to figure out where they may like to enter a position at a less volatile time.

ODFL has support at the $308.87, $305.02 (200 day moving average), $304.37 & $303.87/share (10 day moving average) price levels, with resistance at the $320.85, $321.41, $322.62 & $322.66/share price levels.

Old Dominion Freight Line, Inc. ODFL Stock As A Long-Term Investment

Investors with longer time horizons will like ODFL stock’s 25.08 P/E (ttm), but will find their 9.20 P/B (mrq) to be higher than they’d like to see.

They recently reported -3.7% Quarterly Revenue Growth Y-o-Y, with -4.9% Quarterly Earnings Growth Y-o-Y, which investors should look closer into as well before investing.

Their balance sheet looks appealing, with $232.43M of Total Cash (mrq) & $99.97M of Total Debt (mrq).

ODFL stock pays a modest 0.43% dividend, which appears to be sustainable in the long-run, as their payout ratio is 10.69%.

77.48% of ODFL stock’s outstanding share float is owned by institutional investors.

Old Dominion Freight Line, Inc. ODFL Stock As A Short-Term Trade Using Options

Traders with shorter time horizons can trade options to profit from price movements in ODFL stock, while protecting their portfolios from volatility.

I am looking at the contracts with the 6/16 expiration date.

The $310, $290 & $280 call options are all in-the-money, with the former being more liquid than the latter two strikes.

The $320, $330 & $340 puts are also all in-the-money, listed from highest to lowest level of open interest.

Tying It All Together

ODFL stock has many interesting characteristics that traders & investors will like.

Investors will like their balance sheet & modest, but sustainable dividend yield, but may want to look closer into their recent growth metrics before investing at a less volatile time.

Traders will like their recent technical performance, as well as how liquid their options are.

Overall, it is worth taking a closer look to see how ODFL stock fits into your portfolio strategy.

*** I DO NOT OWN SHARES OR OPTIONS CONTRACT POSITIONS IN ODFL STOCK AT THE TIME OF PUBLISHING THIS ARTICLE ***

Exxon Mobil Corp. XOM Stock Analysis

Exxon Mobil Corp. stock trades under the ticker XOM & has shown recent bullishness that traders & investors should research further into for when market volatility has reduced.

XOM stock closed at $107.50/share on 5/24/2023.

Exxon Mobil Corp. XOM Stock’s Technical Performance Broken Down

Exxon Mobil Corp. XOM Stock's Technical Performance Over The Past Year
Exxon Mobil Corp. XOM Stock’s Technical Performance Over The Past Year

XOM Stock Price: $107.59

10 Day Moving Average: $105.31

50 Day Moving Average: $109.16

200 Day Moving Average: $104.79

RSI: 48.68

MACD: -1.503, -1.605, 0.103

Yesterday, XOM stock completed a bullish MACD crossover, gaining +1.12% on the day’s session.

Their RSI is about neutral at 48.68, but recent trading volumes have been below average compared to the year prior, signaling uncertainty by investors about XOM in the near-term.

Yesterday’s spinning top candlestick, along with the others of the past two weeks confirm that there is hesitance on investors’ part to buy XOM currently, making it best to look to see how they behave at support levels in the coming weeks.

XOM has support at the $106.36, $105.74, $105.31 (10 day moving average) & $104.79/share (200 day moving average) price levels, with resistance at the $108.64, $109.16 (50 day moving average), $112.79 & $115.88/share price levels.

Exxon Mobil Corp. XOM Stock As A Long-Term Investment

Long-term focused investors will like XOM stock’s valuation metrics, with a 7.31 P/E (ttm) & a 2.2 P/B (mrq).

They recently reported -4.3% Quarterly Revenue Growth Y-o-Y, with 108.6% Quarterly Earnings Growth Y-o-Y.

Their balance sheet should also be reviewed more thoroughly before investing, with $32.65B of Total Cash (mrq) & $41.45B of Total Debt (mrq).

XOM pays a 3.36% dividend, which appears to be sustainable in the long-run, as their payout ratio is 24.24%.

60.91% of XOM stock’s outstanding share float is owned by institutional investors.

Exxon Mobil Corp. XOM Stock As A Short-Term Trade Using Options

Traders with shorter time horizons can trade options to profit from price movements in XOM stock, while protecting their portfolios from broader market volatility.

I am looking at the contracts with the 6/16 expiration date.

The $105, $107 & $106 calls options are all in-the-money, listed from highest to lowest level of open interest.

The $110, $108 & $111 puts are also in-the-money, with the former being more liquid than the latter two strike prices.

Tying It All Together

XOM stock has many interesting attributes that traders & investors will find appealing.

Investors will like their stable dividend, along with their valuation metrics, but may want to look closer into their balance sheet & recent growth performance.

Traders will like their recent technical performance & liquid options.

All-in-all, it is worth taking a closer look at XOM stock to see how it fits into your portfolio strategy.

*** I DO NOT OWN SHARES OR OPTIONS CONTRACT POSITIONS IN XOM STOCK AT THE TIME OF PUBLISHING THIS ARTICLE ***

Archer Daniels Midland Co. ADM Stock Analysis

Archer Daniels Midland Co. stock trades under the ticker ADM & has shown recent bullish behavior that traders & investors should research further into for when market volatility has been reduced.

ADM stock closed at $75.05/share on 5/23/2023.

Archer Daniels Midland Co. ADM Stock’s Technical Performance Broken Down

Archer Daniels Midland Co. ADM Stock's Technical Performance Over The Past Year
Archer Daniels Midland Co. ADM Stock’s Technical Performance Over The Past Year

ADM Stock Price: $75.05

10 Day Moving Average: $73.99

50 Day Moving Average: $77.12

200 Day Moving Average: $84.21

RSI: 47.38

MACD: -1.209, -1.266, 0.056

Yesterday, ADM stock completed a bullish MACD crossover, closing the day +2.19%.

Their RSI is approaching neutral bullishly & recent trading volumes have been about average compared to the year prior.

Investors should be watching how ADM stock behaves around its support levels in the coming weeks to determine where they would like to enter a position once market volatility has calmed down.

ADM stock has support at the $73.99 (10 day moving average), $73.54, $71.75 & $70.11/share price levels, with resistance at the $76.72, $77.12 (50 day moving average), $78.92 & $82.46/share price levels.

Archer Daniels Midland Co. ADM Stock As A Long-Term Investment

Long-term focused investors will like ADM stock’s valuation metrics, with a 9.84 P/E (ttm) & a 1.71 P/B (mrq).

They recently reported +1.8% Quarterly Revenue Growth Y-o-Y, with +11% Quarterly Earnings Growth Y-o-Y.

ADM’s balance sheet will require a more thorough review, with $899M of Total Cash (mrq) & $11.55B of Total Debt (mrq).

ADM pays a 2.25% dividend, which appears to be sustainable as their payout ratio is 20.7%.

83.4% of ADM stock’s outstanding share float is owned by institutional investors.

Archer Daniels Midland Co. ADM Stock As A Short-Term Trade Using Options

Traders with shorter time horizons can trade options to profit from ADM stock’s price movements, while protecting their portfolios from volatility.

I am looking at the contracts with the 6/16 expiration date.

The $75, $72.50 & $74 call options are all in-the-money, listed from highest to lowest level of open interest.

The $77.50, $79 & $77 puts are also in-the-money, with the former being more liquid than the latter strikes.

Tying It All Together

ADM stock has many unique attributes that traders & investors will find appealing.

Investors will like their valuation metrics, as well as their sustainable dividend.

Traders will like their recent technical performance, as well as their liquid options.

Overall, it is worth taking a closer look at how ADM stock fits into your portfolio strategy.

*** I DO NOT OWN SHARES OR OPTIONS CONTRACT POSITIONS IN ADM STOCK AT THE TIME OF PUBLISHING THIS ARTICLE ***

Cummins Inc. CMI Stock Analysis

Cummins Inc. stock trades under the ticker CMI & has shown recent bullishness that traders & investors should research further into for when market volatility has passed.

CMI stock closed at $215.98/share on 5/23/2023.

Cummins Inc. CMI Stock’s Technical Performance Broken Down

Cummins Inc. CMI Stock's Technical Performance Over The Past Year
Cummins Inc. CMI Stock’s Technical Performance Over The Past Year

CMI Stock Price: $215.98

10 Day Moving Average: $215.27

50 Day Moving Average: $225.90

200 Day Moving Average: $230.45

RSI: 41.96

MACD: -3.873, -3.955, 0.083

Yesterday, CMI stock completed a bullish MACD crossover, despite losing -0.94% on the day’s session.

Their RSI is on the oversold end of neutral at 41.96, with recent trading volumes being below average compared to the year prior, signaling uncertainty among investors.

Investors should be watching to see how CMI behaves around its support levels to establish where they may want to enter a position once broader market volatility has subsided.

CMI stock has support at the $215.73, $215.27 (10 day moving average), $213.46 & $211.18/share price level, with resistance overhead at the $217.41, $218.98, $222.18 & $225.90/share (50 day moving average) price levels.

Cummins Inc. CMI Stock As A Long-Term Investment

Long-term oriented investors will like CMI stock’s 12.61 P/E (ttm), but may find their 3.29 P/B (mrq) to be a bit too rich.

They recently reported +32.4% Quarterly Revenue Growth Y-o-Y, with +89% Quarterly Earnings Growth Y-o-Y.

Their balance sheet may warrant a more thorough review, with $2.44B of Total Cash (mrq) & $8.37B of Total Debt (mrq).

CMI pays a 2.83% dividend, which appears to be sustainable in the long-run, as their payout ratio is 34.7%.

86.3% of CMI stock’s outstanding share float is owned by institutional investors.

Cummins Inc. CMI Stock As A Short-Term Trade Using Options

Traders with shorter time horizons can trade options to profit from price movements in CMI stock, while protecting their portfolios from volatility.

I am looking at the contracts with the 6/16 expiration date.

The $250, $260 & $210 call options are all in-the-money, listed from highest to lowest level of open interest.

The $230, $220 & $240 puts are also all in-the-money, with the former being more liquid than the latter strikes.

Tying It All Together

CMI stock has many interesting attributes that traders & investors will find appealing.

Investors will like their recent growth metrics, as well as their sustainable dividend.

Traders will like their recent technical performance & liquid options.

All-in-all, it is worth taking a closer look into how CMI stock fits into your portfolio strategy.

*** I DO NOT OWN SHARES OR OPTIONS CONTRACT POSITIONS IN CMI STOCK AT THE TIME OF PUBLISHING THIS ARTICLE ***

LyondellBasell Industries NV LYB Stock Analysis

LyondellBasell Industries NV stock trades under the ticker LYB & has shown recent bullishness that traders & investors should research further into for when market volatility has subsided.

LYB stock closed at $90.68/share on 5/22/2023.

LyondellBasell Industries NV LYB Stock’s Technical Performance Broken Down

LyondellBasell Industries NV LYB Stock's Technical Performance Over The Past Year
LyondellBasell Industries NV LYB Stock’s Technical Performance Over The Past Year

LYB Stock Price: $90.68

10 Day Moving Average: $89.89

50 Day Moving Average: $91.34

200 Day Moving Average: $86.23

RSI: 48.03

MACD: -0.809, -0.812, 0.003

Yesterday, LYB stock completed a bullish MACD crossover, despite losing -0.23% on the day’s session.

Their RSI is neutral at 48 & recent trading volumes have been below average compared with the year prior, which when combined with the spinning top candlesticks from 6 of the last 8 sessions, highlights uncertainty in LYB stock’s share value by investors.

As a result, market participants would be wise to watch how they behave at their key support levels in the near-term in order to target an entry for when market volatility has cooled down.

LYB stock has support at the $89.89 (10 day moving average), $89.86, $89.70 & $88.98/share price levels, with resistance at the $91.34 (50 day moving average), $92.32, $93 & $93.32/share price levels.

LyondellBasell Industries NV LYB Stock As A Long-Term Investment

Long-term oriented investors will like LYB stock’s valuation metrics, with a 10.09 P/E (ttm) & a 2.39 P/B (mrq).

They recently reported -22.10% Quarterly Revenue Growth Y-o-Y, with -64.2% Quarterly Earnings Growth Y-o-Y, which should be researched further into before investing.

Their balance sheet will also require a more thorough examination as well, with $1.82B of Total Cash (mrq) & $13.1B of Total Debt (mrq).

LYB stock pays a 5.24% dividend, which appears to be sustainable in the long-run, as their payout ratio is 51.35%.

72.06% of LYB stock’s outstanding share float is owned by institutional investors.

LyondellBasell Industries NV LYB Stock As A Short-Term Trade Using Options

Traders with shorter time horizons can trade options to profit from LYB stock’s price movements, while protecting their portfolios from volatility.

I am looking at the contracts with the 6/16 expiration date.

The $90, $85 & $80 call options are all in-the-money, listed from highest to lowest level of open interest.

The $95, $100 & $105 puts are also in-the-money, with the former being more liquid than the latter strikes.

Tying It All Together

LYB stock has many interesting attributes that traders & investors will find appealing.

Investors will like their dividend, as well as their valuation metrics, but may want to dig deeper into their recent growth woes, as well as their balance sheet.

Traders will like their recent technical performance, as well as their liquid options.

All-in-all, it is worth taking a closer look into how LYB stock fits into your portfolio strategy.

*** I DO NOT OWN SHARES OR OPTIONS CONTRACT POSITIONS IN LYB STOCK AT THE TIME OF PUBLISHING THIS ARTICLE ***

John Bean Technologies Corp. JBT Stock Analysis

John Bean Technologies Corp. stock trades under the ticker JBT & has shown recent bullishness that traders & investors should research further into for when market volatility has calmed down.

JBT stock closed at $104.76/share on 5/22/2023.

John Bean Technologies Corp. JBT Stock’s Technical Performance Broken Down

John Bean Technologies Corp. JBT Stock's Technical Performance Over The Past Year
John Bean Technologies Corp. JBT Stock’s Technical Performance Over The Past Year

JBT Stock Price: $104.76

10 Day Moving Average: $103.89

50 Day Moving Average: $105.10

200 Day Moving Average: $100.56

RSI: 49.39

MACD: -0.464, -0.482, 0.018

Yesterday, JBT stock completed a bullish MACD crossover, gaining+0.11% on the day’s session.

Their RSI is neutral at 49 & recent trading volumes have been below average compared to the year prior, indicating that investors are uncertain about where they value JBT’s shares currently.

Investors would be wise to watch how they behave at support levels in the coming weeks, in order to figure out what price level to enter at once market volatility has subsided a bit.

JBT stock has support at the $104.32, $103.89 (10 day moving average), $103.58 & $101.99/share price levels, with resistance at the $105.10 (50 day moving average), $105.33, $105.62 & $106.45/share price levels.

John Bean Technologies Corp. JBT Stock As A Long-Term Investment

Long-term oriented investors will like JBT stock’s 25.18 P/E (ttm), but may find their 3.78 P/B (mrq) to be a bit too rich.

They recently reported 12.9% Quarterly Revenue Growth.

Their balance sheet will require a more thorough review, with $45.7M of Total Cash (mrq) & $957.3M of Total Debt (mrq).

JBT stock pays a modest 0.38% dividend, which appears to be sustainable in the long-run, as their payout ratio is 9.83%.

99.34% of JBT stock’s outstanding share float is owned by institutional investors.

John Bean Technologies Corp. JBT Stock As A Short-Term Trade Using Options

Traders who has shorter time horizons can trade options to profit from JBT stock’s price movements, while protecting their portfolios from volatility.

Their options are pretty illiquid, with no in-the-money strike prices for calls in the coming expiration dates, but there are contracts at the $115 calls dated for 6/16, as well as $115, $110, $120 & $125 strikes for the 7/21 expiration date (in order of highest to lowest level of open interest)

The $110 puts with the 7/21 expiration date are in-the-money.

Tying It All Together

JBT stock has many interesting characteristics that traders & investors will find appealing.

Investors will like their P/E (ttm) & sustainable, yet modest dividend.

Traders will like their recent technical performance, but will be disappointed by how illiquid their options are.

Overall, it is worth taking a closer look to see how JBT stock fits into your portfolio strategy.

*** I DO NOT OWN SHARES OR OPTIONS CONTRACT POSITIONS IN JBT STOCK AT THE TIME OF PUBLISHING THIS ARTICLE ***