Weekly Stock & ETF Market Review 3/5/2022

I am still on vacation, so this week’s post will be more brief than previous weeks’ posts.

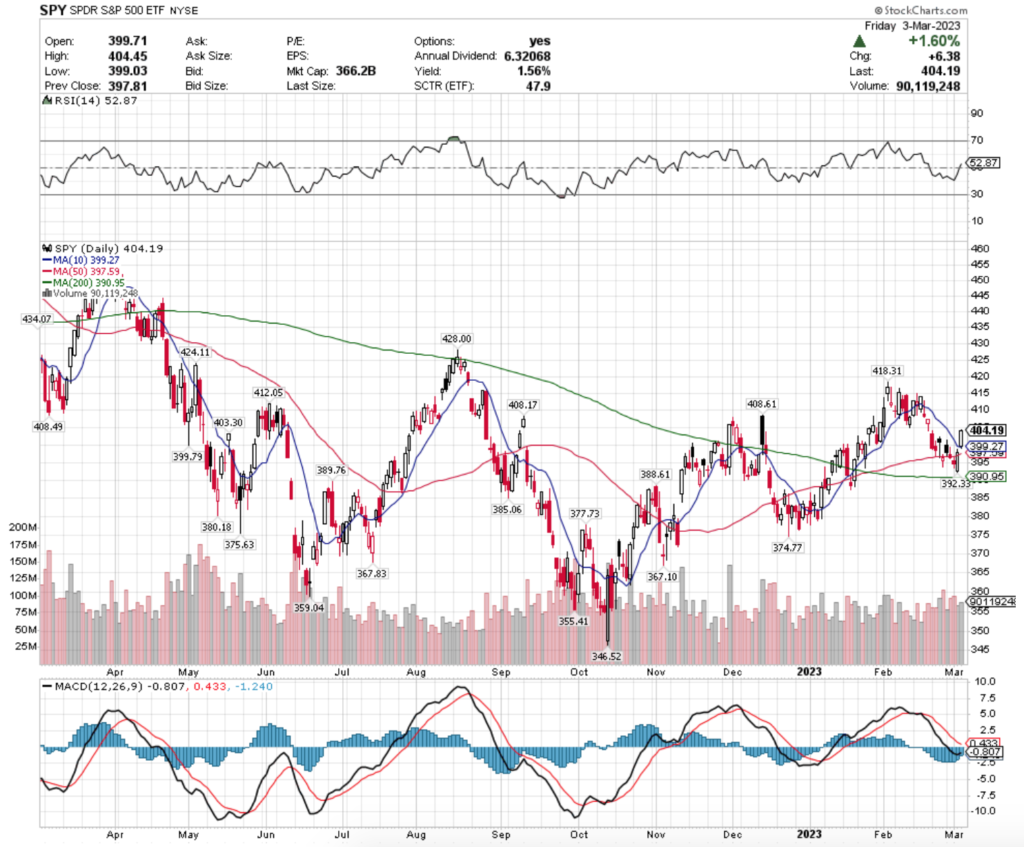
SPY, the SPDR S&P 500 ETF gained +1.97% this past week, mostly due to a gap up on Friday’s session.
SPY ETF - SPDR S&P 500 ETF's Technical Performance Over The Past Year
SPY ETF – SPDR S&P 500 ETF’s Technical Performance Over The Past Year

Their RSI is still neutral at ~53 & their MACD is beginning to curl in a bullish direction & recent volumes have improved, but remains about average.

It will be interesting to see how they hold up with support at $399.79, $399.27 (10 day moving average), $397.59 (50 day moving average), but it looks to be a volatile week ahead.

SPY has a lot of resistance in the $408 price-level zone ($408.17, $408.49 & $408.61), before jumping to $412.05.

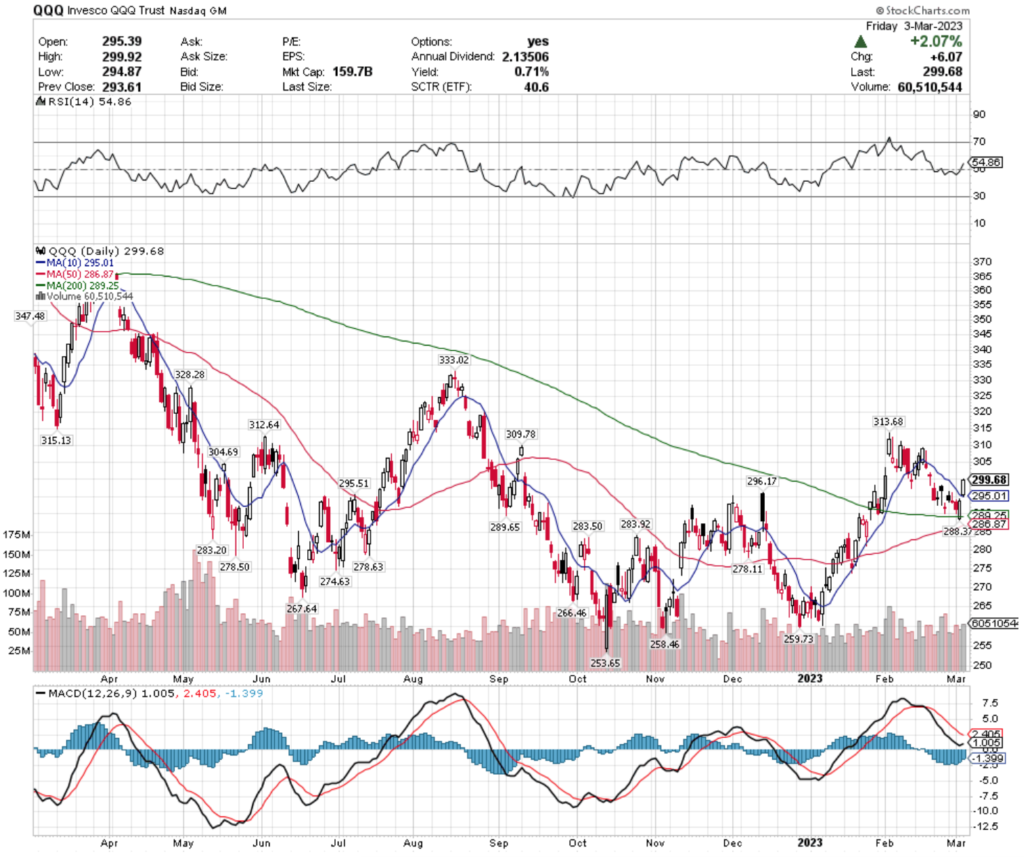
QQQ, the Invesco QQQ Trust ET gained +2.68% this past week, gapping up stronger than SPY did on Friday’s session, although their volume has been more average than SPY’s recently.
QQQ ETF - Invesco QQQ Trust ETF's Technical Performance Over The Past Year
QQQ ETF – Invesco QQQ Trust ETF’s Technical Performance Over The Past Year

Their next level of resistance is $304.69, followed by $309.78, $312.64 & $313.68.

QQQ’s support will likely be tested in the coming days, with the levels to watch being $296.17, $295.51, $295.01 (10 day moving average), before falling to $289.65.

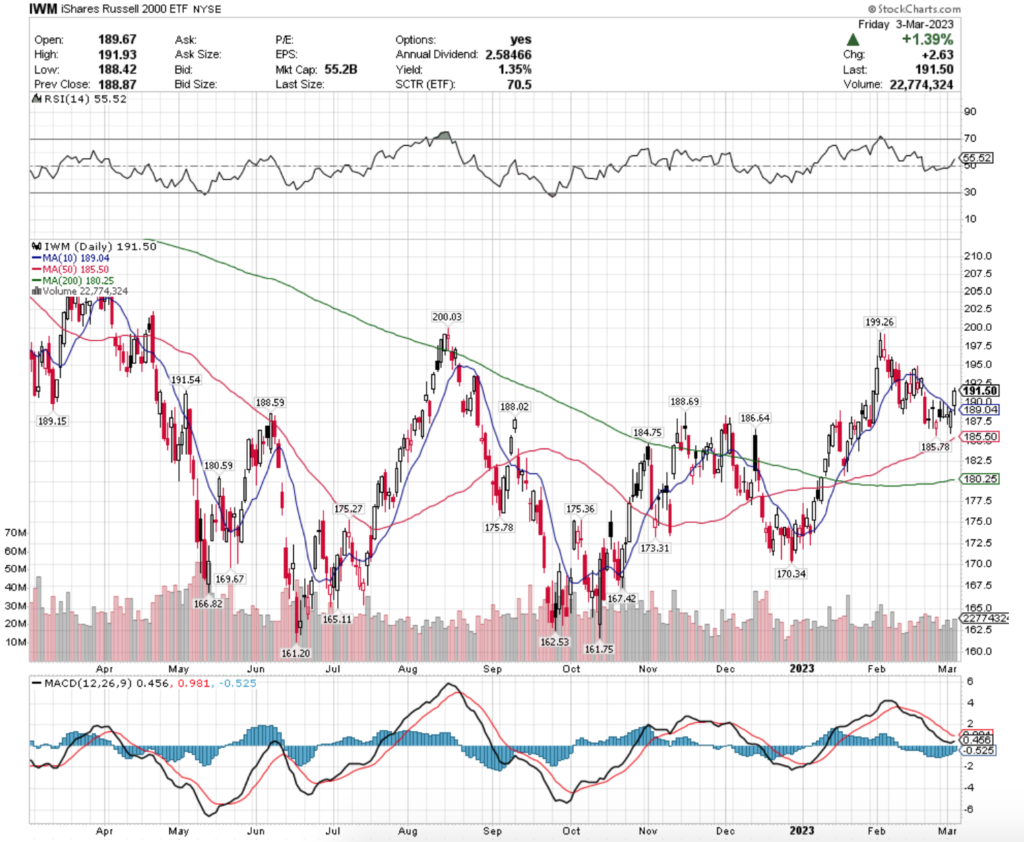
IWM, the iShares Russell 2000 ETF gained +2.13% this week, with similarly “near-average” volume compared to the rest of the year prior.
IWM ETF - iShares Russell 2000 ETF's Technical Performance Over The Past Year
IWM ETF – iShares Russell 2000 ETF’s Technical Performance Over The Past Year

Like SPY & QQQ, Friday’s gap up moved IWM’s RSI to look bullish & their MACD is beginning to signal an attempt at a bullish crossover.

Let’s dive into the best & worst performing sectors/geo-locations!

Aerospace & Defense (DFEN), Industrials (DUSL), Germany (EWG) & Small Caps (UAA) Are All Bullishly Leading The Market

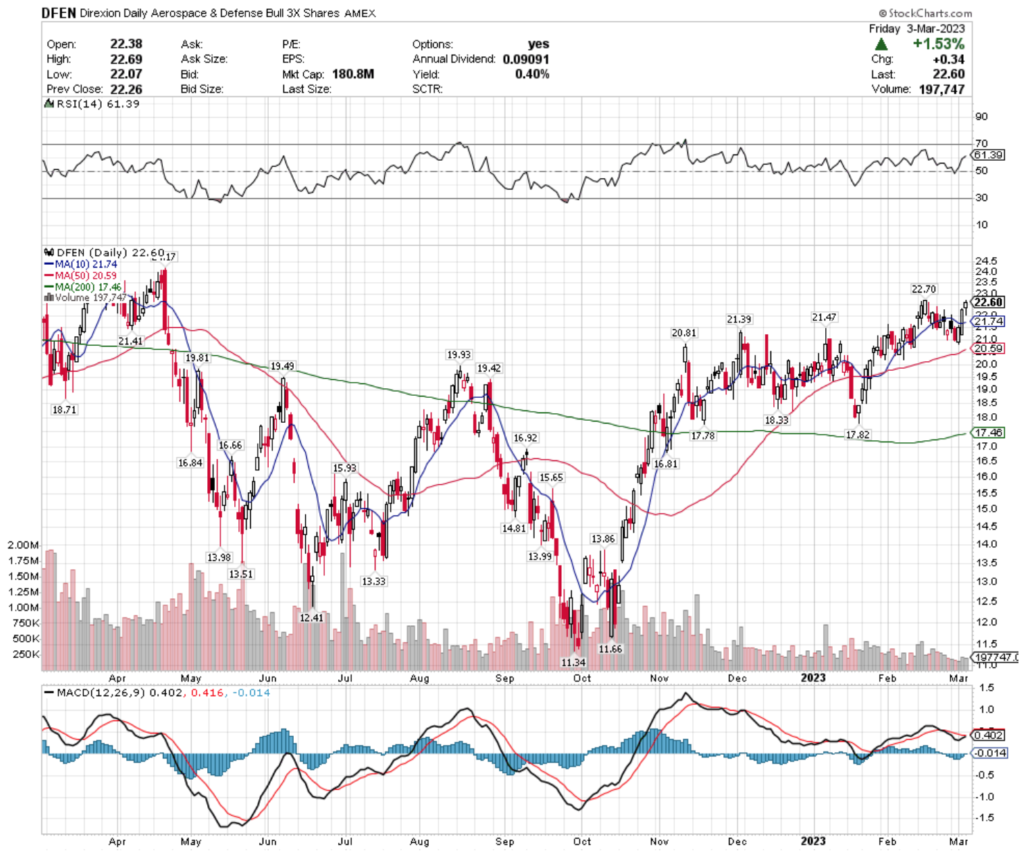
DFEN, the Direxion Daily Aerospace & Defense Bull 3x Shares ETF has gained 4.44% over the past year, but has rebounded 99.29% from its low in September of 2022.
DFEN ETF - Direxion Daily Aerospace & Defense Bull 3x Shares ETF's Technical Performance Over The Past Year
DFEN ETF – Direxion Daily Aerospace & Defense Bull 3x Shares ETF’s Technical Performance Over The Past Year

While their distribution will not provide much cushion at 0.40% annually (0.1% payout/quarter), they have support at $21.74 (10 day moving average), $21.47, $21.41 & $21.39.

Given where they are at currently it would be wisest to wait on any moves or use options strategies around these levels, as their next overhead resistance level is $22.70, followed by $22.80 & $23.14.

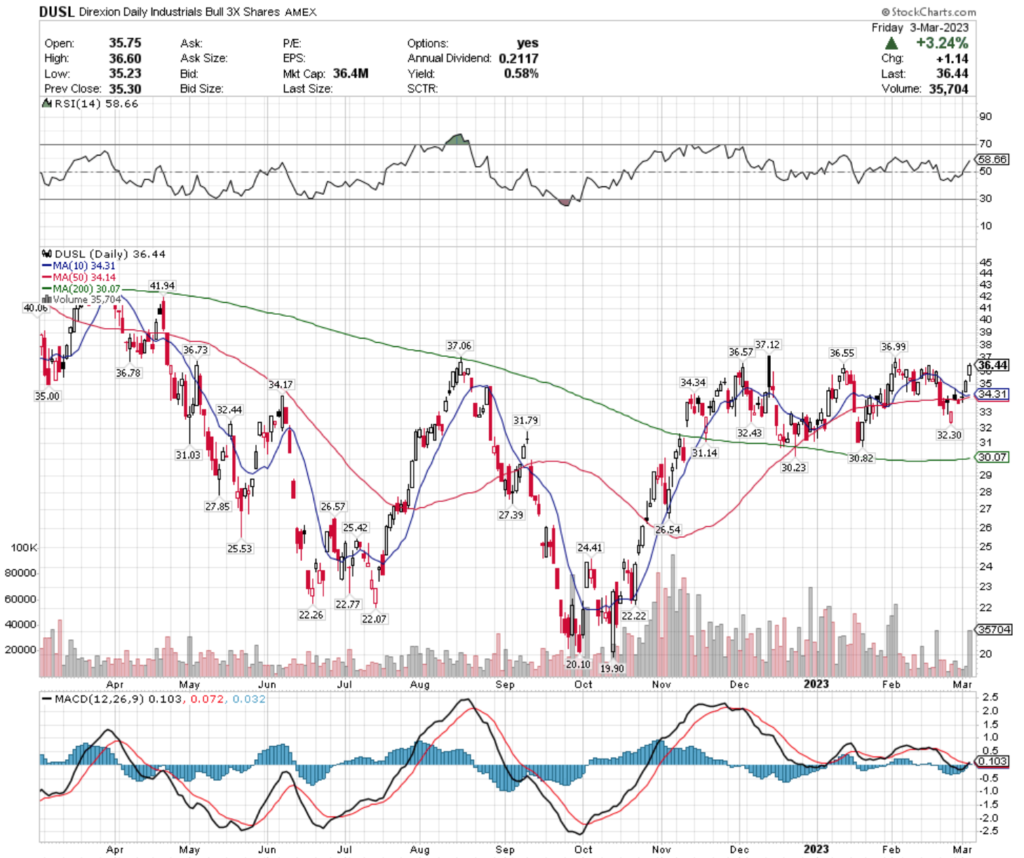
DUSL, the Direxion Daily Industrials Bull 3x Shares ETF has lost 3% this past year (excluding dividends, which still only provide a 0.58% cushion for loss), but has gained 83.12% from the lows of October 2022.
DUSL ETF - Direxion Daily Industrials Bull 3x Shares ETF's Technical Performance Over The Past Year
DUSL ETF – Direxion Daily Industrials Bull 3x Shares ETF’s Technical Performance Over The Past Year

Their next resistance levels are $36.55, $36.57 & $36.73.

Support levels are a bit lower, signaling investors who aren’t trading options around DUSL should wait until they test these levels again before entering.

Support levels currently are $35.00, $34.34 & $34.31 (10 day moving average), and there is a consolidation around the area of the 10 & 50 day moving averages.

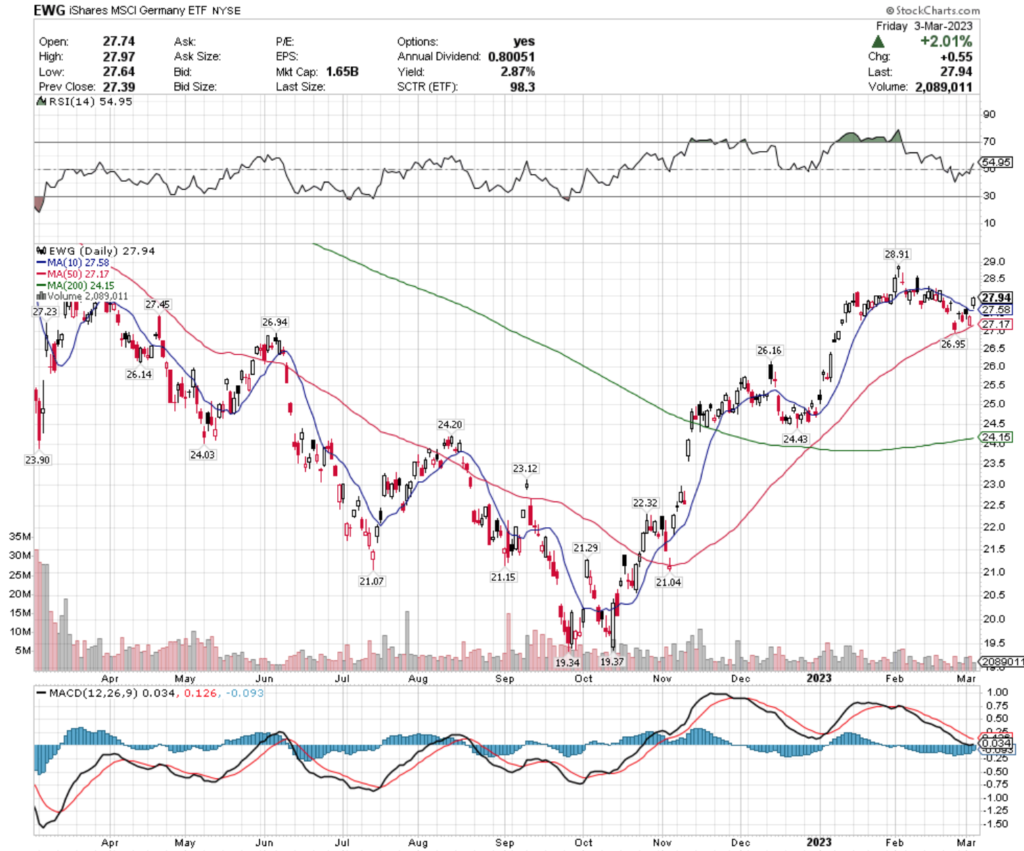
EWG, the iShares MSCI Germany ETF has gained 10% (in addition to their 2.87% distribution for long-term holders), while gaining 44.47% since their low in September 2022.
EWG ETF - iShares MSCI Germany ETF's Technical Performance Over The Past Year
EWG ETF – iShares MSCI Germany ETF’s Technical Performance Over The Past Year

Long-term holders will be rewarded the 2.85% in distributions, but this is currently too overheated for an entry, with overhead resistance at $28.91, $28.95 & $29.86.

Unless using options, it is best for long-only readers to wait to see how EWG performs against their support levels of $27.57 (10 day moving average), $27.45 & $27.24 (50 day moving average) before making an entry.

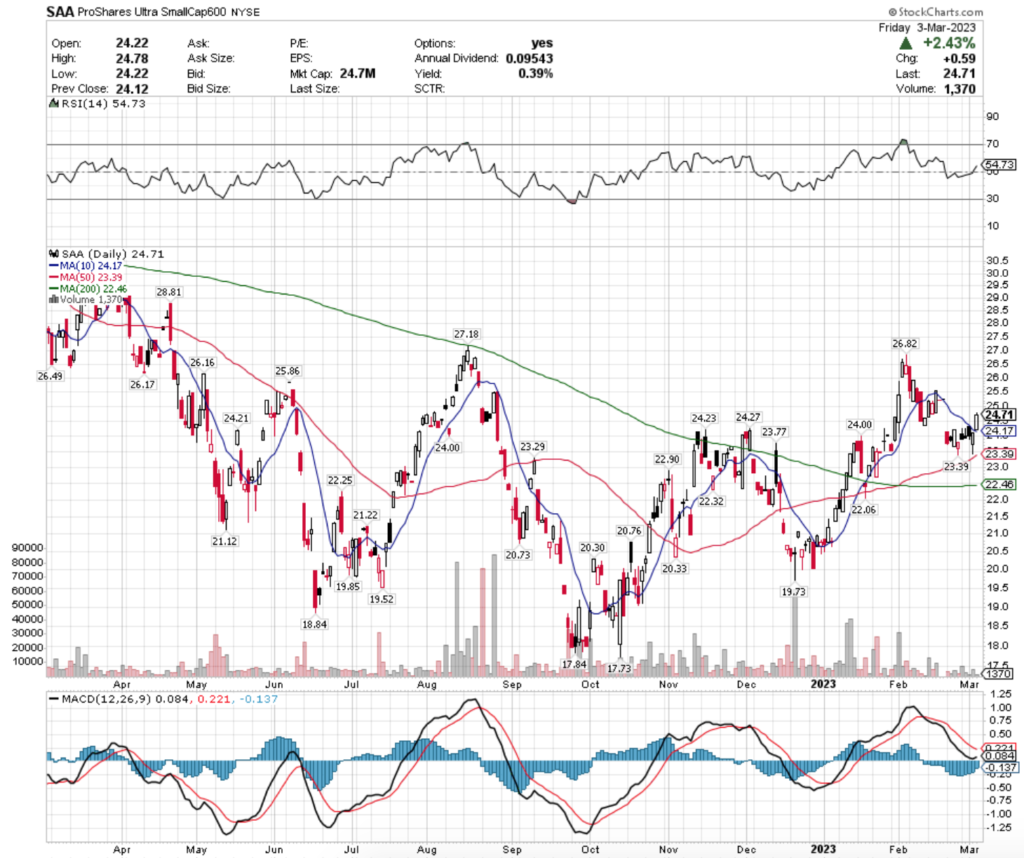
SAA, the ProShares Ultra Small Cap 600 ETF has lost -11.18% over the past year (with minimal cushion from their 0.39% distribution), but they have recovered +39.37% from their lows in September 2022.
SAA ETF - the ProShares Ultra Small Cap 600 ETF's Technical Performance Over The Past Year
SAA ETF – the ProShares Ultra Small Cap 600 ETF’s Technical Performance Over The Past Year

While they’ve begun to fill their most recent gap down, this one also is worth taking a wait & see approach for entering a position.

With resistance at $25.86, $26.16, $26.17 & $26.49, it will be important to see how they behave at their support levels of $24.27, $24.23 & $24.21.

Colombia (GXG), Mortgage Real Estate (REM), U.S. Telecommunications (IYZ) & Clean Energy (PBW) Are All Bearishly Lagging The Market

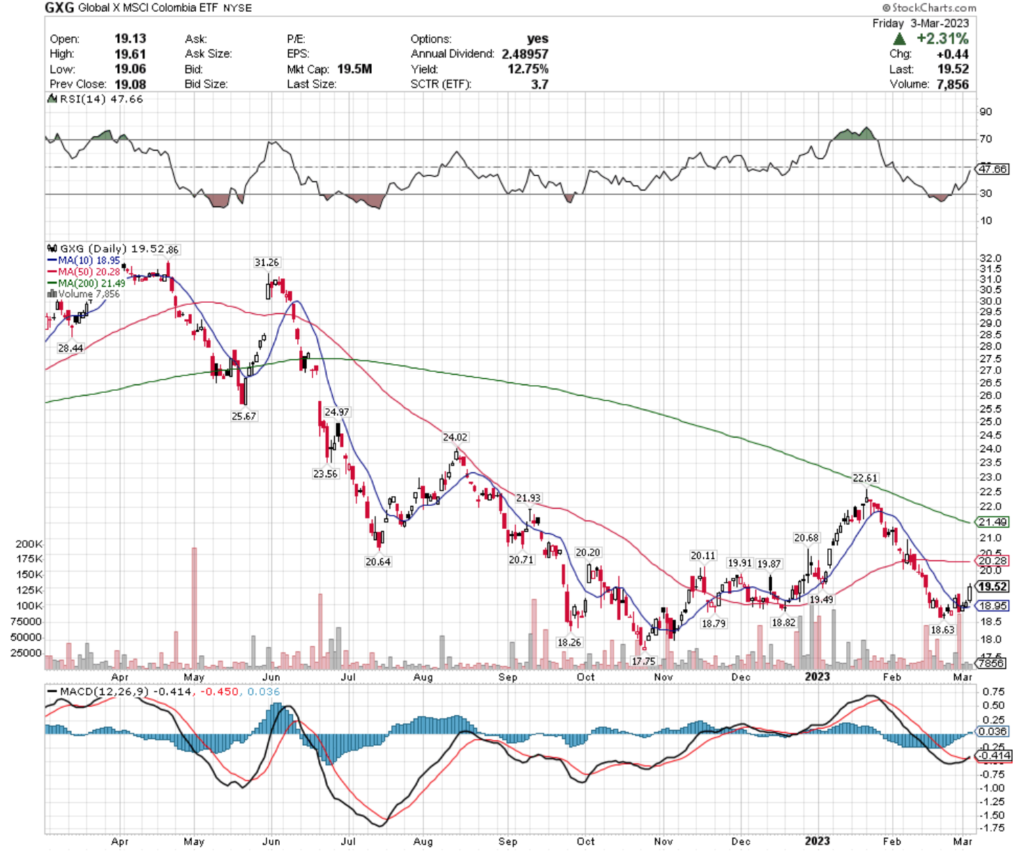
GXG, the Global X MSCI Colombia ETF has lost 32.13% (not including their 12.75% distribution paid to long-term holders), and is -38.73% from their high in April 2022.
GXG ETF - Global X MSCI Colombia ETF's Technical Performance Over The Past Year
GXG ETF – Global X MSCI Colombia ETF’s Technical Performance Over The Past Year

While their last week went well, resistance tests at $19.87, $19.91 & $20.11 will be imperative to see how much upward momentum they can gain, while they have support at $18.95, $18.82 & $18.79/share.

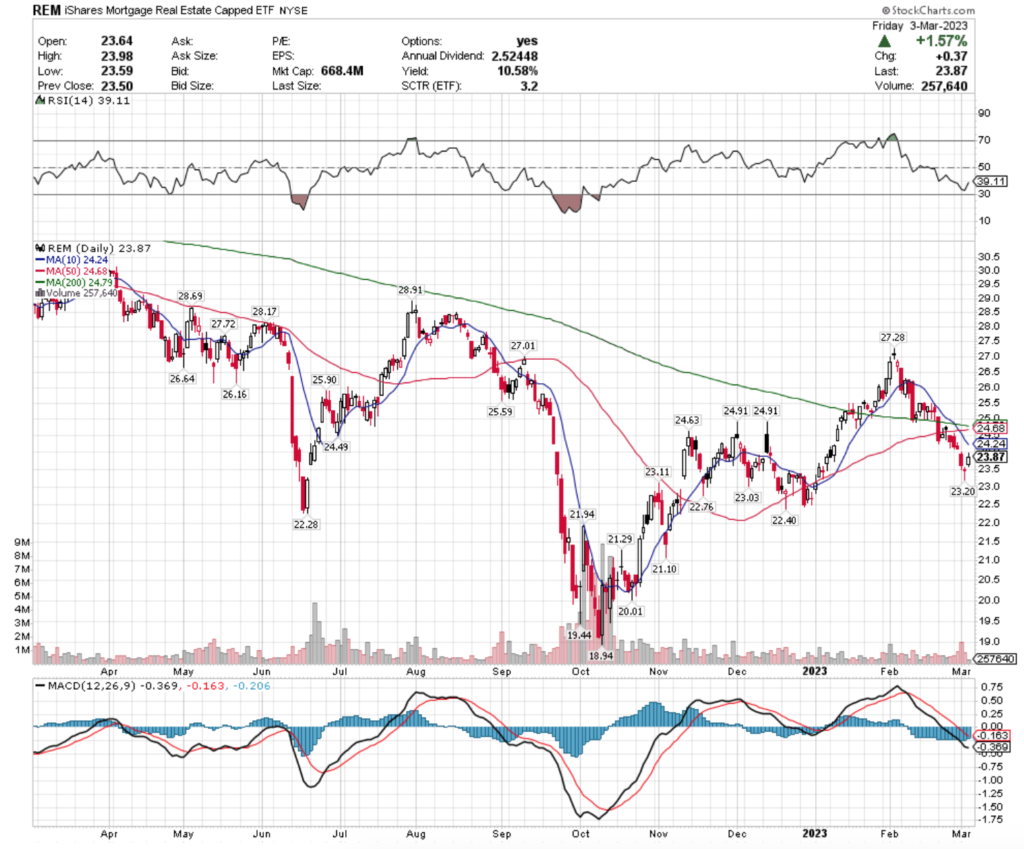
REM, the iShares Mortgage Real Estate Capped ETF has lost -17% over the past year (although their distribution of 10.58% to long-term holders helped cushion the fall), and has lost -22% since their high in March 2022.
REM ETF - iShares Mortgage Real Estate Capped ETF's Technical Performance Over The Past Year
REM ETF – iShares Mortgage Real Estate Capped ETF’s Technical Performance Over The Past Year

They have pivoted off of the low last Wednesday to recover for 2 days, but need to face tests at $24.49, $24.63 & $24.71 (50 day moving average) & have a long ways down to go upon failing, as support levels are $24.14 (10 day moving average), $23.20 & $23.11.

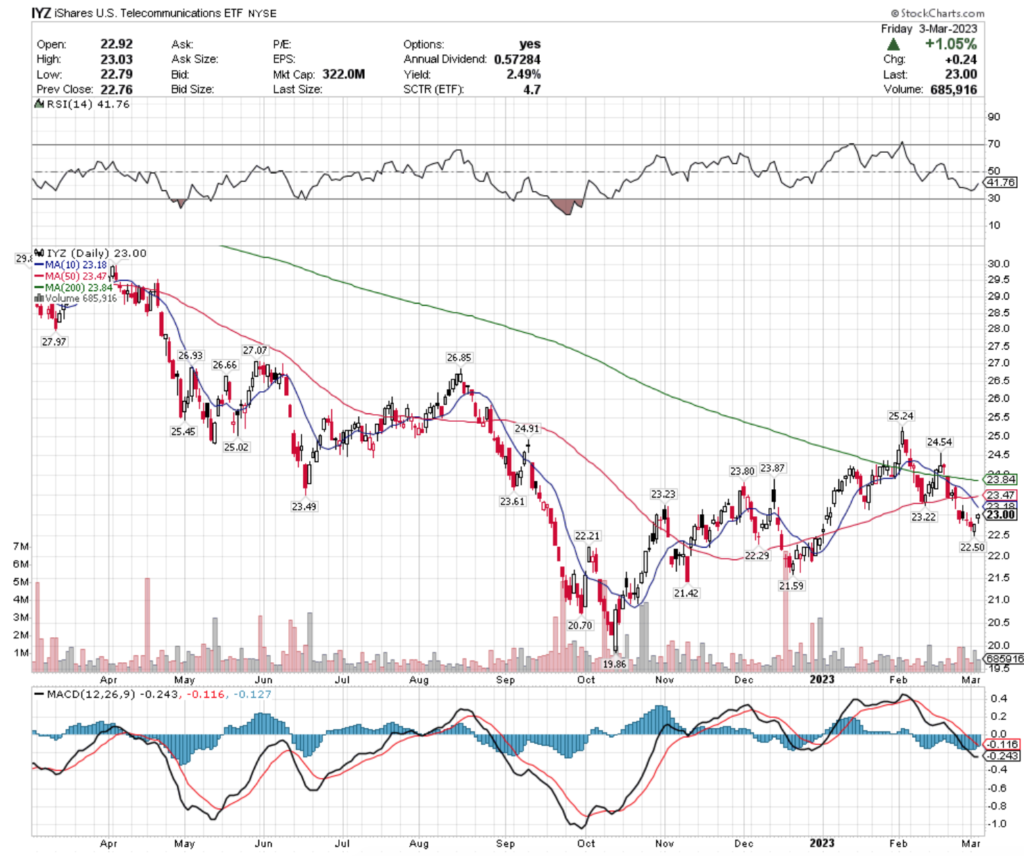
IYZ, the iShares U.S. Telecommunications ETF has lost 20.94% over the past year (excluding the 2.49% distribution they pay to long-term holders), down -23.23% from their high in March 2022.
IYZ ETF - iShares U.S. Telecommunications ETF's Technical Performance Over The Past Year
IYZ ETF – iShares U.S. Telecommunications ETF’s Technical Performance Over The Past Year

The gaps up of last week don’t look strong here, with overhead resistance at $23.22, $23.23, $23.50 (50 day moving average) & $23.61.

Support levels of $23.07 (10 day moving average), $22.50 & $22.29 are going to be what to watch for to see how they hold up upon retest.

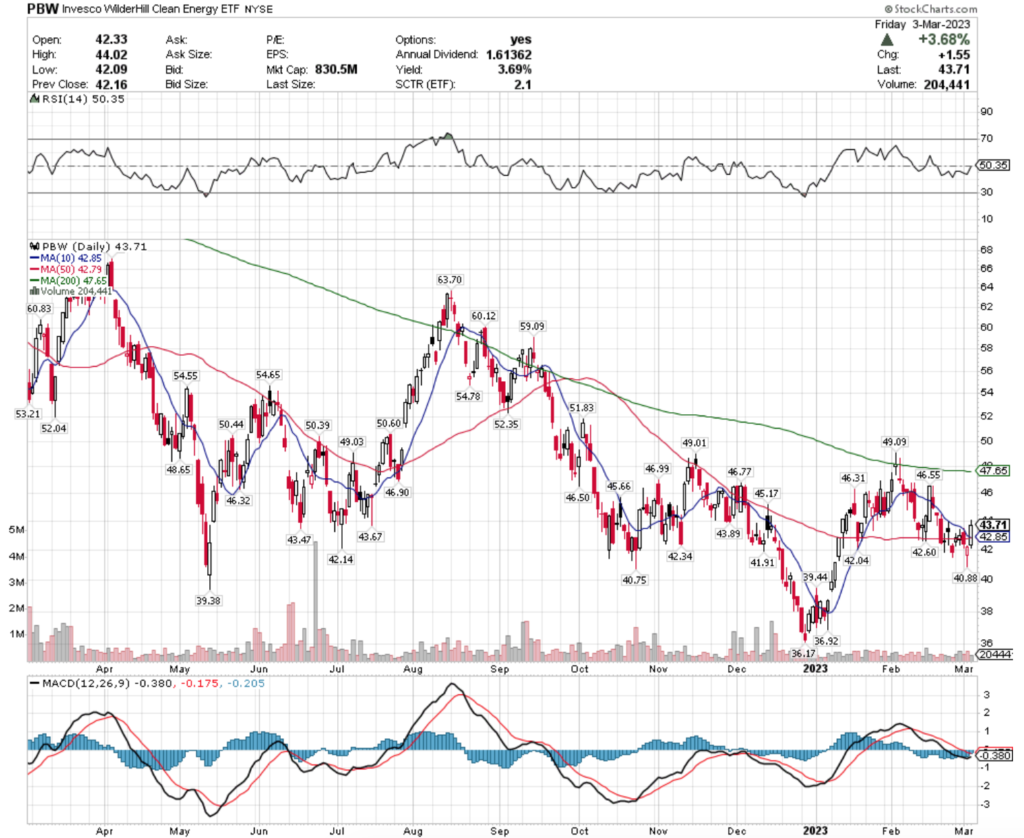
PBW, the Invesco Wilder Hill Clean Energy ETF has lost -20.48% over the past year (excluding their 3.69% distribution paid to long-term holders), losing -34.78% since their high in April 2022.
PBW ETF - Invesco Wilder Hill Clean Energy ETF's Technical Performance Over The Past Year
PBW ETF – Invesco Wilder Hill Clean Energy ETF’s Technical Performance Over The Past Year

Their next tests of resistance will be at the $45.17, $45.66 & $46.31/share level.

Support levels to watch are at $43.89, $43.67 & $43.47.

Tying It All Together

Monday will bring us Factory Orders data, followed by Fed Chairman Powell testifying to the Senate Tuesday, when Wholesale Inventories & Consumer Credit data will also be reported.

Wednesday will provide us with ADP Employment, U.S. Trade Balance, Fed Chairman Powell testifying to the House, JOLTs Job Openings data & Beige Book information.

On Thursday Jobless Claims data will be reported & Fed Governor Waller is scheduled to speak & Friday wraps the week up with Employment Report, U.S. Unemployment Rate & Federal Budget Data.

See you back here next week!

*** I DO NOT OWN SHARES OR OPTIONS CONTRACTS OF DFEN, DUSL, EWG, SAA, GXG, REM, IYZ or PBW AT THE TIME OF PUBLISHING THIS ARTICLE ***
CNH Industrial NV CNHI Stock Analysis

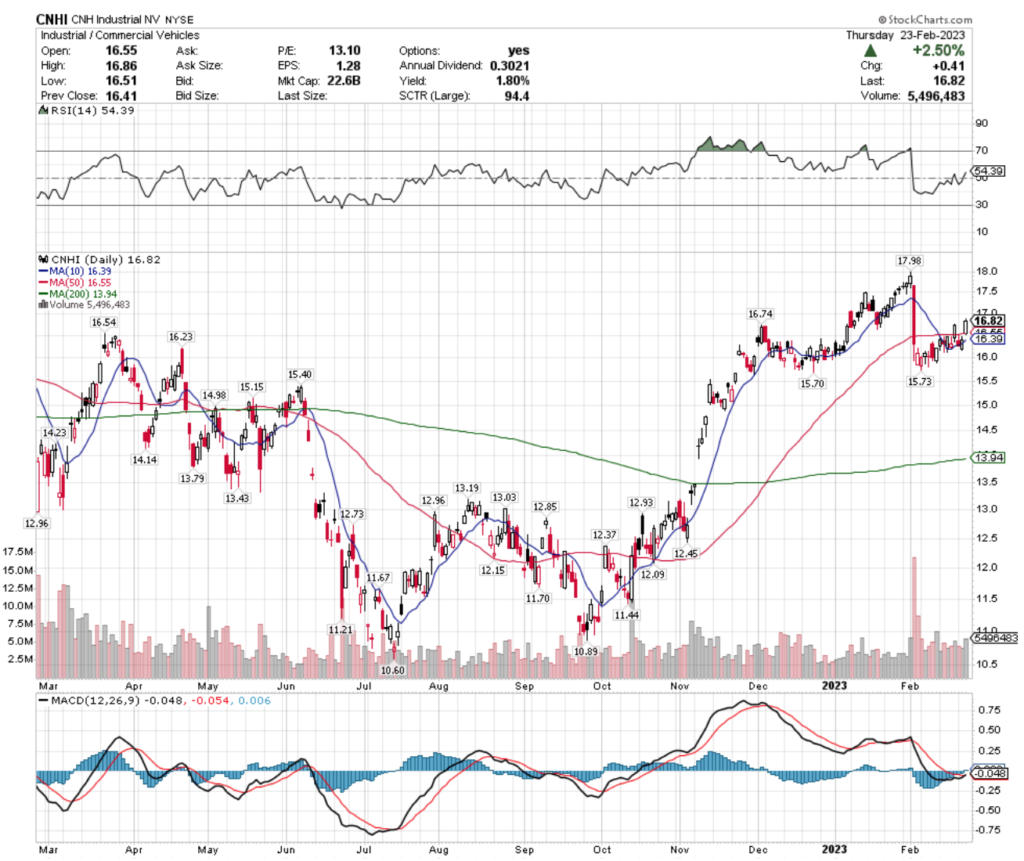
CNH Industrial NV stock trades under the ticker CNHI & has shown recent bullishness that traders & investors should research further into.

CNHI stock closed at $16.82/share on 2/23/2023.

CNH Industrial NV CNHI Stock’s Technical Performance Broken Down

CNH Industrial NV CNHI Stock's Technical Performance Over The Past Year
CNH Industrial NV CNHI Stock’s Technical Performance Over The Past Year

CNHI Stock Price: $16.82

10 Day Moving Average: $16.39

50 Day Moving Average: $16.55

200 Day Moving Average: $13.94

RSI: 54.39

MACD: -0.048

Yesterday, CNHI stock completed a bullish MACD crossover, gaining +2.5% on the day’s session.

Recent trading volumes have been about average compared to the year prior & their RSI is neutral.

They have climbed steadily in February, but are signaling near-term weakness, which investors & traders can use to get a more favorable entrypoint.

Using the past 52 week’s data, CNHI stock has support at the $16.55 (50 day moving average), $16.54 & $16.39/share price levels, as they try to break out above their $17.98/share resistance level.

CNH Industrial NV CNHI Stock As A Long-Term Investment

Long-term oriented investors will like CNHI stock’s 11.01 P/E (ttm), but may find their 3.18 P/B (mrq) to be a bit too rich.

They recently reported -23.5% Quarterly Revenue Growth Y-o-Y, with 96% Quarterly Earnings Growth Y-o-Y, which investors may want to look into with more detail.

Their balance sheet also warrants a closer review, with $3.8B of Total Cash (mrq) & $22.96B of Total Debt (mrq).

CNHI stock pays a 2.32% dividend, which appears sustainable in the long-run, as their payout ratio is 19.81%.

50.12% of CNHI stock’s outstanding share float is owned by institutional investors.

CNH Industrial NV CNHI Stock As A Short-Term Trade Using Options

Traders with shorter time horizons can use options to profit from CNHI stock’s price movements, while protecting their portfolios from volatility.

I am looking at the contracts with the 3/17 expiration date.

The $15, $12.50 & $10 call options are all in-the-money, with the former strike prices being more liquid than the latter ones.

The $17.50 puts are also in-the-money.

Tying It All Together

CNHI stock has many unique attributes that traders & investors will find appealing.

Investors will like their stable dividend yield, as well as their valuation metrics.

Traders will like their recent technical performance.

Overall, it is worth taking a closer look into CNHI stock to see how it fits into your portfolio strategy.

*** I DO NOT OWN SHARES OR OPTIONS CONTRACTS IN CNHI STOCK AT THE TIME OF PUBLISHING THIS ARTICLE ***
Tyson Foods Inc. TSN Stock Analysis

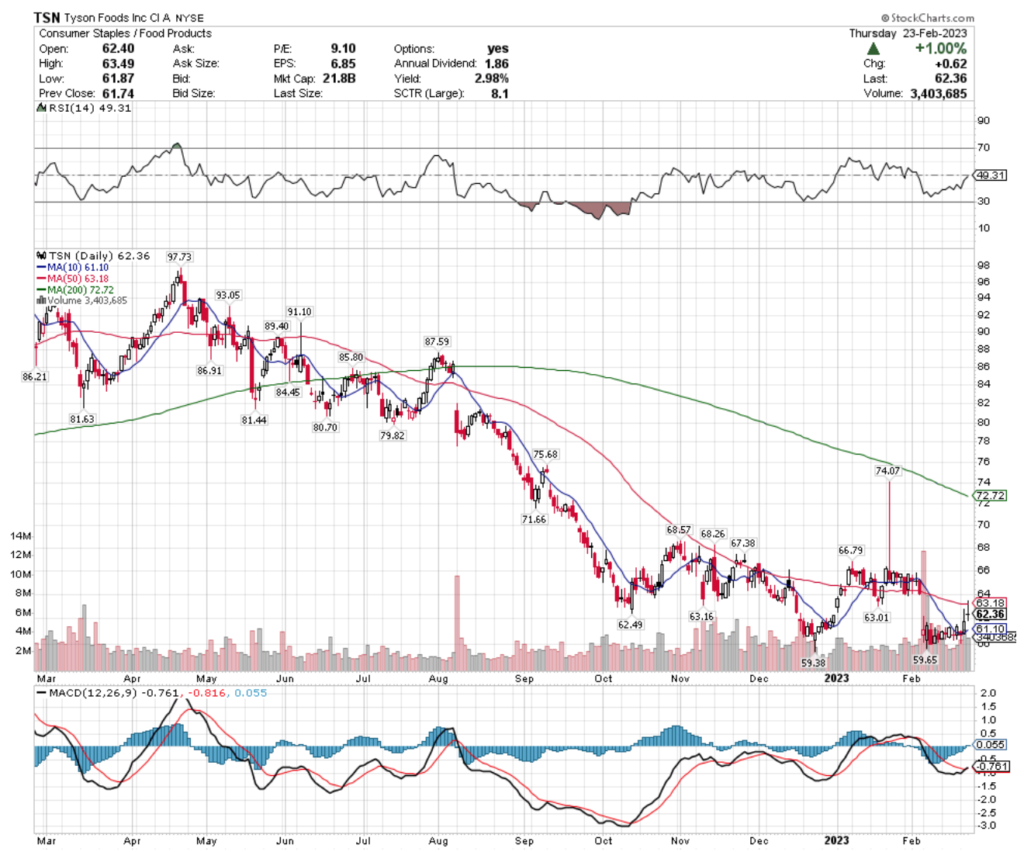
Tyson Foods Inc. stock trades under the ticker TSN & has shown recent bullishness that traders & investors should research further into.

TSN stock closed at $62.36/share on 2/23/2023.

Tyson Foods Inc. TSN Stock’s Technical Performance Broken Down

Tyson Foods Inc. TSN Stock's Technical Performance Over The Past Year
Tyson Foods Inc. TSN Stock’s Technical Performance Over The Past Year

TSN Stock Price: $62.36

10 Day Moving Average: $61.10

50 Day Moving Average: $63.18

200 Day Moving Average: $72.72

RSI: 49.31

MACD: -0.761

Yesterday, TSN stock completed a bullish MACD crossover, gaining +1% on the day’s session.

Recent trading volumes have been above average compared to the year prior & their RSI is neutral.

However, recent days’ candlesticks are signaling that there is more short-term losses on the horizon, which provide opportunity for more favorable entry points for traders & investors.

TSN stock has support at the $61.10, $59.65 & $59.38/share price level, as they try to break out above their $62.49, $63.01 & $63.16/share resistance levels.

Tyson Foods Inc. TSN Stock As A Long-Term Investment

Long-term oriented investors will like TSN stock’s valuation metrics, with a 9.17 P/E (ttm) & a 1.12 P/B (mrq).

They recently reported 2.5% Quarterly Revenue Growth Y-o-Y, with -71.8% Quarterly Earnings Growth Y-o-Y, which investors may want to get a better understanding about.

Their balance sheet will also require a more thorough examination, with $656M of Total Cash (mrq) & $8.35B of Total Debt (mrq).

TSN stock pays a 3.01% dividend, which appears to be sustainable in the long run as their payout ratio is 27.64%.

85.16% of TSN stock’s outstanding share float is owned by institutional investors.

Tyson Foods Inc. TSN Stock As A Short-Term Trade Using Options

Traders with shorter time horizons can use options to profit from TSN stock’s price movements, while protecting their portfolio from volatility.

I am looking at the contracts with the 3/17 expiration date.

The $60, $55 & $57.50 call options are all in-the-money, listed from highest to lowest level of open interest.

The $62.50, $65 & $67.50 puts are also all in-the-money, with the former being more liquid than the latter two strikes.

Tying It All Together

TSN stock has many interesting characteristics that traders & investors should look closer into.

Investors will like their valuation metrics & dividend yield, but may want to research their balance sheet structure in more detail before investing.

Traders will like their recent technical performance, as well as how liquid their options are.

Overall, it is worth taking a closer look into how TSN stock fits into your portfolio strategy.

*** I DO NOT OWN SHARES OR OPTIONS CONTRACTS IN TSN STOCK AT THE TIME OF PUBLISHING THIS ARTICLE ***
Anheuser-Busch InBev ADR BUD Stock Analysis

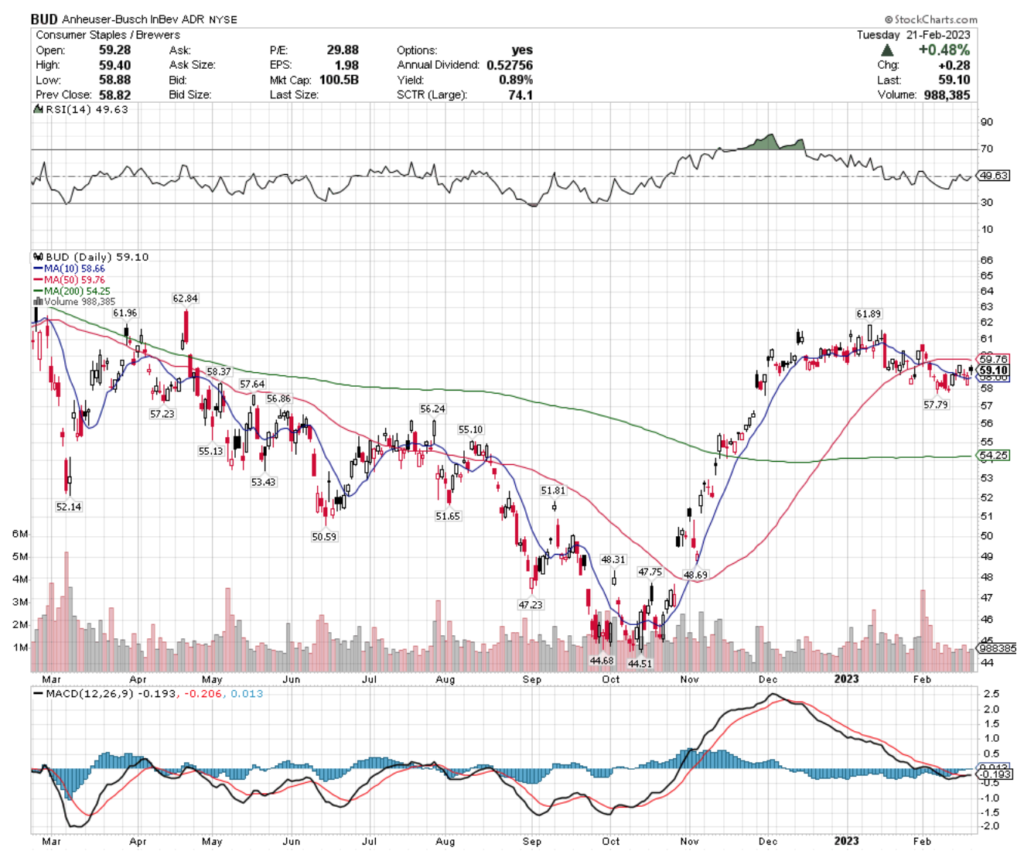
Anheuser-Busch InBev ADR stock trades under the ticker BUD & has shown recent bullishness that traders & investors should research further into.

BUD stock closed at $59.10/share on 2/21/2023.

Anheuser-Busch InBev ADR BUD Stock’s Technical Performance Broken Down

Anheuser-Busch InBev ADR BUD Stock's Technical Performance Over The Past Year
Anheuser-Busch InBev ADR BUD Stock’s Technical Performance Over The Past Year

BUD Stock Price: $59.10

10 Day Moving Average: $58.66

50 Day Moving Average: $59.76

200 Day Moving Average: $54.25

RSI: 49.63

MACD: -0.193

Yesterday, BUD stock completed a bullish MACD crossover, gaining +0.48% on the day’s session.

Their recent trading volumes have been below average compared to the year prior & their RSI is neutral, as their price has spent the past few months consolidating.

Recent technical indicators signal that there may be near-term losses on the horizon for BUD, which can provide better entry points for traders & investors.

BUD stock has support at the $58.66 (10 day moving average), $58.37 & $57.79/share price levels, as they try to break out & above their $59.76 (50 day moving average), $61.89 & $61.96/share resistance levels.

Anheuser-Busch InBev ADR BUD Stock As A Long-Term Investment

Long-term oriented investors will like BUD stock’s 23.74 P/E (ttm) & 1.63 P/B (mrq).

They recently reported 5.7% Quarterly Revenue Growth Y-o-Y & 473.2% Quarterly Earnings Growth Y-o-Y.

Their balance sheet will require a more thorough examination, with $7.36B of Total Cash (mrq) & $83.53B of Total Debt (mrq).

BUD stock offers a modest 0.97% dividend, which appears sustainable in the long-run, as their payout ratio is 21.9%.

6.28% of BUD stock’s outstanding share float is owned by institutional investors.

Anheuser-Busch InBev ADR BUD Stock As A Short-Term Trade Using Options

Traders with shorter time horizons can trade options to profit from BUD stock’s price movements, while protecting their portfolio from volatility.

I am looking at the contracts with the 3/17 expiration date.

The $55 & $59 call options are both in-the-money, with the former being more liquid than the latter strike.

The $60 puts are also in-the-money.

With weekly expirations, there will likely be more contracts written for this date as other contracts expire.

Tying It All Together

BUD stock has many interesting characteristics that traders & investors will find appealing.

Investors will like their valuation metrics & dividend, but may want to look closer into their balance sheet before investing.

Traders will like their recent technical performance, as well as their weekly option expirations.

Overall, it is worth taking a closer look into BUD stock to see how it fits into your portfolio strategy.

*** I DO NOT OWN SHARES OF BUD STOCK OR OPTIONS AT THE TIME OF PUBLISHING THIS ARTICLE ***
ConAgra Brands Inc. CAG Stock Analysis

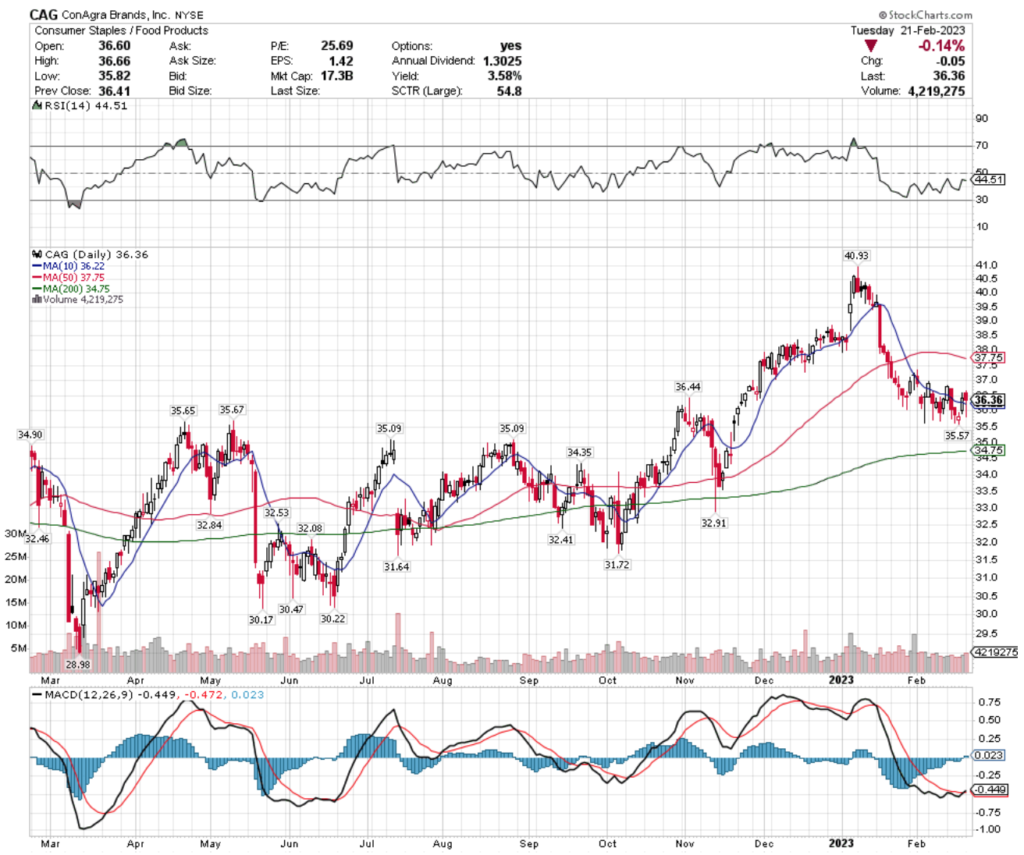
ConAgra Brands Inc. stock trades under the ticker CAG & has shown recent bullishness that traders & investors should look deeper into.

CAG stock closed at $36.36/share on 2/21/2023.

ConAgra Brands Inc. CAG Stock’s Technical Performance Broken Down

ConAgra Brands Inc. CAG Stocks' Technical Performance Over The Past Year
ConAgra Brands Inc. CAG Stocks’ Technical Performance Over The Past Year

CAG Stock Price: $36.36

10 Day Moving Average: $36.22

50 Day Moving Average: $37.75

200 Day Moving Average: $34.75

RSI: 44.51

MACD: -0.449

Yesterday, CAG stock completed a bullish MACD crossover, dropping -0.14% on the day’s session.

Recent trading volumes have been about average compared to the year prior & their RSI is neutral, as the stock has been consolidating over the last couple of weeks.

Recent candlesticks are signaling future declines in the near-term, which can provide more favorable entry points for traders & investors.

CAG stock has support at the $36.22 (10 day moving average), $35.67 & $35.65/share price levels, as they try to break out above their $36.44, $37.75 (50 day moving average) & $40.93/share resistance levels.

ConAgra Brands Inc. CAG Stock As A Long-Term Investment

Long-term focused investors will like CAG stock’s valuation metrics, with a 25.4 P/E (ttm) & a 1.97 P/B (mrq).

They recently reported 8.3% Quarterly Revenue Growth Y-o-Y, with 38.6% Quarterly Earnings Growth Y-o-Y.

Their balance sheet will require a more thorough examination, with $39.7M of Total Cash (mrq) & $9.65B of Total Debt (mrq).

CAG stock pays a 3.53% dividend, which may not be sustainable in the long-run, as their payout ratio is 91.13%.

85.3% of CAG stock’s outstanding share float is owned by institutional investors.

ConAgra Brands Inc. CAG Stock As A Short-Term Trade Using Options

Traders with shorter time horizons can use options to profit from price movements in CAG stock, while protecting their portfolio from volatlity.

I am looking at the contracts with the 3/17 expiration date.

The $36, $34 & $35 call options are all in-the-money, listed from highest to lowest level of open interest.

The $37, $38 & $40 puts are also all in-the-money, with the former being more liquid than the latter strikes.

Tying It All Together

CAG stock has many interesting attributes that traders & investors are sure to like.

Investors will like their valuation metrics, but may want to look deeper into the status of their dividend’s sustainability, as well as their balance sheet before investing.

Traders will like their recent technical performance & weekly options expiration dates.

All-in-all, it is worth taking a closer look into CAG stock to see how it fits into your portfolio strategy.

*** I DO NOT OWN SHARES OR OPTIONS CONTRACTS IN CAG STOCK AT THE TIME OF PUBLISHING THIS ARTICLE ***
Sempra Energy SRE Stock Analysis

Sempra Energy stock trades under the ticker SRE & has shown recent bullishness that traders & investors should research further into.

SRE stock closed at $158.49/share on 2/17/2023.

Sempra Energy SRE Stock’s Technical Performance Broken Down

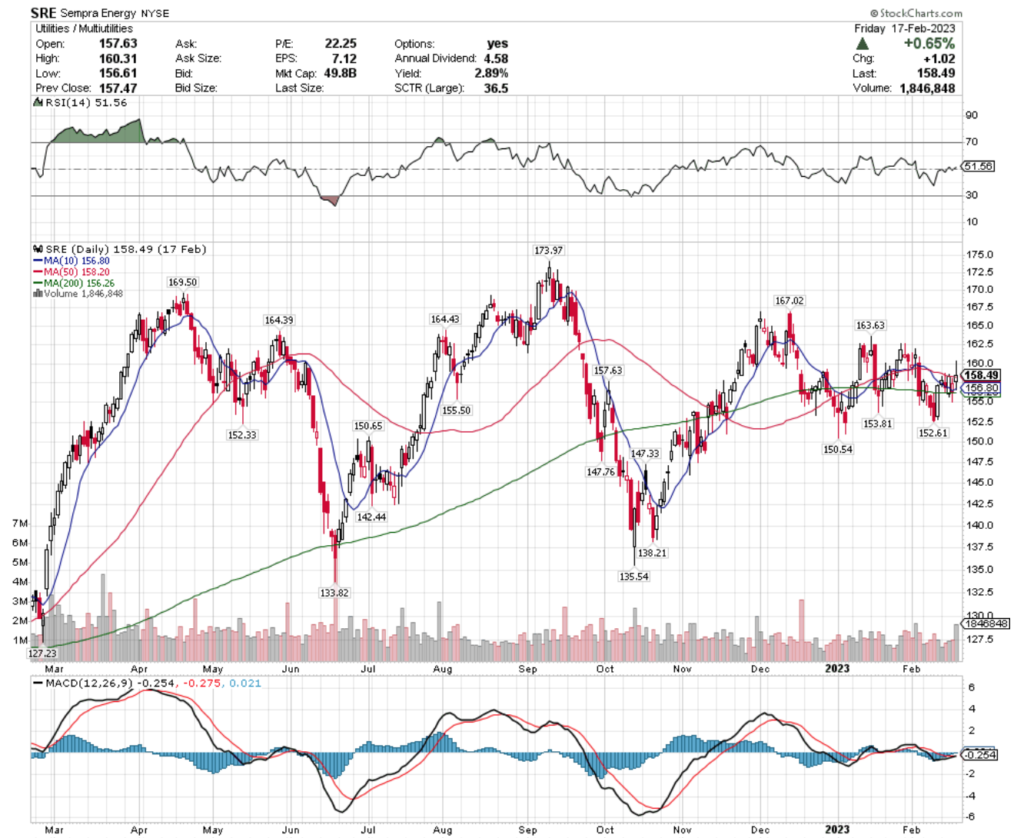
Sempra Energy SRE Stock's Technical Performance Over The Past Year
Sempra Energy SRE Stock’s Technical Performance Over The Past Year

SRE Stock Price: $158.49

10 Day Moving Average: $156.80

50 Day Moving Average: $158.20

200 Day Moving Average: $156.26

RSI: 51.56

MACD: -0.254

On Friday, SRE stock completed a bullish MACD crossover, gaining +0.65% on the day’s session.

Recent trading volumes have been slightly below average compared to the year prior & their RSI is neutral after consolidating over the last few months.

SRE stock has support at the $158.20, $157.63 & $156.80/share price levels, as they try to break out above their $163.63, $164.39 & $164.43/share resistance levels.

Sempra Energy SRE Stock As A Long-Term Investment

Long-term focused investors will like SRE stock’s valuation metrics, with a 22.02 P/E (ttm) & 1.89 P/B (mrq).

They recently reported 20% Quarterly Revenue Growth Y-o-Y.

Their balance sheet will require a more thorough examination before investment, with $690M of Total Cash (mrq) & $27B of Total Debt (mrq).

SRE stock pays a 2.88% dividend, which may not be sustainable in the long-run, as their payout ratio is 63.43%.

88.69% of SRE stock’s outstanding share float is owned by institutional investors.

Sempra Energy SRE Stock As A Short-Term Trade Using Options

Traders with shorter time horizons can trade options to profit from SRE stock’s price movements, while protecting their portfolios from volatility.

I am looking at the contracts with the 4/21 expiration date.

The $150, $155, $140 & $145 call options are all in-the-money, listed from highest to lowest level of open interest.

The $160, $165 & $170 puts are also all in-the-money, with the former being more liquid than the latter strikes.

Tying It All Together

SRE stock has many interesting characteristics that traders & investors will find appealing.

Investors will like their valuation metrics & dividend yield, but may want to more thoroughly review their balance sheet before investing.

Traders will like their recent technical performance.

All-in-all, it is worth taking a closer look into SRE stock to see how it fits into your portfolio strategy.

*** I DO NOT OWN SHARES OR OPTIONS CONTRACTS IN SRE STOCK AT THE TIME OF PUBLISHING THIS ARTICLE ***
Weekly Stock & ETF Market Review 2/19/2023

Last week’s big word for markets was inflation, with CPI prints & Fed speakers all echoing that more needs to be done to reach their target goals.

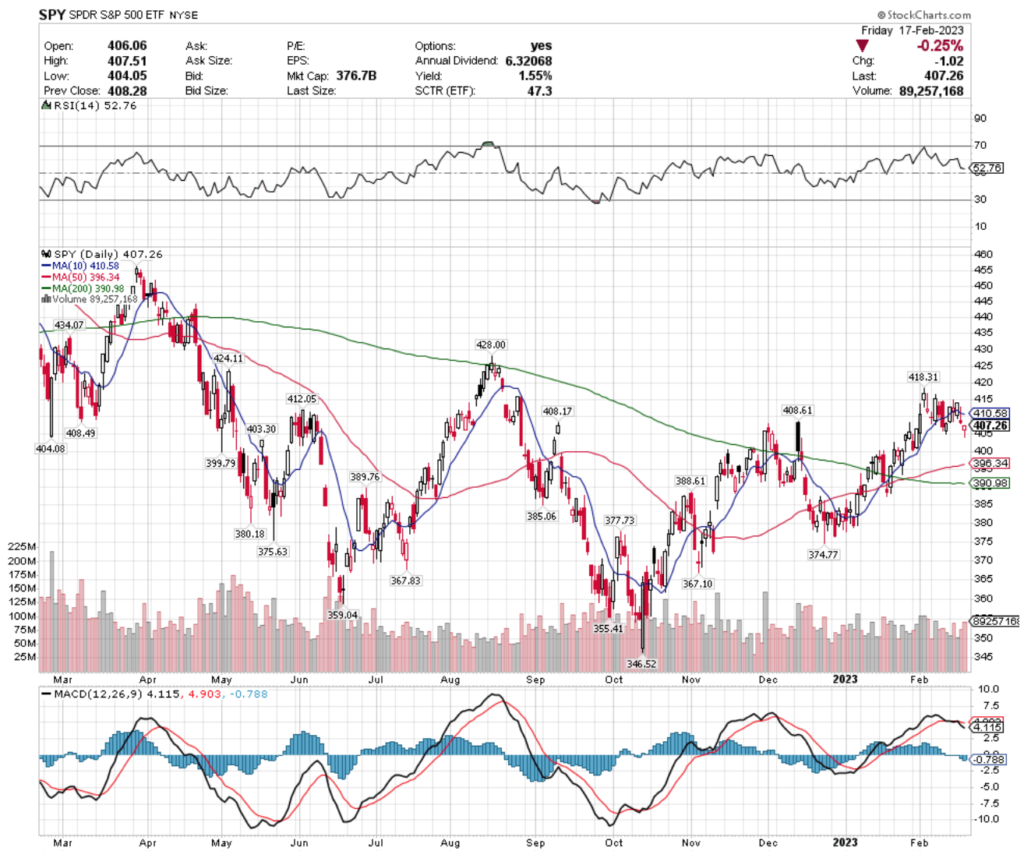
SPY, the SPDR S&P 500 ETF dropped -0.19% this past week, floating around the same $407-8 price level that has played critical support & resistance.

SPY ETF -  SPDR S&P 500 ETF's Technical Performance Over The Past Year
SPY ETF – SPDR S&P 500 ETF’s Technical Performance Over The Past Year

Their overhead resistance levels are $408.17, $406.49 & $408.61, with support at the $404.08, $403.30 & $399.79.

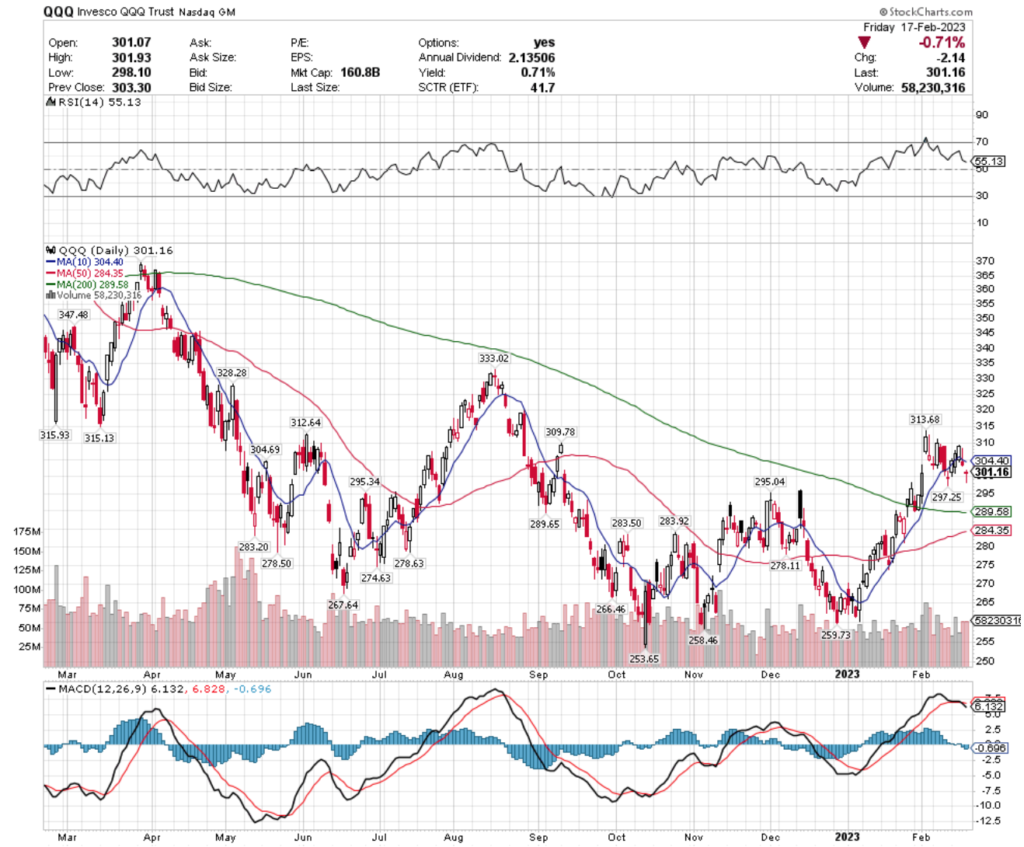
QQQ, the Invesco QQQ Trust ETF finished the week up +0.49%.

QQQ ETF - Invesco QQQ Trust ETF's Technical Performance Over The Past Year
QQQ ETF – Invesco QQQ Trust ETF’s Technical Performance Over The Past Year

They have support at the $297.25, $295.34 & $295.04, as they look to try to break above their $304.40, $304.69 & $309.78 resistance levels.

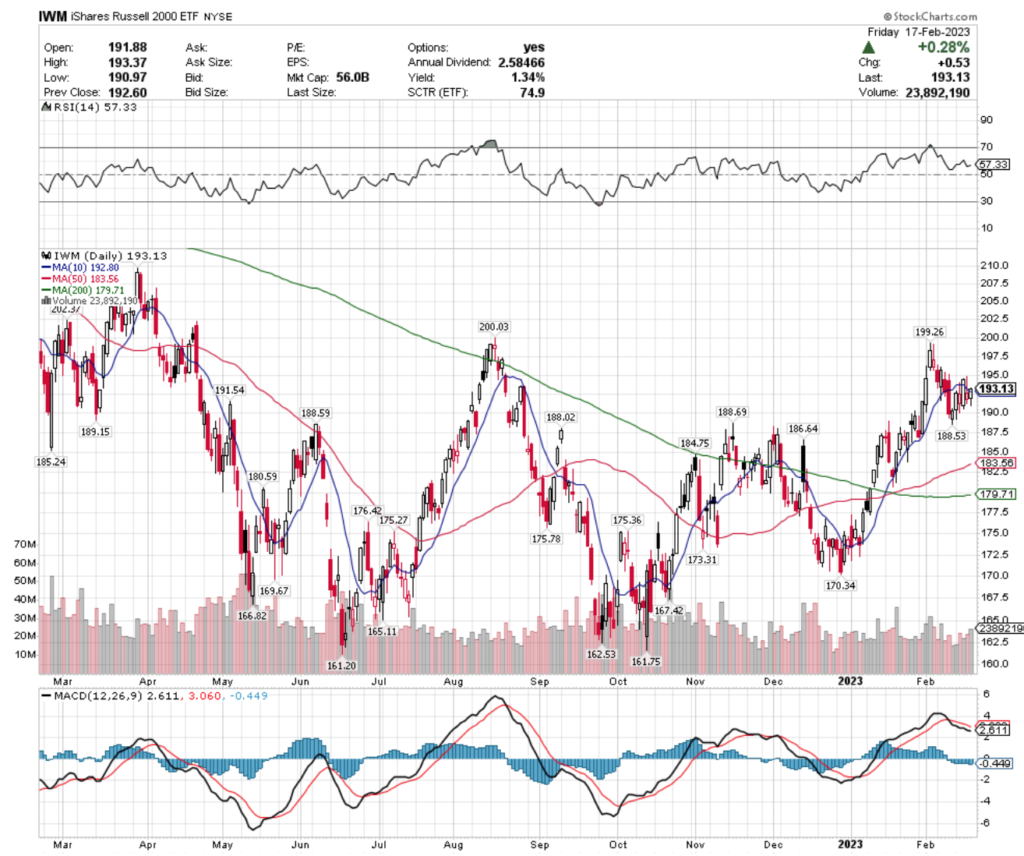
IWM, the iShares Russell 2000 ETF finished the week +1.48%, with smaller cap stocks having the strongest week based on the major indexes.

IWM ETF - iShares Russell 2000 ETF's Technical Performance Over The Past Year
IWM ETF – iShares Russell 2000 ETF’s Technical Performance Over The Past Year

They enter this week with support at the $192.80. $191.54 & $189.15 & their nearest resistance points are $199.26 & $200.03/share.

Let’s dive into this week’s top & bottom performing ETFs that provide dividends & also have tradable options.

Please note as reading this week’s post that due to anticipated volatility, using options strategies is the most effective way to trade the names listed below, but it began to sound redundant during the publishing.

Mexico (EWW), Steel (SLX), US Home Construction (ITB) & The Netherlands (EWN) Are All Bullishly Leading The Market

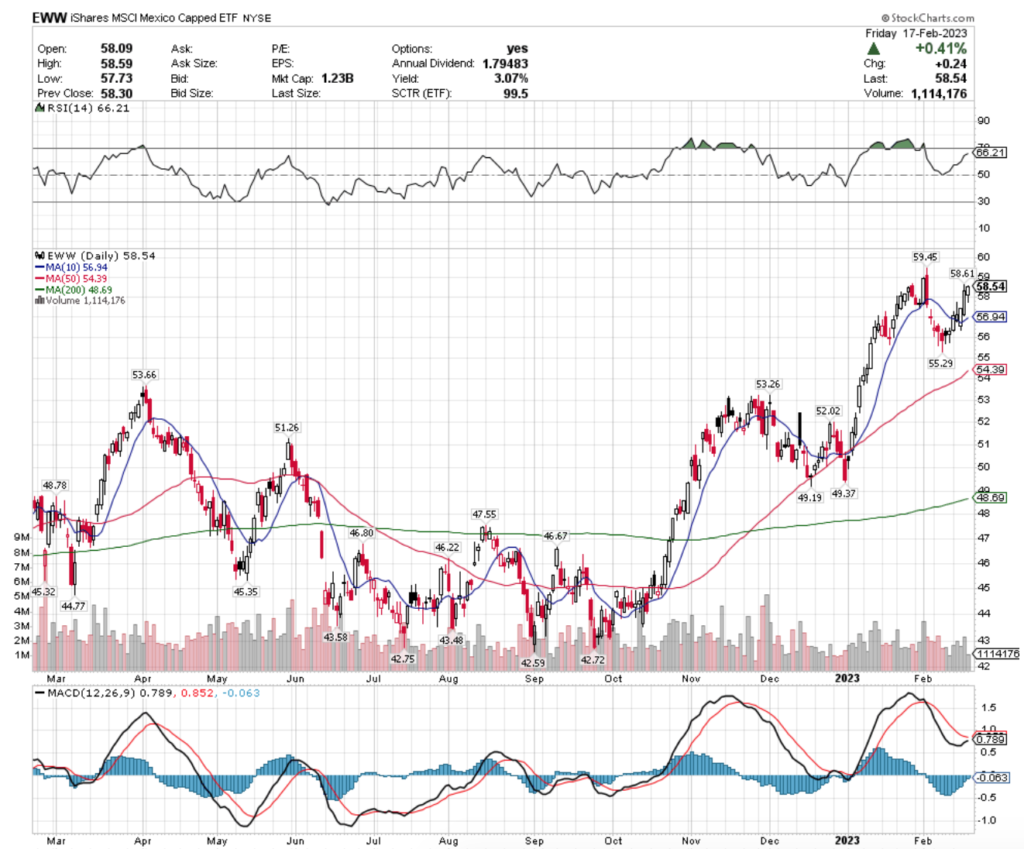
EWW, the iShares MSCI Mexico Capped ETF has gained +20.53% over the past year, gaining +37.45% since their lows of September 2022.

EWW ETF - iShares MSCI Mexico Capped ETF's Technical Performance Over The Past Year
EWW ETF – iShares MSCI Mexico Capped ETF’s Technical Performance Over The Past Year

They offer a 3% cushion in the form of a dividend for investors who hold for a year, but their RSI is nearing overbought territory.

While their MACD shows that there could be a bit more momentum in the near-term, current resistance levels are $58.61 & $59.45, near the 52 week high.

It appears best to wait & see how their price behaves around their $56.94, $55.29 & $54.39 support levels before making any moves on EWW.

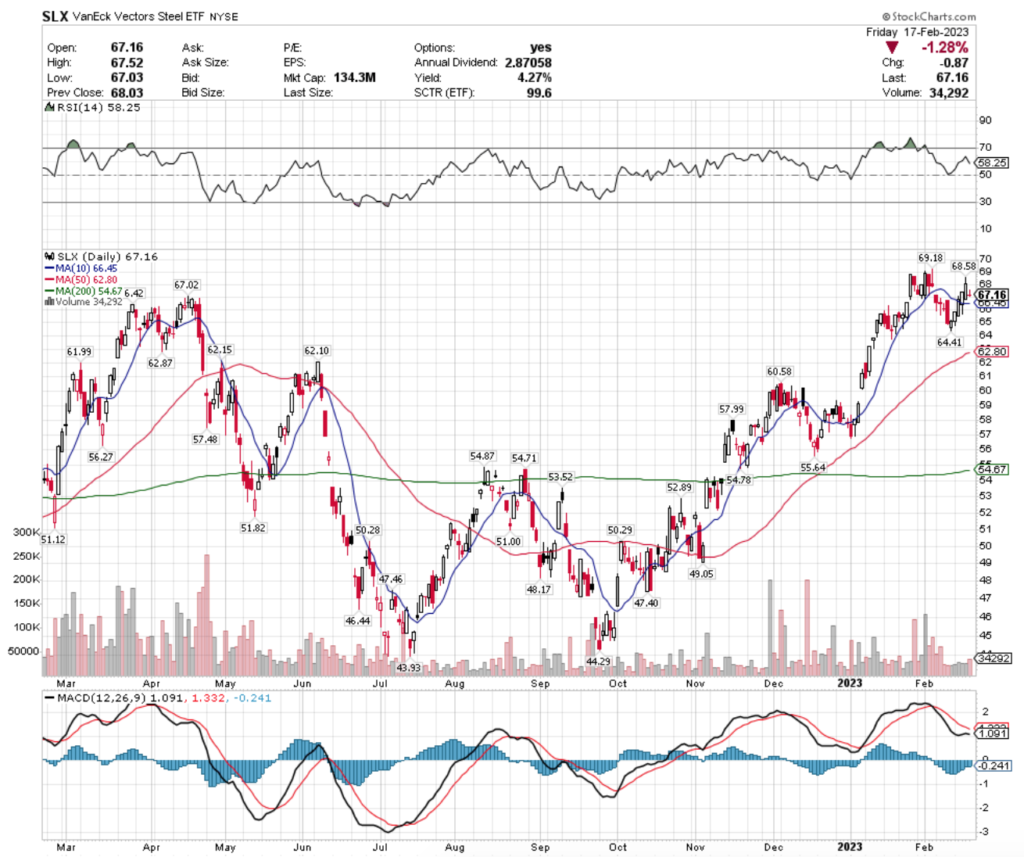
SLX, the VanEck Vectors Steel ETF has gained +24.21% over the past year, climbing +52.88% since their low in July 2022.

SLX ETF - VanEck Vectors Steel ETF's Technical Performance Over The Past Year
SLX ETF – VanEck Vectors Steel ETF’s Technical Performance Over The Past Year

They offer a better cushion for reducing the impact of a price decline in the name of a 4.27% dividend.

However, just like EWW, SLX’s primary resistance levels now are at & near their 52 week high levels, $68.58 & $69.18/share.

Their support levels of $67.02, $66.45 & $66.42 will be interesting to get more insight into where SLX goes next.

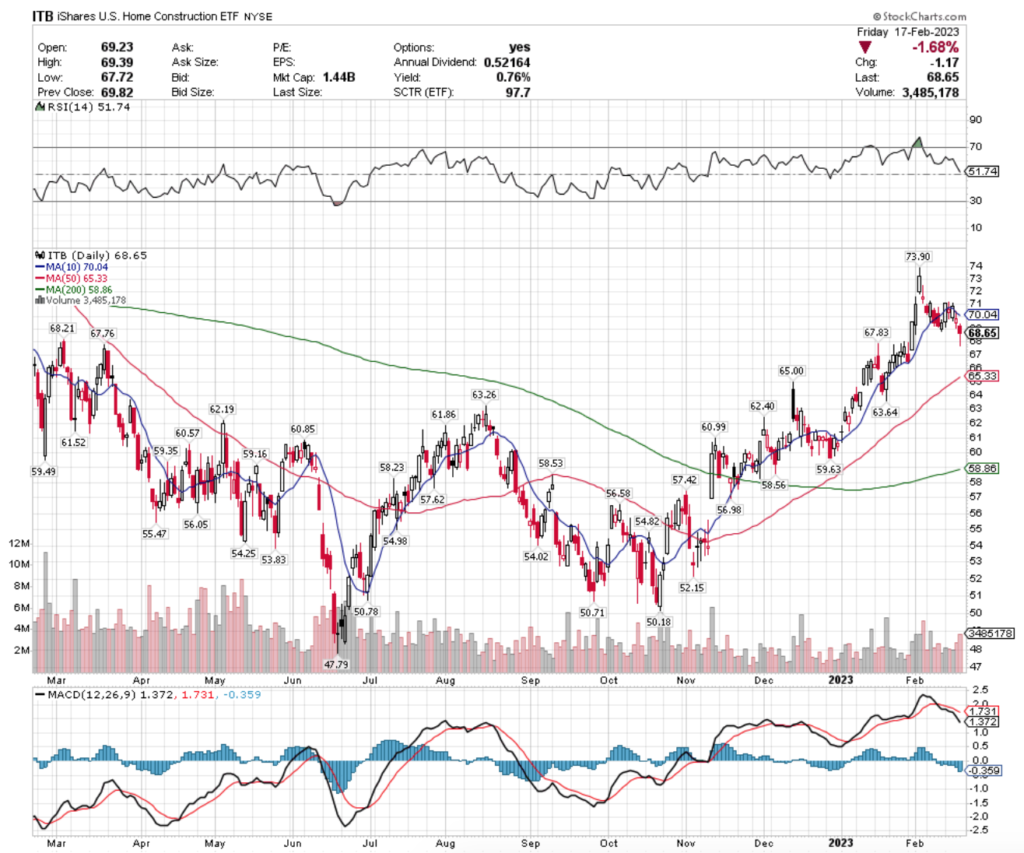
ITB, the iShares US Home Construction ETF has gained +3.58% over the past year, with a +43.65% gain from their low of July 2022.

ITB ETF - iShares US Home Construction ETF's Technical Performance Over The Past Year
ITB ETF – iShares US Home Construction ETF’s Technical Performance Over The Past Year

They have less protection from their modest 0.76% dividend, and signal further declines in the near-term based on their bearish MACD & most recent candlesticks.

With overhead resistance also near the 52 week highs at $70.04 & $73.90, it would be best to wait & see how they behave around their $68.21, $67.83 & $67.76 support levels before entering a new position.

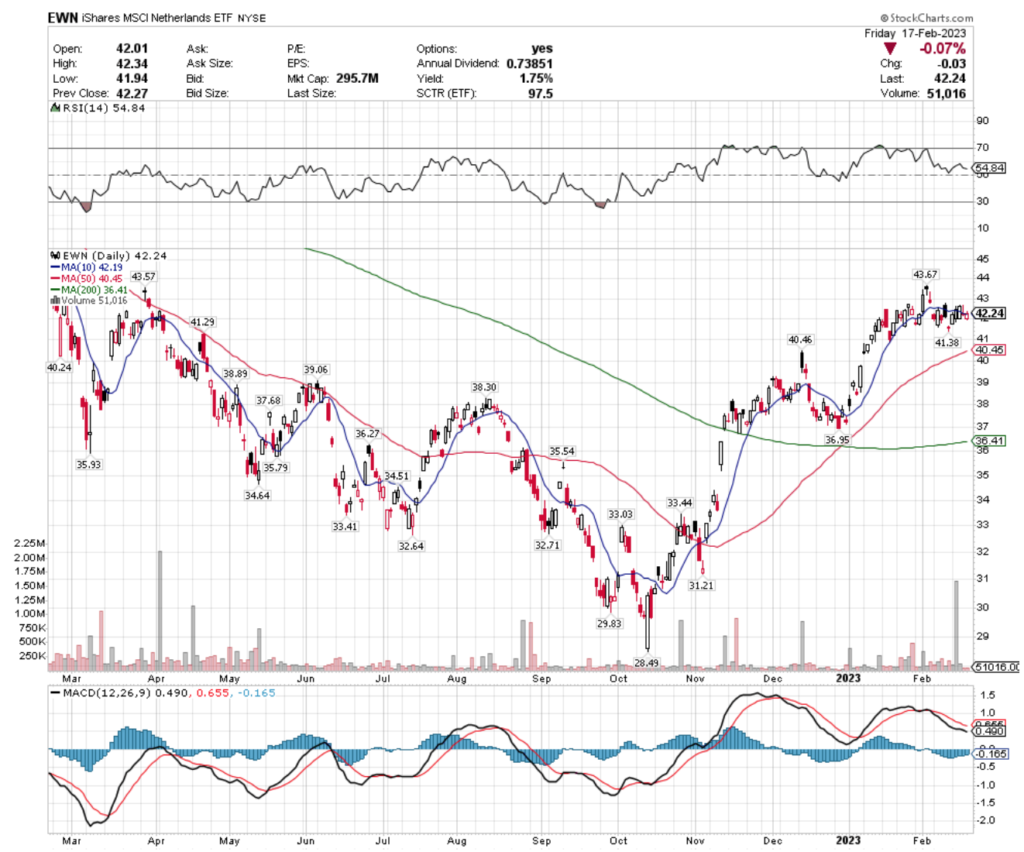
EWN, the iShares MSCI Netherlands ETF has dropped -4.8% over the last year, but has bounced back +48.26% since their low of October 2022.

EWN ETF - iShares MSCI Netherlands ETF's Technical Performance Over The Past Year
EWN ETF – iShares MSCI Netherlands ETF’s Technical Performance Over The Past Year

They’ve spent much of 2023 so far consolidating in the $41-43 range & their MACD signals that there is more near-term losses on the horizon.

With only 1.75% in protection from their dividend & resistance at the $43.57 & $43.67/share range, it would be wise to see how they behave at their $42.19, $41.38 & $41.29/share support levels before entering a position.

China (YINN), Utilities (UTSL), Psychedelics (PSIL) & Junior Gold Miners (SGDJ) Are All Bearishly Lagging The Market

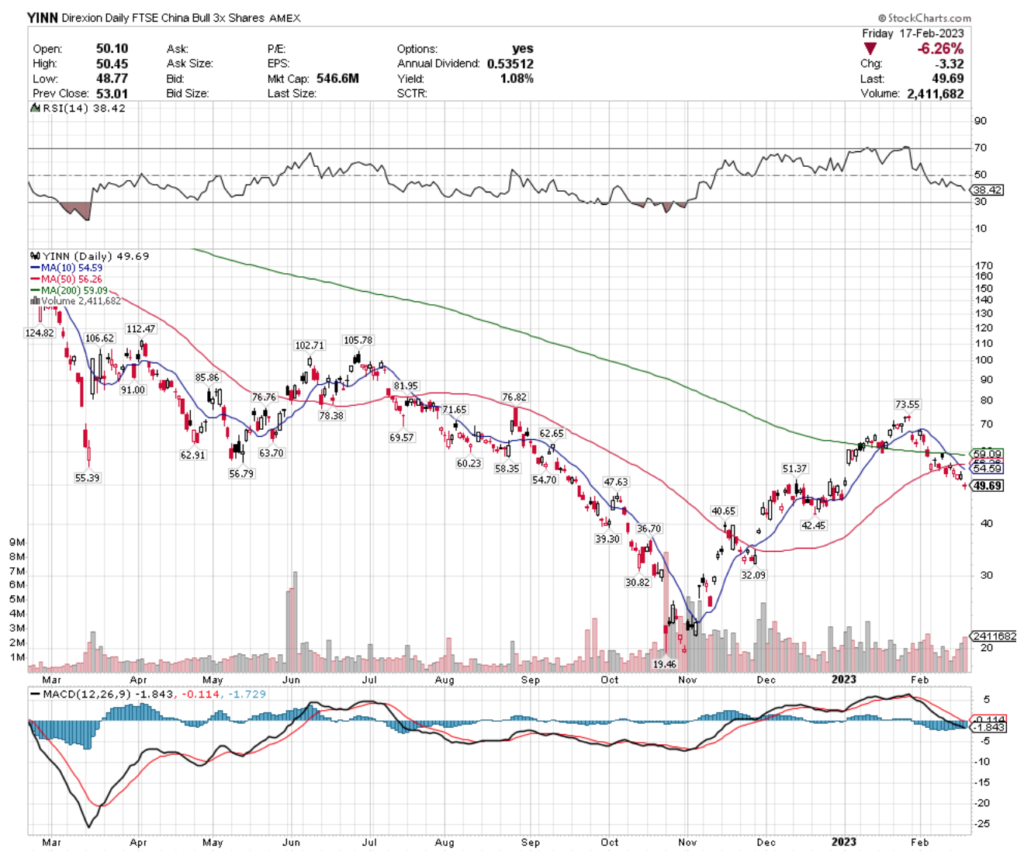
YINN, the Direxion Daily FTSE China Bull 3x Shares has dropped -70.34% over the last year.

YINN ETF - Direxion Daily FTSE China Bull 3x Shares's Technical Performance Over The Past Year
YINN ETF – Direxion Daily FTSE China Bull 3x Shares’s Technical Performance Over The Past Year

Their MACD is beginning to turn less bearish, with an RSI approaching oversold territory.

Their support level of $47.63 will be critical, as their next support levels from the past 52 weeks are at $42.45 & $40.65 & their 1% dividend does not offer much cushion.

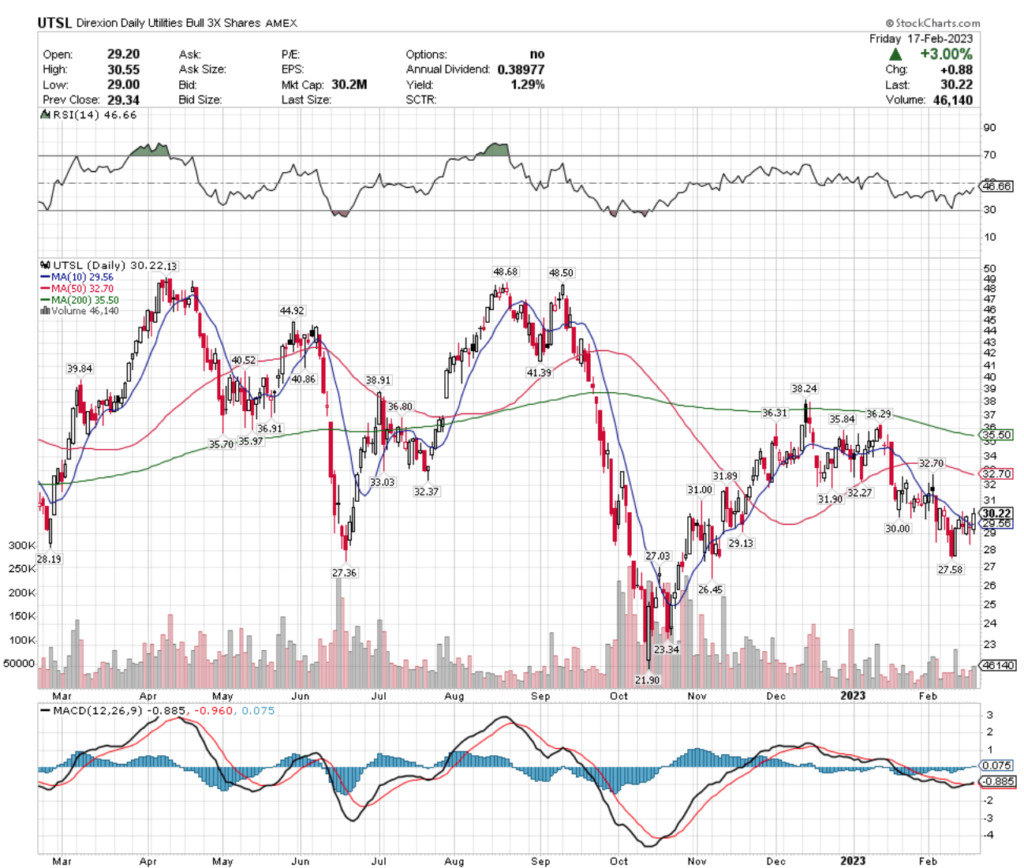
UTSL, the Direxion Daily Utilities Bull 3x Shares has fallen -1.5% over the past year, with a -38.49% decline since their high in April of 2022.

UTSL, the Direxion Daily Utilities Bull 3x Shares's Technical Performance Over The Past Year
UTSL, the Direxion Daily Utilities Bull 3x Shares’s Technical Performance Over The Past Year

Their MACD recently turned bullish, and their RSI is approaching neutral again, while we wait to see if they pivot upwards from their $27.58 support level they just touched.

UTSL has resistance overhead at the $31 & $31.89/share price levels, with additional support at the $30.22, $30 & $29.56/share (10 Day Moving Average) price points.

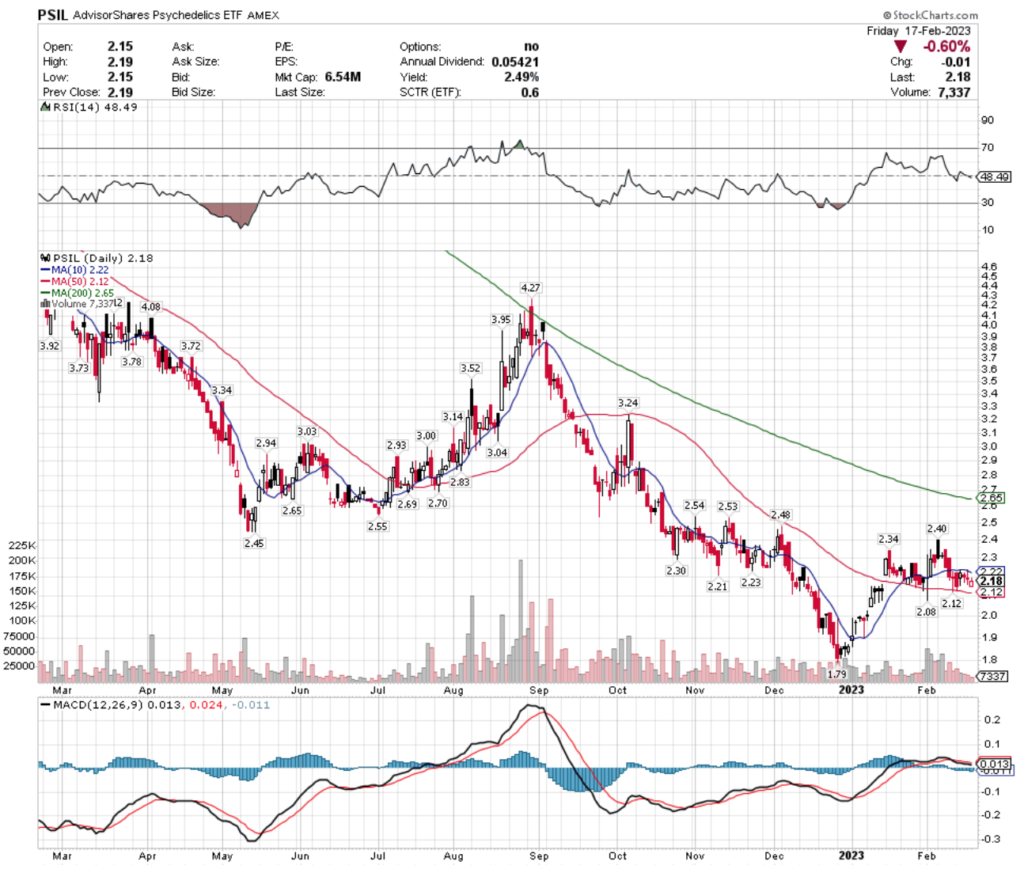
PSIL, the AdvisorShares Psychedelics ETF has dropped -1.5% over the past year, but has fallen -38.49% from their high of April 2022.

PSIL ETF - AdvisorShares Psychedelics ETF's Technical Performance Over The Past Year
PSIL ETF – AdvisorShares Psychedelics ETF’s Technical Performance Over The Past Year

Their recent candlesticks signal that there is additional declines for PSIL in the near-term that their 2.5% dividend can’t protect against.

PSIL has support at the $2.12 (2 points), $2.08 & $1.79/share, while their resistance levels are currently at $2.21, $2.22 & $2.23.

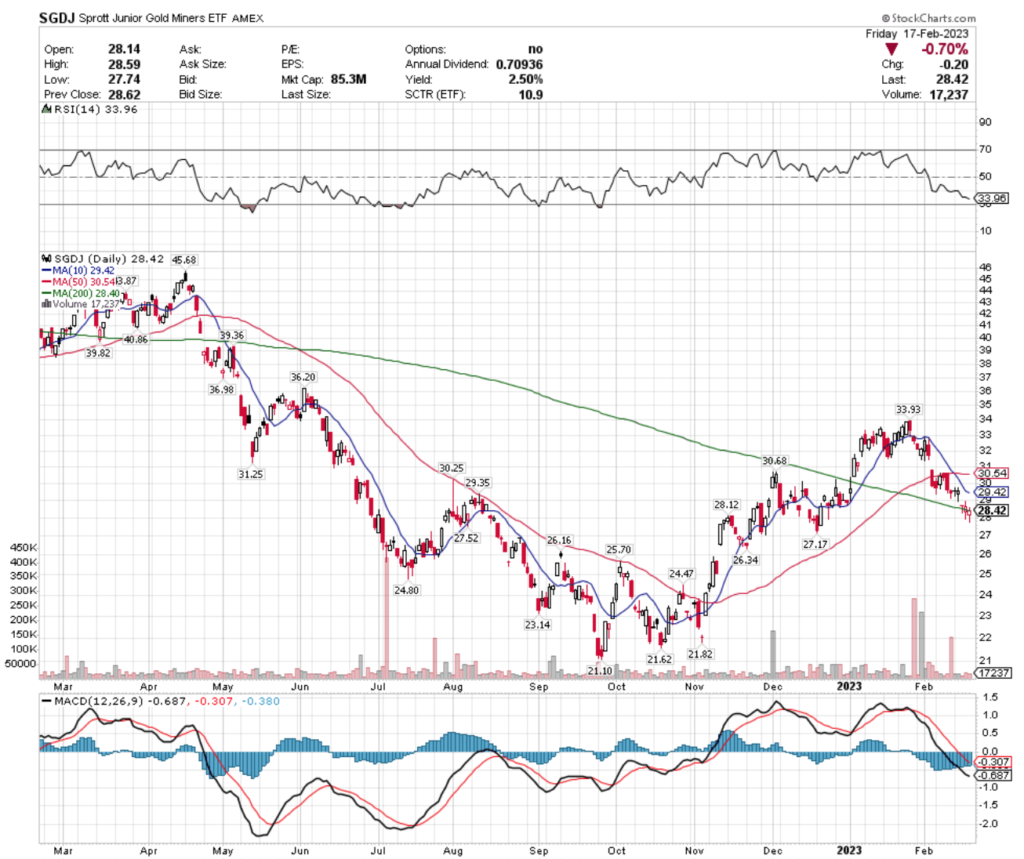
SGDJ, the Sprott Junior Gold Miners ETF has dropped -30.33% over the last year, and decreased -37.78% since their high of April 2022.

SGDJ ETF - Sprott Junior Gold Miners ETF's Technical Performance Over The Past Year
SGDJ ETF – Sprott Junior Gold Miners ETF’s Technical Performance Over The Past Year

Their $28.12 support level will be important to watch, with the next levels coming in at $27.52 & $27.17.

SGDJ’s MACD is beginning to level out, but it is still too early to tell if it will turn bullish in the near-term or not, although their RSI is fast approaching oversold territory.

SGDJ’s next resistance levels are $29.35, $29.42 & $30.25.

Tying It All Together

This week will kick off slowly, with the markets being closed Monday in observance of President’s Day.

Tuesday we get the S&P Flash US Services PMI, S&P Flash US Manufacturing PMI & Existing Home Sales data.

Wednesday brings us the FOMC Minutes of the February 1st Meeting, followed by Initial Jobless Claims, GDP & Atlanta Fed President Bostic speaking on Thursday.

Friday concludes the week with Consumer Spending, Personal Income (both nominal), PCE Index, Core PCE Index, Core PCE Y-o-Y, New Home Sales & Consumer Sentiment numbers.

Have a great week!

*** I DO NOT OWN SHARES OR OPTIONS CONTRACTS IN SPY, QQQ, IWM, EWW, SLX, ITB, EWN, YINN, UTSL, PSIL or SGDJ AT THE TIME OF PUBLISHING THIS ARTICLE ***
Juniper Networks JNPR Stock Analysis

Juniper Networks stock trades under the ticker JNPR & has shown recent bullishness that traders & investors should research further into.

JNPR stock closed at $31.53/share on 2/16/2023.

Juniper Networks JNPR Stock’s Technical Performance Broken Down

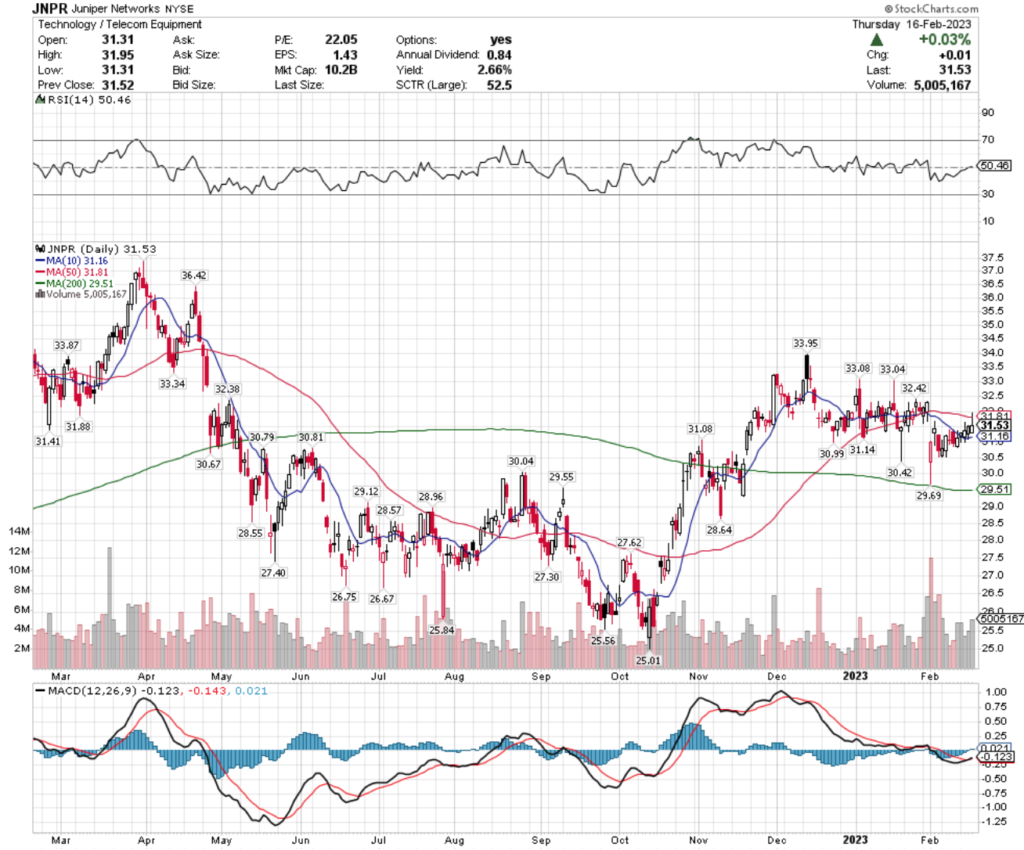
Juniper Networks JNPR Stock's Technical Performance Over The Past Year
Juniper Networks JNPR Stock’s Technical Performance Over The Past Year

JNPR Stock Price: $31.53

10 Day Moving Average: $31.16

50 Day Moving Average: $31.81

200 Day Moving Average: $29.51

RSI: 50.46

MACD: -0.123

Yesterday, JNPR stock completed a bullish MACD crossover, gaining 0.03% on the day’s session.

Recent trading volumes have been slightly above average compared to the year prior & their RSI is neutral after the stock has spent the last few months in a consolidation range.

Yesterday’s shooting star candlestick implies that there will be near-term weakness which will provide more favorable entries for investors & traders.

JNPR stock has support at the $31.41 & $31.16 (10 Day Moving Average), as they try to break out & above the $31.81 (50 Day Moving Average) & $31.88/share resistance levels.

Juniper Networks JNPR Stock As A Long-Term Investment

Long-term oriented investors will like JNPR stock’s valuation metrics, with a 22.05 P/E (ttm) & a 2.28 P/B (mrq).

They recently reported 11.5% Quarterly Revenue Growth Y-o-Y, with 35.7% Quarterly Earnings Growth Y-o-Y.

Their balance sheet looks decent upon first glance, with $1.09B of Total Cash (mrq) & $1.85B of Total Debt (mrq).

JNPR stock pays a 2.66% dividend, which appears to be sustainable in the long-run, with a 58.7% payout ratio.

92.2% of JNPR stock’s outstanding share float is owned by institutional investors.

Juniper Networks JNPR Stock As A Short-Term Trade Using Options

Short-term focused traders can use options to profit from price movements in JNPR stock, while protecting their portfolios from volatility.

I am looking at the contracts with the 3/17 expiration date.

The $31, $30 & $28 call options are all in-the-money, listed from highest to lowest level of open interest.

The $32, $34 & $33 puts are also all in-the-money, with the former being more liquid than the latter strikes.

As they have weekly expirations, expect to see more contracts for this expiration date as the day draws nearer.

Tying It All Together

JNPR stock has many interesting attributes that traders & investors are sure to find appealing.

Investors will like their valuation metrics, balance sheet & dividend yield.

Traders will like their recent technical performance, as well as their weekly options expiration dates.

All-in-all, it is worth taking a closer look into JNPR stock to see how it fits into your portfolio strategy.

*** I DO NOT OWN SHARES NOR OPTIONS POSITIONS IN JNPR STOCK AT THE TIME OF PUBLISHING THIS ARTICLE ***
Kraft Heinz Co. KHC Stock Analysis

Kraft Heinz Co. stock trades under the ticker KHC & has shown recent bullishness that traders & investors should look closer into.

KHC stock closed at $40.13/share on 2/15/2023.

Kraft Heinz Co. KHC Stock’s Technical Performance Broken Down

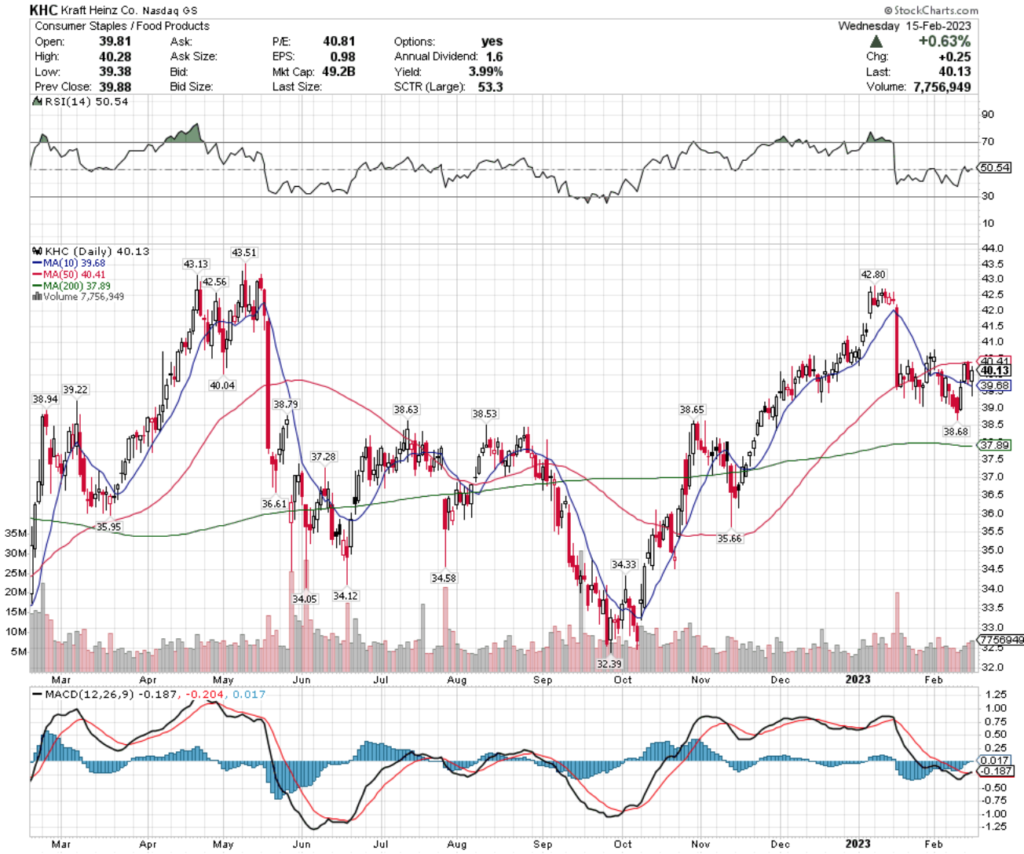
Kraft Heinz Co. KHC Stock's Technical Performance Over The Past Year
Kraft Heinz Co. KHC Stock’s Technical Performance Over The Past Year

KHC Stock Price: $40.13

10 Day Moving Average: $39.68

50 Day Moving Average: $40.41

200 Day Moving Average: $37.89

RSI: 50.54

MACD: -0.187

Yesterday, KHC stock completed a bullish MACD crossover, gaining +0.63% on the day’s session.

Recent trading volumes have been about average compared to the month prior, and their RSI is currently neutral.

They’ve recently been consolidating, with more near-term weakness signaled ahead, which will provide investors & traders with more favorable entry points.

KHC stock has support at the $40.04 & $39.68/share price levels, as they try to break out & above the $40.41 & $42.56/share resistance levels.

Kraft Heinz Co. KHC Stock As A Long-Term Investment

Long-term oriented investors will like KHC stock’s valuation metrics, with a 40.44 P/E (ttm) & a 1.01 P/B (mrq).

Investors will want to look into their recent growth metrics, with 2.9% Quarterly Revenue Growth Y-o-Y & -41.1% Quarterly Earnings Growth Y-o-Y.

Their balance sheet will also require a more thorough examination before investing, with $997M in Total Cash (mrq) & $20.24B of Total Debt (mrq).

KHC stock pays a 4.01% dividend, which may not be sustainable in the long-run as their payout ratio is over 100%.

80.33% of KHC stock’s outstanding share float is owned by institutional investors.

Kraft Heinz Co. KHC Stock As A Short-Term Trade Using Options

Traders with shorter time horizons can trade options to profit from KHC stock’s price movements, while protecting their portfolios from volatility.

I am looking at the contracts with the 3/17 expiration date.

The $40, $30 & $37.50 call options are all in-the-money, listed from highest to lowest level of open interest.

The $42.50 & $50 puts are also all in-the-money, with the former strike being more liquid than the latter two.

Tying It All Together

KHC stock has many unique attributes that traders & investors will like.

Investors will like their valuation metrics & dividend yield, but should be aware that it may not be sustainable in the long-run at such high levels.

Traders will like their recent technical performance, as well as how liquid their options are.

Overall, it is worth taking a closer look into KHC stock to see how it fits into your portfolio strategy.

*** I DO NOT OWN SHARES OR OPTIONS POSITIONS IN KHC STOCK AT THE TIME OF PUBLISHING THIS ARTICLE ***
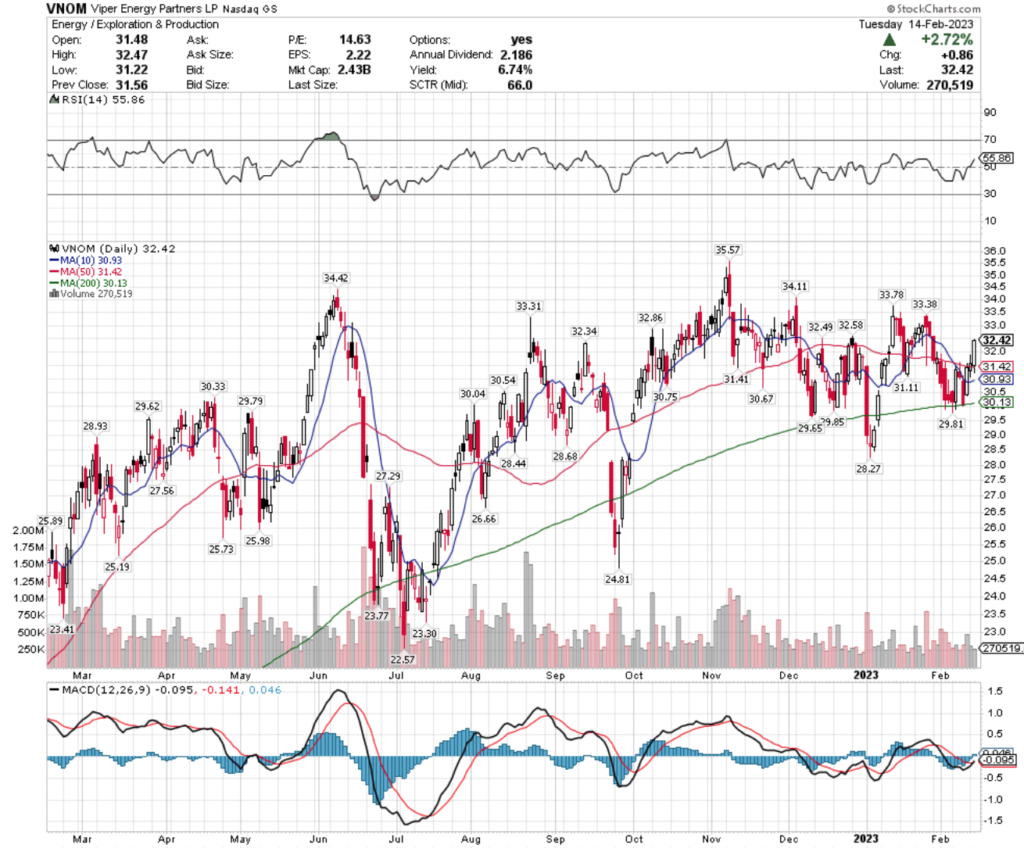
Viper Energy Partners LP VNOM Stock Analysis

Viper Energy Partners LP stock trades under the ticker VNOM & has shown recent bullishness that traders & investors should look closer into.

VNOM stock closed at $32.42/share on 2/14/2023.

Viper Energy Partners LP VNOM Stock’s Technical Performance Broken Down

Viper Energy Partners LP VNOM Stock's Technical Performance Over The Past Year
Viper Energy Partners LP VNOM Stock’s Technical Performance Over The Past Year

VNOM Stock Price: $32.42

10 Day Moving Average: $30.93

50 Day Moving Average: $31.42

200 Day Moving Average: $30.13

RSI: 55.86

MACD: -0.095

Yesterday, VNOM stock completed a bullish MACD crossover, gaining 2.72% on they day’s session.

Their RSI is neutral at 55 & recent trading volumes have been below average compared to the year prior, as their price has been consolidating over the last few months.

VNOM stock has support at the $32.34 & $31.42/share price levels, as they try to break out above the $32.49 & $32.58/share resistance levels.

Viper Energy Partners LP VNOM Stock As A Long-Term Investment

Long-term oriented investors will like VNOM stock’s 13.83 P/E (ttm), but may find their 3.22 P/B (mrq) to be a bit rich.

They recently reported 64.1% Quarterly Revenue Growth Y-o-Y, with 371.4% Quarterly Earnings Growth Y-o-Y.

Their balance sheet will require a more thorough examination, with $11.62M of Total Cash (mrq) & $669.64M of Total Debt (mrq).

VNOM stock pays a 7.73% dividend, which may not be sustainable in the long-run, as their payout ratio is over 100%.

78.4% of VNOM stock’s outstanding share float is owned by institutional investors.

Viper Energy Partners LP VNOM Stock As A Short-Term Trade Using Options

Traders with shorter time horizons can trade options to profit from price movements in VNOM stock, while hedging their portfolios against volatility.

I am looking at the contracts with the 3/17 expiration date.

The $32, $31 & $30 call options are all in-the-money, listed from highest to lowest level of open interest.

The $33, $35 & $34 puts are also all in-the-money, with the former being more liquid than the latter strikes.

Tying It All Together

VNOM stock has many interesting attributes that traders & investors will find appealing.

Investors will like their valuation metrics, but should be aware that their dividend yield is not well covered by earnings or cash flows.

Traders will like their recent technical performance, as well as how liquid their options are.

Overall, it is worth taking a closer look into VNOM stock to see how it fits into your portfolio strategy.

*** I DO NOT OWN SHARES OR OPTIONS POSITIONS IN VNOM STOCK AT THE TIME OF PUBLISHING THIS ARTICLE ***