Union Pacific Corp. UNP Stock Analysis

Union Pacific Corp. stock trades under the ticker UNP & has shown recent bullishness that traders & investors should take a closer look into.

UNP stock closed at $249.32/share on 2/15/2022.

Union Pacific Corp. UNP Stock’s Technicals Broken Down

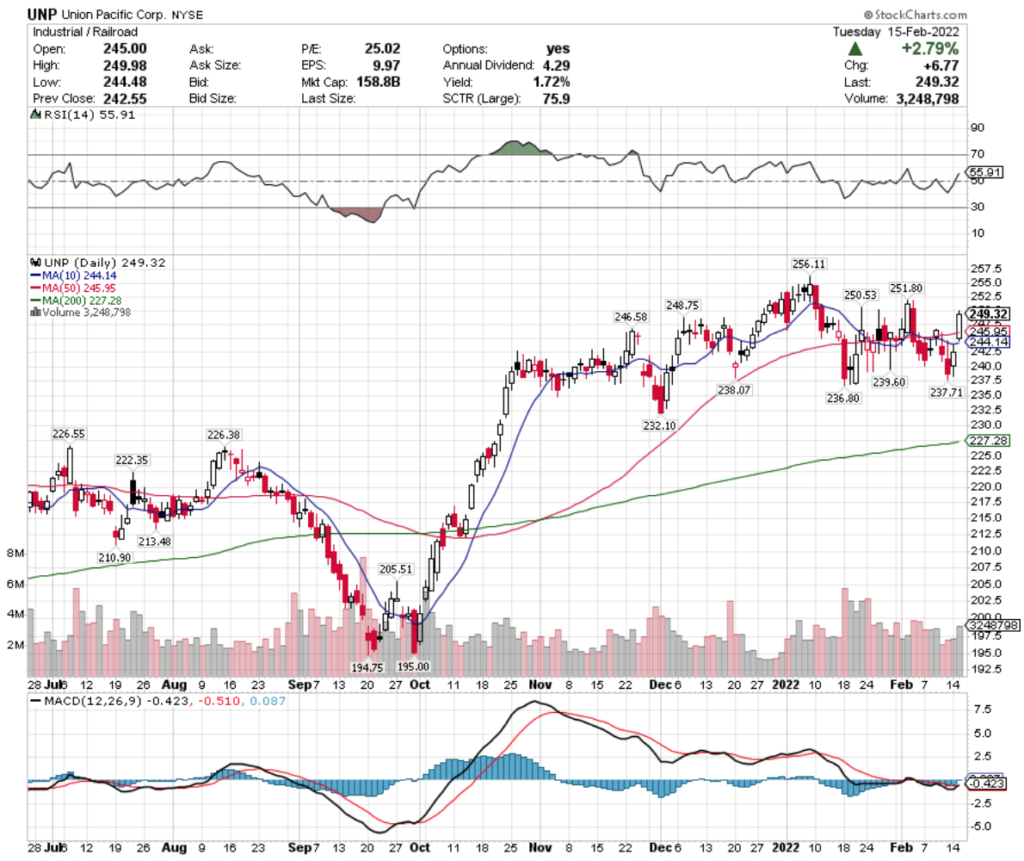
UNP Stock Price: $249.32

10 Day Moving Average: $244.14

50 Day Moving Average: $245.95

200 Day Moving Average: $227.28

RSI: 55.91

MACD: -0.423

Yesterday, UNP stock completed a bullish MACD crossover, while gapping up & breaking out above its 10 & 50 day moving averages.

They have traded slightly above average volume in 2022 compared to the rest of the previous year & their RSI is neutral, signaling that there is more short-term momentum to come.

Their next levels to be watching for in terms of resistance are $250.53 & $251.80.

Union Pacific Corp. UNP Stock As A Long-Term Investment

Investors will find UNP stock’s P/E (ttm) to be modest at 24.38, but may balk at their P/B (mrq) of 10.91.

UNP stock saw 11.5% Quarterly Revenue Growth Y-o-Y, as well as 24% Quarterly Earnings GRowth Y-o-Y.

Their balance sheet will require a closer look before making an investment, as they have $1.01B in Total Cash (mrq) & $31.49B in Total Debt (mrq).

UNP stock’s dividend yield is 1.77%, which looks to be stable in the long run as their payout ratio is 43.12%.

81.14% of UNP stock’s outstanding share float is held by institutional investors.

Union Pacific Corp. UNP Stock As A Short-Term Trade Using Options

Traders can use options to take advantage of UNP stock’s current momentum trajectory, as well as hedge against broader market volatility.

I am looking at the contracts with the 3/18 expiration date.

The $250 & $255 calls look appealing, and liquid, as they have healthy levels of open interest.

The $265 & $270 puts also look appealing, but are far less liquid, showing that the market has bullish sentiment for UNP stock in the near-term.

Tying It All Together

Overall, both traders & investors will find UNP stock to have appealing attributes.

Investors will like their dividend, as well as their healthy valuation metrics.

Traders will like their current momentum, as well as their liquid call options.

UNP stock is worth taking a closer look at, regardless of your trading strategy.

*** I DO NOT OWN SHARES OF UNP STOCK ***

Vector Group Ltd. VGR Stock Analysis

Vector Group Ltd. stock trades under the ticker VGR & has shown recent bullishness that traders & investors should take a closer look into.

VGR closed at $11.42/share on 2/14/2022.

Vector Group Ltd. VGR Stock’s Technicals Broken Down

Vector Group Ltd. VGR Stock's Technical Performance Over The Last Year

VGR Stock Price: $11.42

10 Day Moving Average: $11.24

50 Day Moving Average: $11.39

200 Day Moving Average: $10.15

RSI: 53.3

MACD: -0.032

Yesterday, VGR stock completed a bullish MACD crossover on below average volume compared to the last year.

With ~1.3% between their 10 & 50 Day Moving Averages, they look to have additional momentum in the near-term, as their RSI is still neutral.

The next levels of resistance are $11.66, $11.72 & $11.92, as they look to head back to their 2021 price levels.

Vector Group Ltd. VGR Stock As A Long-Term Investment

Investors will find VGR stock’s P/E (ttm) appealing at 8.37, although their P/B (mrq) is not positive.

VGR stock’s Quarterly Revenue Growth Y-o-Y is 27.8%, with Quarterly Earnings Growth Y-o-Y of 28.2%.

Their balance sheet will require a closer look by prospective investors, with Total Cash (mrq) of $678.83M & Total Debt (mrq) of $1.58B.

VGR stock’s dividend is 7.07%, which while it is appealing, may not be sustainable in the long-run, as their current Payout Ratio is 72%.

64% of VGR stock’s share float is held by institutional investors.

Vector Group Ltd. VGR Stock As A Short-Term Trade Using Options

Vector Group Ltd. stock has options that traders can use to capitalize on near-term momentum, as well as to ward off volatility-risks.

I am looking at the contracts with the 3/18 expiration date

The $10 & $12.50 calls look appealing, however they are currently very illiquid.

As there is another expiration date passing this Friday I expect to see more contracts written for March in the coming weeks.

They currently have no open interest on the $17.50 & $15 puts, but those are the contracts that I would be eyeing as February’s expiration date passes & new contracts begun being written.

Tying It All Together

Overall, there looks to be many advantages to VGR stock that both investors & traders will enjoy.

Traders will like their current momentum, and will need to keep an eye out as this expiration date passes in February & new contracts are written for March.

Investors will like their low P/E (ttm), as well as their dividend yield, but may be skeptical about their balance sheet & payout ratio.

VGR stock is worth taking a closer look at, regardless of your trading style.

*** I DO NOT OWN SHARES OF VGR STOCK ***

Tesla Inc. TSLA Stock Analysis

Tesla Inc. stock trades under the ticker TSLA & has shown recent bullishness that traders & investors should take a closer look into.

TSLA closed at $922/share on 2/8/2022.

Tesla Inc. TSLA Stock’s Technicals Broken Down

Tesla Inc. TSLA Stock's Technical Performance Over The Last Year

TSLA Stock Price: $922

10 Day Moving Average: $903.03

50 Day Moving Average: $1,007.63

200 Day Moving Average: $820.91

RSI: 45.19

MACD: -34.747

Yesterday, TSLA completed a bullish MACD crossover, trading on about average volume compared to the last year.

Their 10 Day Moving Average is ~12% below their 50 Day MA still, but with their RSI still below neutral, there looks to be more room for momentum in the coming days.

TSLA stock will need to break above the $947.77/share, before testing the $987/share level.

Tesla Inc. TSLA Stock As A Long-Term Investment

Investors may find TSLA stock’s valuation metrics to be too rich, with a P/E (ttm) of 294.59 & a P/B (mrq) of 34.66.

TSLA stock’s Quarterly Revenue Growth Y-o-Y is 64.9%, with 759.6% Quarterly Earnings Growth Y-o-Y.

Investors may want to look deeper into TSLA stock’s balance sheet, but will like it at first glance, with Total Cash (mrq) of $17.71B & Total Debt (mrq) of $6.83B.

They do not offer a dividend yield, and their beta is 2.01, meaning that they tend to move more aggressively & volatilely than the average market indexes.

42.32% of TSLA stock’s total share float is held by institutional investors.

Tesla Inc. TSLA Stock As A Short-Term Trade Using Options

TSLA stock has options that can be used by traders to take advantage of their price movements in either direction, while also hedging against volatility.

I am looking at the contracts with the 2/18 expiration date.

The $940 & $945 calls look interesting, and are fairly liquid with open interest levels just under 1,000 contracts each.

The $990 & $985 puts also look appealing, although they do have slightly less open interest.

Tying It All Together

Overall, TSLA stock has many interesting characteristics that traders & investors may find appealing.

Investors may find their balance sheet interesting, but may also be put off by their valuation metrics & lack of a dividend.

Traders will like their current momentum, as well as the liquidity of their options contracts.

TSLA stock is worth taking a closer look at, regardless of your trading style.

*** I DO NOT OWN SHARES OF TSLA STOCK ***

All numbers here taken from Yahoo Finance****

Genco Shipping & Trading Ltd. GNK stock

Genco Shipping & Trading Ltd. stock trades under the ticker GNK & has shown recent bullishness that traders & investors should take a closer look at.

GNK stock closed at $17.01/share on 2/7/2022.

Genco Shipping & Trading Ltd. GNK Stock’s Technicals Broken Down

Genco Shipping & Trading Ltd. GNK Stock's Technical Performance Over The Last Year

GNK Stock Price: $17.01

10 Day Moving Average: $15.73

50 Day Moving Average: $15.49

200 Day Moving Average: $16.87

RSI: 61.3

MACD: 0.205

Yesterday, GNK stock broke out above its 200 Day Moving Average, just days after its 10 day broke out bullishly above its 50 day MA.

Their RSI is still relatively neutral, although climbing closer to overbought & their trading volume for 2022 so far has been above average compared with the year prior.

I will be keeping an eye at where they are compared to the $17-level, with the $17.99/share level being the next major test of resistance.

Genco Shipping & Trading Ltd. GNK Stock As A Long-Term Investment

Investors will like GNK stock’s valuation metrics, with 27.53 for their P/E (ttm) & 0.79 for their P/B (mrq).

GNK stock’s Quarterly Revenue Growth Y-o-Y was 77.4%.

Genco Shipping & Trading Ltd.’s balance sheet will require closer examination though, with $80.17M in Total Cash (mrq) & Total Debt (mrq) of $305.28M.

GNK stock offers a 1.96% dividend yield, that appears very safe as their payout ratio is 33.3%.

73.8% of GNK stock’s outstanding share float is held by institutional investors.

Genco Shipping & Trading Ltd. GNK Stock As A Short-Term Trade Using Options

Traders can use options to take advantage of GNK stock’s momentum, while fending off broader market volatility.

I am looking at the contracts with the 2/18 expiration date.

The $15 & $17.50 call options look appealing, and have sufficient open interest.

The $20 & $22.50 put options also look appealing, although less liquid, implying that markets see more strength than weakness for GNK stock in the near-term.

Tying It All Together

Overall, GNK stock has many appealing characteristics that traders & investors will like.

Investors will like their valuation metrics, as well as their dividend yield, but may want to take a closer look at their balance sheet structure.

Traders will like their current momentum, as well as the liquidity around their options.

GNK stock is worth taking a closer look at, regardless of your trading style.

*** I DO NOT OWN SHARES OF GNK STOCK ***

NetApp Inc. NTAP Stock Analysis

NetApp Inc. stock trades under the ticker NTAP & has shown recent bullishness that traders & investors should take note of.

NTAP stock closed at $87.33/share on 2/7/2022, with additional bullish momentum to run.

NetApp Inc. NTAP Stock’s Technicals Broken Down

NetApp Inc. NTAP Stock's Technical Performance Over The Last Year

NTAP Stock Price: $87.33

10 Day Moving Average: $86.57

50 Day Moving Average: $89.56

200 Day Moving Average: $84.89

RSI: 45.51

MACD: -0.977

Yesterday, NTAP completed a bullish MACD crossover, despite dropping 0.34%.

Their RSI is just below neutral, which should provide them additional strength in the near-term given that they have traded at above average volumes since the beginning of 2022.

NTAP stock’s next tests of resistance will be at $88.46, $88.45 & $89.68.

NetApp Inc. NTAP Stock As A Long-Term Investment

Investors will find NTAP stock’s P/E (ttm) appealing, at 21.30.

Their P/B (mrq) is a bit rich at 25.76.

NetApp Inc.’s Quarterly Revenue Growth Y-o-Y is 10.6%, with 63.5% Quarterly Earnings growth Y-o-Y.

NTAP stock’s balance sheet looks appealing, with Total Cash (mrq) of $4.56B & Total Debt (mrq) of $2.91B.

They offer a 2.24% dividend yield, with a safe 47% payout ratio.

95.56% of NTAP stock’s outstanding share float is held by institutional investors.

NetApp Inc. NTAP Stock As A Short-Term Trade Using Options

NTAP stock has options that traders can trade to hedge against broader market volatility in the near-term.

I am looking at the contracts with the 2/18 expiration date.

The $86 & $87 call options look interesting, although very illiquid.

The $89 & $90 put options also look appealing, although also low in open interest.

NTAP stock has weekly expiration dates though, so open interest may increase as the expiration date draws nearer & other contracts expire.

Tying It All Together

All-in-all, NTAP stock is appealing for both long & short term focused market participants.

Long-term investors will like their balance sheet & dividend yield.

Short-term oriented traders will like their momentum, but will want to see more open interest & liquidity in their medium-term expiration dated contracts.

NTAP stock is worth taking a closer look at, regardless of your trading style.

*** I DO NOT OWN SHARES OF NTAP STOCK ***

Northern Trust Corp. NTRS Stock

Northern Trust Corp. stock trades under the ticker NTRS & has shown recent bullishness that traders & investors should take a closer look into.

NTRS stock closed at $122.64/share on 2/7/2022.

Northern Trust Corp. NTRS Stock’s Technicals Broken Down

Northern Trust Corp. NTRS Stock's Technical Performance Over The Last Year

NTRS Stock Price: $122.64

10 Day Moving Average: $118.08

50 Day Moving Average: $120.50

200 Day Moving Average: $116.57

RSI: 53.9

MACD: -0.724

Yesterday, NTRS stock completed a bullish MACD crossover, on higher than average volume for the year.

With ~2% between the 10 & 50 Day Moving Averages, there looks to be additional momentum coming to help them break through the next levels of resistance, particularly as their RSI is neutral.

Their next tests of resistance will be at $125.73 & $130.97.

Northern Trust Corp. NTRS Stock As A Long-Term Investment

Long-term investors will like NTRS stock’s valuation metrics, with a P/E (ttm) of 16.75 & a P/B (mrq) 2.23.

They also had 10.1% Quarterly Revenue Growth Y-o-Y & 68.7% Quarterly Earnings Growth Y-o-Y.

NTRS stock’s balance sheet does require a closer look though, with Total Cash (mrq) of $1.93B & Total Debt (mrq) of $7.77B.

Their 2.3% dividend yield also appears safe, as their payout ratio is 39.22%.

82.81% of NTRS stock’s outstanding share float is held by institutional investors.

Northern Trust Corp. NTRS Stock As A Short-Term Trade Using Options

NTRS stock has options that can be traded in order to take advantage of their price movements in either direction.

I am looking at the contracts with the 2/18 expiration date.

The $120 & $125 calls look appealing, although they have low open interest.

The $130 & $125 puts also look interesting from a hedging perspective.

Tying It All Together

Overall, Northern Trust Corp. stock has many characteristics that traders of all styles will appreciate.

Long-term oriented investors will like their valuation metrics, as well as their dividend yield.

Short-term focused traders will like their current momentum pace, despite their options having mediocre open interest levels.

NTRS stock is worth taking a closer look at, regardless of your trading style.

*** I DO NOT OWN SHARES OF NTRS STOCK ***

Philip Morris Intl. Inc. PM Stock

Philip Morris Intl. Inc. stock trades under the ticker PM & has shown recent bullishness that traders & investors should take a closer look into.

PM stock closed at $103.59/share on 2/4/2022

Philip Morris Intl. Inc. PM Stock’s Technicals Broken Down

Philip Morris Intl. Inc. PM Stock's Technical Performance Over The Last Year

PM Stock Price: $103.59

10 Day Moving Average: $102.73

50 Day Moving Average: $95.59

200 Day Moving Average: $95.63

RSI: 65.5

PM stock has been trading on above average volume this last month, compared with the rest of the year prior.

Their 50 Day MA is primed to bullishly break through their 200 Day MA today, and their RSI is approaching overbought territory at 65.5.

The $103.75-.80-level is going to be a big test for them, as that was their year’s prior high level.

While their MACD is currently bearish, I would be keeping an eye on it as they continue to try to break out above the $104-level for a shift in momentum.

Philip Morris Intl. Inc. PM Stock As A Long-Term Investment

Long-term investors in PM stock may find their P/E (ttm) appealing, at 18.09.

Their P/B (mrq) is negative, which may be a problem to some investors.

PM stock’s Quarterly Revenue Growth Y-o-Y is 9.10%, with Quarterly Earnings Growth Y-o-Y of 5.2%.

Their balance sheet will require a closer examination, with $4.49B in Total Cash (mrq) & Total Debt (mrq) of $29.11B.

Their prices move in a less volatile manner than the average market, with a beta of 0.83.

PM stock pays a 4.67% dividend yield, however this may not be stable in the long run, as their payout ratio is 84.5%.

Despite this, they have 76% of their total share float held by institutional investors.

Philip Morris Intl. Inc. PM Stock As A Short-Term Trade Using Options

PM stock has options that can be traded to take advantage of their price movements in either direction, while also hedging against volatility.

I am looking at the contracts with the 2/28 expiration date.

The $102 & $103 call options look appealing, but are low in open interest.

This stands out as the $105’s have more liquidity than the $102, $103 & $104 calls, signaling that the market feels strongly about their performance heading in that direction as we carry on into February.

The $104 & $105 puts also look interesting, as the $106’s have no open interest.

Tying It All Together

All-in-all, there look to be many appealing characteristics to PM stock.

Investors will find its valuation & dividend appealing, but may have questions about their debt structuring.

Traders will like their current momentum, as they try to break above the $104/share level.

Overall, PM stock is worth taking a closer look at.

*** I DO NOT HAVE A POSITION IN PM AT THE TIME OF WRITING THIS, BUT I AM RESEARCHING THEM FURTHER ***

WW Grainger, Inc. GWW Stock Analysis

WW Grainger, Inc. stock trades under the ticker GWW & has shown recent bullishness that investors & traders should take a closer look at.

GWW stock closed at $507.58/share on 2/3/2022.

WW Grainger, Inc. GWW Stock’s Technical Performance Broken Down

WW Grainger, Inc. GWW Stock's Technical Performance Over The Last Year

GWW Stock Price: $507.58

10 Day Moving Average: $492.97

50 Day Moving Average: $501.47

200 Day Moving Average: $456.13

RSI: 56.98

MACD: -1.33

Yesterday, GWW stock completed a bullish MACD crossover, while gapping up 1.29% & breaking out above its 50 Day Moving Average.

Yesterday’s trading volume was one of the highest days of the past year & well above average for the year.

With <2% between the 10 Day MA crossing the 50 Day MA & a neutral RSI, there looks to be more momentum in the near-term to come.

GWW stock will need to break out above the $516-level before going on to test against yesterday’s high price of $525.

WW Grainger, Inc. GWW Stock As A Long-Term Investment

GWW stock’s P/E (ttm) may appeal to investors at 28.97, although their P/B (mrq) is a bit rich at 14.31.

Their Quarterly Revenue Growth Y-o-Y was 11.7% & their Quarterly Earnings Growth Y-o-Y was 23.7%.

GWW stock’s balance sheet will require a closer review before investors dive in, with Total Cash (mrq) of $328M & Total Debt (mrq) of $2.37B.

GWW offers a 1.26% dividend yield, which looks stable as their payout ratio is 35.96%.

71.6% of GWW stock’s outstanding share float is held by institutional investors.

WW Grainger, Inc. GWW Stock As A Short-Term Trade Using Options

GWW stock has options that traders can use to capture near-term momentum while fending off broader market risk.

I am looking at the contracts with the 2/18 expiration date.

The $490 & $500 call options look appealing, although illiquid with very low open interest.

The $510 & $500 put options also look interesting, but are also highly illiquid.

Tying It All Together

All-in-all, there are many interesting characteristics to GWW stock that traders & investors may find appealing.

Long-term investors will like their valuation metrics & dividend yield, but will want to look into their debt structure before investing.

Short-term traders will like their current momentum, but be a bit disappointed by their illiquid options market.

GWW stock is worth taking a closer look at as an addition to your portfolio.

*** I DO NOT OWN SHARES OF GWW STOCK ***

Hawkins Chemical, Inc. HWKN Stock

Hawkins Chemical, Inc. stock trades under the ticker HWKN & has shown recent bullishness that traders & investors should take a closer look at.

HWKN stock closed at $40.98/share on 2/3/2022.

Hawkins Chemical, Inc. HWKN Stock’s Technicals Broken Down

Hawkins Chemical, Inc. HWKN Stock's Technical Performance Over The Last Year

HWKN Stock Price: $40.98

10 Day Moving Average: $37.69

50 Day Moving Average: $37.61

200 Day Moving Average: $35.28

RSI: 64.8

MACD: -0.023

Yesterday, HWKN stock completed a bullish MACD crossover, while gapping up 10.55%.

In addition to breaking out above their 10 & 50 Day Moving Averages, their 10 Day also bullishly crossed the 50 Day MA, adding additional momentum to their price movement.

Shares traded on above average volume compared to the rest of the year prior, and their RSI still has room to run before going into overbought territory.

HWKN stock closed above their most recent high from the last year as well.

Hawkins Chemical, Inc. HWKN Stock As A Long-Term Investment

Investors will like HWKN stock’s valuation metrics, with a P/E (ttm) of 16.5 & a P/B (mrq) of 2.76.

HWKN saw Quarterly Revenue Growth Y-o-Y of 30.9%, with 28.8% Quarterly Earnings Growth Y-o-Y.

Their balance sheet will require a closer look from prospective investors, with Total Cash (mrq) of $23.44M & Total Debt (mrq) of $126.89M.

HWKN stock pays a dividend of 1.36%, which appears to be stable with a 21.83% Payout Ratio.

As a result, 63% of HWKN stock’s outstanding share float is held by institutional investors.

Hawkins Chemical, Inc. HWKN Stock As A Short-Term Trade Using Options

Traders can use options to take advantage of HWKN stock’s current momentum, while hedging against broader market volatility.

I am looking at the contracts with the 2/18 expiration date.

The $40 calls are the only ones with open interest that are near the money, but are very illiquid with open interest of 2.

The only puts that are near the money are the $35 strike price contracts, which will require a big drop to be in-the-money.

Tying It All Together

Overall, HWKN stock has many interesting characteristics for investors & traders alike.

Investors will like their valuation & dividend yield, but should look into their debt structure before making a long-term commitment.

Traders will like their current momentum, but will be displeased by the lack of liquidity in their near-dated options.

HWKN stock is worth taking a closer look at to see if it is a good fit for your portfolio.

*** I DO NOT OWN SHARES OF HWKN STOCK ***

Ares Management LP ARES Stock Analysis

Ares Management, LP stock trades under the ticker ARES & has recently shown bullishness that traders & investors should take a closer look at.

After a 7.5% gain, ARES stock closed at $79.72/share 0n 1/31/2022.

Ares Management, LP ARES Stock’s Technicals Broken Down

Ares Management, LP ARES Stock's Technical Performance Over The Last Year

ARES Stock Price: $79.72

10 Day Moving Average: $74.08

50 Day Moving Average: $78.50

200 Day Moving Average: $70.51

RSI: 59.6

MACD: -1.113

Yesterday, ARES stock completed a bullish MACD crossover, while also breaking out above its 10 & 50 Day Moving Averages.

In 2022, ARES stock has traded just above their average daily volume for the previous year.

Their next resistance tests will be $79.87, followed by $84.10, with support at the $72.83, $72.68 & $69.21 price levels, should the markets continue sliding into 2022.

Ares Management, LP ARES Stock As A Long-Term Investment

ARES stock may be appealing to long-term focused investors.

Their P/E (ttm) is fair at 36.27, however their P/B (mrq) is a bit rich at 7.01, which may be justified due to the nature of their business.

ARES had 93.7% Quarterly Revenue Growth Y-o-Y, along with Quarterly Earnings Growth Y-o-Y of 78.2%.

Their Balance Sheet requires a closer examination, with Total Cash (mrq) of $1.88B & Total Debt (mrq) of $11.73B.

ARES stock offers a 2.44% Dividend Yield, however it is unsure how sustainable this yield will be, with their payout ratio being well above 50%.

71.5% of ARES stock’s share float is held by institutional investors.

Ares Management, LP ARES Stock As A Short-Term Trade Using Options

Traders can use options to take advantage of price movements in either direction for ARES stock.

I am looking at the contracts with the 2/18 expiration date.

The $75 & $80 calls look appealing, minus the lack of liquidity, as both have open interest well below 1,000.

There is very limited open interest in ARES puts with the 2/18 expiration date, with only the $75 & $85 having any open interest.

Tying It All Together

Overall, ARES stock looks to have many interesting characteristics that traders & investors may find appealing.

Investors will like their valuation metrics, and their dividend yield should it not have to be cut in the future.

Traders will like their current momentum, but will remain weary of the overall liquidity of their options, as there is very limited open interest.

All-in-all, ARES stock is worth taking a closer look at, regardless of your trading style.

*** I DO NOT OWN SHARES OF ARES STOCK ***