Walmart, Inc. WMT Stock Analysis

Walmart, Inc. stock trades under the ticker WMT & has shown recent bullishness that traders & investors should research further into.

WMT stock closed at $139.40/share on 3/17/2023.

Walmart, Inc. WMT Stock’s Technical Performance Broken Down

Walmart, Inc. WMT Stock's Technical Performance Over The Past Year
Walmart, Inc. WMT Stock’s Technical Performance Over The Past Year

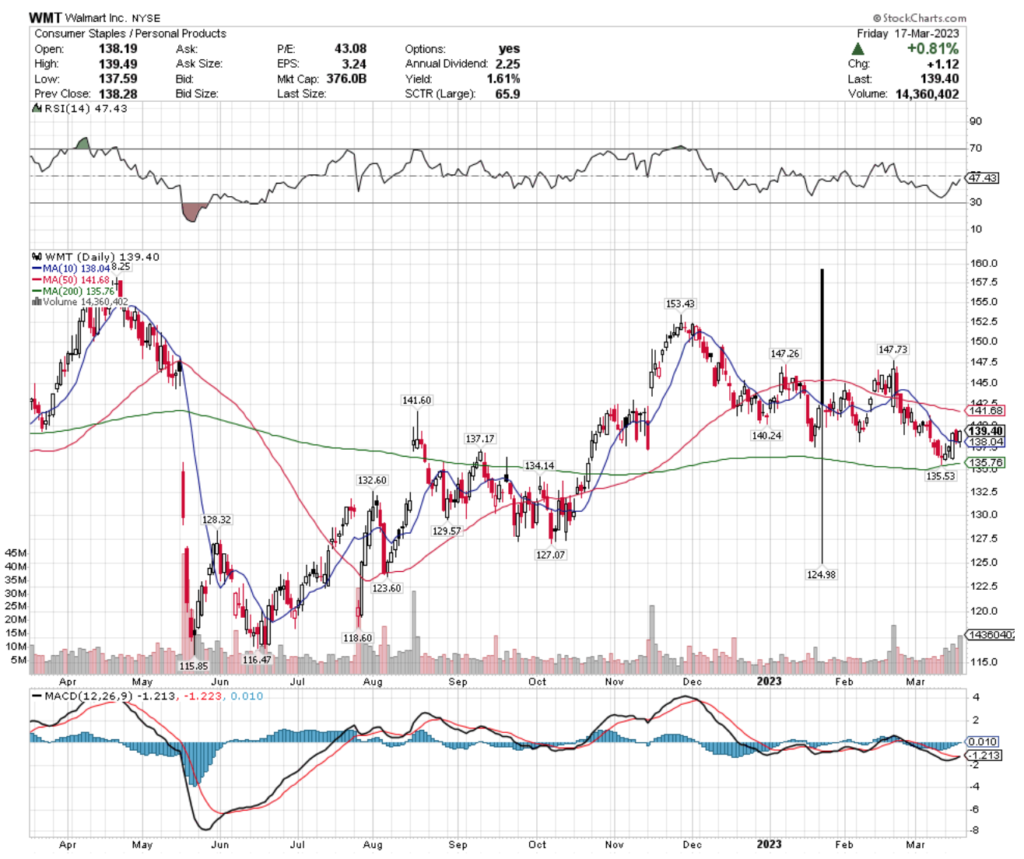
WMT Stock Price: $139.40

10 Day Moving Average: $138.04

50 Day Moving Average: $141.68

200 Day Moving Average: $135.76

RSI: 47.43

MACD: -1.213

On Friday, WMT stock completed a bullish MACD crossover, gaining +0.81% on the day’s session.

Recent trading volumes have been above average compared to the year prior & their RSI is neutral after their price has spent the last couple of months in a consolidation range.

WMT stock has support at the $138.04 (10 day moving average), $137.17 & $135.76 (200 day moving average), as they look to break out & above their $140.24, $141.60 & $141.68 (50 day moving average) resistance levels.

Walmart, Inc. WMT Stock As A Long-Term Investment

Long-term oriented investors will like WMT stock’s 32.7 P/E (ttm), but may find their 4.91 P/B (mrq) to be a bit too rich.

They recently reported 7.3% Quarterly Revenue Growth Y-o-Y, with 76.2% Quarterly Earnings Growth Y-o-Y.

Their balance sheet will require a more thorough review, with $8.89B of Total Cash (mrq) & $58.92B of Total Debt (mrq).

WMT stock pays a 1.62% dividend, which appears to be sustainable in the long-run, as their payout ratio is 52.46%.

33% of WMT stock’s outstanding share float is owned by institutional investors.

Walmart, Inc. WMT Stock As A Short-Term Trade Using Options

Traders with a short-term time horizon can trade options to profit from WMT stock’s price movements, while protecting their portfolios from volatility.

I am looking at the contracts with the 4/14 expiration date.

The $138, $139 & $137 call options are all in-the-money, listed from most to least level of open interest.

The $140, $142 & $141 puts are also all in-the-money, with the former strike being more liquid than the latter two.

Tying It All Together

WMT stock has many interesting charactertistics that traders & investors will find appealing.

Investors will like their dividend yield, as well as their P/E (ttm), but may want to review their balance sheet more thoroughly.

Traders will like their recent technical performance & how liquid their options are.

All-in-all, it is worth taking a closer look to see how WMT stock fits into your portfolio strategy.

*** I DO NOT OWN SHARES OR OPTIONS CONTRACT POSITIONS IN WMT STOCK AT THE TIME OF PUBLISHING THIS ARTICLE ***

KB Home KBH Stock Analysis

KB Home stock trades under the ticker KBH & has shown recent bullishness that traders & investors should research further into.

KBH stock closed at $35.28/share on 3/17/2023.

KB Home KBH Stock’s Technical Performance Broken Down

KB Home KBH Stock's Technical Performance Over The Past Year
KB Home KBH Stock’s Technical Performance Over The Past Year

KBH Stock Price: $35.38

10 Day Moving Average: $35.20

50 Day Moving Average: $36.10

200 Day Moving Average: $31.29

RSI: 47.81

MACD: -0.244

On Friday, KBH stock completed a bullish MACD crossover, despite losing-0.7% on the day’s session.

Their RSI is neutral & recent trading volumes have been about average, as they have spent the last month in a consolidation range.

KBH has support at the $35.20 (10 day moving average), $34.82 & $34.43/share price levels, as they look to break out & above their $35.34, $36.04 & $36.10 (50 day moving average) resistance levels.

KB Home KBH Stock As A Long-Term Investment

Investors with long-term time horizons will like KBH stock’s valuation metrics, with a 3.86 P/E (ttm) & a 0.81 P/B (mrq).

They recently reported 15.8% Quarterly Revenue Growth Y-o-Y, with 24.2% Quarterly Earnings Growth Y-o-Y.

Their balance sheet will require a more thorough examination, with $328.5M of Total Cash (mrq) & $1.87B of Total Debt (mrq).

KBH stock pays a 1.69% dividend, which appears to be sustainable in the long run, as their payout ratio is 6.6%.

95.3% of KBH stock’s outstanding share float is owned by institutional investors.

KB Home KBH Stock As A Short-Term Trade Using Options

Short-term oriented traders can use options to profit from KBH stock’s price movements, while protecting their portfolio from volatility.

I am looking at the contracts with the 4/21 expiration date.

The $35, $33 & $34 call options are all in-the-money, listed from highest to lowest level of open interest.

The $36, $37 & $38 puts are also all in-the-money, with the former being more liquid than the latter strikes.

Tying It All Together

KBH stock has many interesting attributes that traders & investors are sure to like.

Investors will like their valuation metrics & dividend yield, but may want to take a closer look into the makeup of their balance sheet.

Traders will like their recent technical performance, as well as their liquid options.

Overall, it is worth taking a closer look into KBH stock to see how it fits into your portfolio strategy.

*** I DO NOT OWN SHARES OR OPTIONS CONTRACT POSITIONS IN KBH STOCK AT THE TIME OF PUBLISHING THIS ARTICLE ***

Atmos Energy Corp. ATO Stock Analysis

Atmos Energy Corp. stock trades under the ticker ATO & has shown recent bullishness that traders & investors should research further into.

ATO stock closed at $114.34/share on 3/16/2023.

Atmos Energy Corp. ATO Stock’s Technical Performance Broken Down

Atmos Energy Corp. ATO Stock's Technical Performance Over The Past Year
Atmos Energy Corp. ATO Stock’s Technical Performance Over The Past Year

ATO Stock Price: $114.34

10 Day Moving Average: $112.01

50 Day Moving Average: $113.99

200 Day Moving Average: $111.41

RSI: 53.26

MACD: -0.667

Yesterday, ATO stock completed a bullish MACD crossover, gaining +0.49% on the day’s session.

Recent trading volumes have been about average compared to the year prior & their RSI is neutral, as prices fight to break back above where they were in mid-February.

ATO stock has support at the $113.99 (50 day moving average), $113.30 & $112.01/share price levels, as they try to break out & above their $114.66, $115.51 & $116.96/share resistance levels.

Atmos Energy Corp. ATO Stock As A Long-Term Investment

Long-term oriented investors will like ATO stock’s 19.56 P/E (ttm) & their 1.61 P/B (mrq).

They recently reported 46.5% Quarterly Earnings Growth Y-o-Y, with 9.1% Quarterly Revenue Growth Y-o-Y.

Their balance sheet will require a deeper review before investing, with $279.43M of Total Cash (mrq) & $8.75B of Total Debt (mrq).

ATO stock pays a 2.44% dividend, which appears to be sustainable in the long-run, as their payout ratio is 49.2%.

93.91% of ATO stock’s outstanding share float is owned by institutional investors.

Atmos Energy Corp. ATO Stock As A Short-Term Trade Using Options

Traders with shorter time horizons can trade options to profit from ATO stock price movements, while protecting their portfolios from market volatility.

I am looking at the contracts with the 4/21 expiration date.

The $110, $100, $105 & $90 call options are all in-the-money, listed from highest to lowest level of open interest.

The $29 puts are also in-the-money.

Tying It All Together

ATO stock has many interesting attributes that traders & investors will find interesting.

Investors will like their valuation metrics, as well as their sustainable dividend yield.

Traders will like their recent technical performance, but may be disappointed by how liquid their options are.

All-in-all, it is worth taking a closer look into ATO stock to see how it fits into your portfolio strategy.

*** I DO NOT OWN SHARES OR OPTIONS CONTRACT POSITIONS IN ATO STOCK AT THE TIME OF PUBLISHING THIS ARTICLE ***

HCA Healthcare, Inc. HCA Stock Analysis

HCA Healthcare, Inc. stock trades under the ticker HCA & has shown recent bullishness that traders & investors should research further into.

HCA stock closed at $254.38/share on 3/16/2023.

HCA Healthcare, Inc. HCA Stock’s Technical Performance Broken Down

HCA Healthcare, Inc. HCA Stock's Technical Performance Over The Past Year
HCA Healthcare, Inc. HCA Stock’s Technical Performance Over The Past Year

HCA Stock Price: $254.38

10 Day Moving Average: $249.14

50 Day Moving Average: $253.18

200 Day Moving Average: $218.65

RSI: 54.68

MACD: -0.915

Yesterday, HCA stock completed a bullish MACD crossover, gaining +3.04% on the day’s session.

Recent trading volumes have been about average compared to the year prior & their RSI is neutral, after they’ve spent much of March in a consolidation range.

HCA stock has support at the $253.18 (50 day moving average), $250.60 & $249.14/share price levels, as they look to try to break out & above their $256.67, $263.46 & $263.98/share price level.

HCA Healthcare, Inc. HCA Stock As A Long-Term Investment

Long-term oriented investors will like HCA stock’s 13.15 P/E (ttm).

They recently reported 2.9% Quarterly Revenue Growth Y-o-Y, with 14.7% Quarterly Earnings Growth Y-o-Y.

Their balance sheet will require a more thorough examination before investing, with $1B of Total Cash (mrq) & $40.2B of Total Debt (mrq).

HCA stock pays a modest 0.9% dividend, which appears to be sustainable in the long-run, as their payout ratio is 11.7%.

66.1% of HCA stock’s outstanding share float is owned by institutional investors.

HCA Healthcare, Inc. HCA Stock As A Short-Term Trade Using Options

Investors with shorter time horizons can trade options to profit from HCA stock’s price movements, while protecting their portfolio from volatility.

I am looking at the contracts with the 4/21 expiration date.

The $250, $240 & $245 call options are all in-the-money, listed from highest to lowest level of open interest.

The $260, $255 & $265 puts are also all in-the-money, with the former strike being more liquid than the latter two.

Tying It All Together

HCA stock has many interesting attributes that traders & investors are sure to find appealing.

Investors will like their P/E (ttm) & modest, but sustainable dividend yield.

Traders will like their recent technical performance & liquid options.

Overall, it is worth taking a closer look into HCA stock to see how it fits into your portfolio strategy.

*** I DO NOT OWN SHARES OR OPTIONS CONTRACT POSITIONS IN HCA STOCK AT THE TIME OF PUBLISHING THIS ARTICLE ***

McCormick & Co., Inc. MKC Stock Analysis

McCormick & Co., Inc. stock trades under the ticker MKC & has shown recent bullish behavior that traders & investors should research further into.

MKC stock closed at $72.92/share on 3/15/2023.

McCormick & Co., Inc. MKC Stock’s Technical Performance Broken Down

McCormick & Co., Inc. MKC Stock's Technical Performance Over The Past Year
McCormick & Co., Inc. MKC Stock’s Technical Performance Over The Past Year

MKC Stock Price: $72.92

10 Day Moving Average: $72.39

50 Day Moving Average: $76.38

200 Day Moving Average: $80.81

RSI: 44.16

MACD: -1.183

Yesterday, MKC stock completed a bullish MACD crossover, gaining +1.5% on the day’s session.

Their RSI is neutral, and recent trading volumes have been above average compared to the year prior, as their price has been consolidating over the past few weeks.

MKC stock has support at the $72.39 (10 day moving average), $72.25 & $71.73/share price levels, as they try to break out & above their $76.38 (50 day moving average), $76.88 & $76.91/share resistance levels.

McCormick & Co., Inc. MKC Stock As A Long-Term Investment

Long-term oriented investors will like MKC stock’s 28.62 P/E (ttm), but may find their 4.13 P/B (mrq) to be a bit too rich.

Investors may wish to look deeper into their recent growth metrics, with a reported -2% Quarterly Revenue Growth Y-o-Y & -5.9% Quarterly Earnings Growth Y-o-Y.

Their balance sheet will also require a more thorough examination, with $334M of Total Cash (mrq) & $5.38B of Total Debt (mrq).

MKC stock pays a 2.06% dividend, which may or may not be sustainable in the long-run, as their payout ratio is 58.73%.

88.09% of MKC stock’s outstanding share float is owned by institutional investors.

McCormick & Co., Inc. MKC Stock As A Short-Term Trade Using Options

Traders with shorter time horizons can trade options to profit from price movements in MKC stock, while protecting their portfolios from volatility.

I am looking at the contracts with the 4/21 expiration date.

The $70 call options are in-the-money.

The $75, $80 & $85 puts are also all in-the-money, listed from highest to lowest levels of open interest.

Tying It All Together

MKC stock has many unique attributes that traders & investors swill find appealing.

Investors will like their P/E (ttm) & dividend yield, but may want to look deeper into recent growth & their balance sheet for clues about dividend sustainability.

Traders will like their recent technical performance.

Overall, it is worth taking a closer look into MKC stock to see how it fits into your portfolio strategy.

*** I DO NOT OWN SHARES OR OPTIONS CONTRACTS POSITIONS IN MKC STOCK AT THE TIME OF PUBLISHING THIS ARTICLE ***

Gilead Sciences, Inc. GILD Stock Analysis

Gilead Sciences, Inc. stock trades under the ticker GILD & has shown recent bullish behavior that traders & investors should research further into.

GILD stock closed at $79.65/share on 3/15/2023.

Gilead Sciences, Inc. GILD Stock’s Technical Performance Broken Down

Gilead Sciences, Inc. GILD Stock's Technical Performance Over The Past Year
Gilead Sciences, Inc. GILD Stock’s Technical Performance Over The Past Year

GILD: $79.65

10 Day Moving Average: $79.36

50 Day Moving Average: $82.77

200 Day Moving Average: $71.74

RSI: 42.82

MACD: -1.152

Yesterday, GILD completed a bullish MACD crossover, losing -0.15% on the day’s session.

Recent trading volumes have been below average & their RSI is moving towards the oversold end of neutral, with recent candlesticks signaling that there is more near-term losses on the horizon.

This will create more opportune price levels for traders & investors to enter a position or add to an existing position.

GILD stock has support at the $79.36 (10 day moving average), $78.66 & $77.55/share price levels, as they try to break out above the $79.72, $80.50 & $81.04/share resistance levels.

Gilead Sciences, Inc. GILD Stock As A Long-Term Investment

Investors with longer time horizons will like GILD stock’s 22.28 P/E (ttm), but may find their 4.76 P/B (mrq) to be a bit higher than they’d prefer.

They recently reported 2% Quarterly Revenue Growth Y-o-Y, with 329.3% Quarterly Earnings Growth Y-o-Y.

Their balance sheet will require a more thorough examination, with $7.14B of Total Cash (mrq) & $25.1B of Total Debt (mrq).

GILD stock pays a 3.66% dividend, which may not be sustainable in the long-run, as their payout ratio is 80.22%.

86.44% of GILD stock’s outstanding share float is owned by institutional investors.

Gilead Sciences, Inc. GILD Stock As A Short-Term Trade Using Options

Traders with shorter time frames can trade options to profit from GILD stock’s price movements, while protecting their portfolios from volatility.

I am looking at the contracts with the 4/21 expiration date.

The $77.50, $75 & $70 call options are all in-the-money, listed from highest to lowest level of open interest.

The $82.50, $80 & $85 puts are also all in-the-money, with the former strike being more liquid than the latter.

Tying It All Together

GILD stock has many interesting attributes that traders & investors will find appealing.

Investors will like their P/E (ttm) & dividend yield, but should look into their balance sheet for clues about how sustainable their yield is in the long-run.

Traders will like their recent technical performance, as well as their liquid options.

All-in-all, it is worth taking a closer look into GILD stock to see how it fits into your portfolio strategy.

*** I DO NOT OWN SHARES OR OPTIONS CONTRACT POSITIONS IN GILD STOCK AT THE TIME OF PUBLISHING THIS ARTICLE ***

Darden Restaurants, Inc. DRI Stock Analysis

Darden Restaurants, Inc. stock trades under the ticker DRI & has shown recent bullish behavior that traders & investors should research deeper into.

DRI stock closed at $147.58/share on 3/14/2023.

Darden Restaurants, Inc. DRI Stock’s Technical Performance Broken Down

Darden Restaurants, Inc. DRI Stock's Technical Performance Over The Past Year
Darden Restaurants, Inc. DRI Stock’s Technical Performance Over The Past Year

DRI Stock Price: $147.58

10 Day Moving Average: $146.09

50 Day Moving Average: $146.60

200 Day Moving Average: $132.77

RSI: 54.2

MACD: -0.134

Yesterday, DRI stock completed a bullish MACD crossover, gaining 1.07% on the day’s session.

Their RSI is neutral & recent trading volumes have been above average, as they’ve stayed in a consolidation range for the better part of 2023.

Recent candlesticks signal that there will be near-term weakness, which will provide patient investors & traders with a better entry point.

DRI stock has support at the $146.93, $146.60 (50 day moving average) & $146.09 (10 day moving average)/share price levels, while they try to break out above their $148.57 & $152.08/share resistance levels.

Darden Restaurants, Inc. DRI Stock As A Long-Term Investment

Long-term oriented investors will like DRI stock’s 20.21 P/E (ttm), but will find their 8.82 P/B (mrq) to be a bit higher than they’d like to see.

They recently reported 9.4% Quarterly Revenue Growth Y-o-Y, with -3.1% Quarterly Earnings Growth Y-o-Y.

Their balance sheet will require a more thorough examination, with $240.7M of Total Cash (mrq) & $6.01B of Total Debt (mrq).

DRI stock pays a 3.16% dividend, which may not be sustainable in the long-run, as their payout ratio is 63.72%.

91.65% of DRI stock’s outstanding share float is owned by institutional investors.

Darden Restaurants, Inc. DRI Stock As A Short-Term Trade Using Options

Traders with shorter time horizons can trade options to profit from price movements in DRI stock, while protecting their portfolios from volatility.

I am looking at the contracts with the 4/21 expiration date.

The $145, $140 & $125 call options are all in-the-money, listed from most to least liquid strike price.

The $150, $155 & $160 puts are also all in-the-money, with the former having more open interest than the latter two strikes.

Tying It All Together

DRI stock has many interesting attributes that traders & investors are sure to find appealing.

Investors will like their P/E (ttm) & dividend yield, but may want to review their balance sheet for insights into how sustainable their yield will be in the medium to long-term.

Traders will like their recent technical performance, as well as how liquid their options are.

Overall, it is worth taking a closer look into how DRI stock fits into your portfolio strategy.

*** I DO NOT OWN SHARES OR OPTIONS CONTRACT POSITIONS IN DRI STOCK AT THE TIME OF PUBLISHING THIS ARTICLE ***

Tootsie Roll Industries TR Stock Analysis

Tootsie Roll Industries stock trades under the ticker TR & has shown recent bullishness that traders & investors should research further into.

TR stock closed at $44.35/share on 3/14/2023.

Tootsie Roll Industries TR Stock’s Technical Performance Broken Down

Tootsie Roll Industries TR Stock 's Technical Performance Over The Past Year
Tootsie Roll Industries TR Stock ‘s Technical Performance Over The Past Year

TR Stock Price: $44.35

10 Day Moving Average: $42.59

50 Day Moving Average: $43.19

200 Day Moving Average: $37.76

RSI: 60.15

MACD: -0.096

Yesterday, TR stock completed a bullish MACD crossover, gaining 3.48% on the day’s session.

Their RSI is on the overbought side of neutral & recent trading volumes have been about average compared to the year prior.

After spending much of March so far consolidating, they look primed for near-term weakness, which will provide a better entry point for patient investors & traders.

TR stock has support at the $43.19 (50 day moving average), $42.59 (10 day moving average) & $41.56/share price level, as they try to break out & above their $44.86, $44.98 & $45.24/share resistance levels.

Tootsie Roll Industries TR Stock As A Long-Term Investment

Long-term oriented investors will like TR stock’s 39.39 P/E (ttm), but will find their 3.78 P/B (mrq) to be a bit too rich.

They recently reported 13% Quarterly Revenue Growth Y-o-Y, with 26.5% Quarterly Earnings Growth Y-o-Y.

Their balance sheet looks appealing, with $149.4M of Total Cash (mrq) & $13.29M of Total Debt (mrq).

TR stock offers a modest 0.81% dividend, which appears to be sustainable in the long-run, as their payout ratio is 24.55%.

31.56% of TR stock’s outstanding share float is owned by institutional investors.

Tootsie Roll Industries TR Stock As A Short-Term Trade Using Options

Traders with shorter time horizons can trade options to protect their portfolios from volatility, while profiting from price movements in TR stock.

I am looking at the contracts with the 4/21 expiration date.

The $40 calls are in-the-money, as are the $50 puts.

As a smaller cap stock, there should become more liquidity for this expiration date after the 3/17 contracts expire on Friday.

Tying It All Together

TR stock has many interesting attributes that traders & investors should find appealing.

Investors will like their balance sheet, as well as their modest, but sustainable dividend.

Traders will like their recent technical performance, but may be disappointed by how illiquid their options are.

All-in-all, it is worth taking a closer look into TR stock to see how it fits into your portfolio strategy.

*** I DO NOT OWN SHARES OF TR STOCK OR OPTIONS CONTRACT POSITIONS AT THE TIME OF PUBLISHING THIS ARTICLE ***

WEC Energy Group Inc. WEC Stock Analysis

WEC Energy Group stock trades under the ticker WEC & has shown recent bullishness that traders & investors should research further into.

WEC stock closed at $91.16/share on 3/13/2023.

WEC Energy Group Inc. WEC Stock’s Technical Performance Broken Down

WEC Energy Group Inc. WEC Stock's Technical Performance Over The Past Year
WEC Energy Group Inc. WEC Stock’s Technical Performance Over The Past Year

WEC Stock Price: $92.23 (9:40 AM 3/14/2023)

10 Day Moving Average: $89.20

50 Day Moving Average: $91.95

200 Day Moving Average: $94.97

RSI: 55.75

MACD: -0.594

Yesterday, WEC stock completed a bullish MACD crossover.

Their RSI is neutral, with recent trading volumes being slightly elevated compared to the year prior.

Their recent candlesticks are signaling near-term weakness, which may provide traders & investors with a better entry-point in the near future.

WEC stock has support at the $91.95 (50 day moving average), $91.32 & $89.86/share price levels, with resistance at the $92.32, $93.00 & $93.49/share price levels.

WEC Energy Group WEC Inc. Stock As A Long-Term Investment

Long-term oriented investors will like WEC stock’s valuation metrics, with a 20.19 P/E (ttm) & a 2.49 P/B (mrq).

They recently reported 16.2% Quarterly Revenue Growth Y-o-Y, with 12.7% Quarterly Earnings Growth Y-o-Y.

Their balance sheet will require a more thorough examination, with $28.9M of Total Cash (mrq) & $17.32B of Total Debt (mrq).

WEC stock pays a 3.19% dividend, which may not be sustainable in the long-run, as their payout ratio is 65.4%.

77.8% of WEC stock’s outstanding share float is owned by institutional investors.

WEC Energy Group Inc. WEC Stock As A Short-Term Trade Using Options

Traders with shorter time horizons can trade options to profit from price movements in WEC stock, while protecting their portfolios from volatility.

I am looking at the contracts with the 4/21 expiration date.

The $90, $85 & $75 call options are all in-the-money, listed from most to least liquid strike price.

The $95, $105 & $100 puts are also all in-the-money, with the former having more open interest than the latter strikes.

Tying It All Together

WEC stock has many unique characteristics that traders & investors will find appealing.

Investors will like their valuation metrics & recent growth, but may want to review their balance sheet strength, as well as how it will impact their dividend’s sustainability.

Traders will like their recent technical performance & liquid options.

Overall, it is worth taking a closer look into WEC stock to see how it fits into your portfolio strategy.

*** I DO NOT OWN SHARES OR OPTIONS CONTRACT POSITIONS IN WEC STOCK AT THE TIME OF PUBLISHING THIS ARTICLE ***

Lennar Corp. LEN Stock Analysis

Lennar Corp. stock trades under the ticker LEN & has shown recent bullish behavior that traders & investors should research further into.

LEN stock closed at $98.96/share on 3/14/2023.

Lennar Corp. LEN Stock’s Technical Performance Broken Down

Lennar Corp. LEN Stock's Technical Performance Over The Past Year
Lennar Corp. LEN Stock’s Technical Performance Over The Past Year

LEN Stock Price: $98.96

10 Day Moving Average: $97.41

50 Day Moving Average: $98.39

200 Day Moving Average: $84.49

RSI: 52.35

MACD: -0.269

Yesterday, LEN stock completed a bullish MACD crossover, gaining 1.62% on the day’s session.

Their RSI is neutral & their recent trading volumes are about average compared to the year prior.

They’ve spent much of the past month consolidating & are signaling near-term weakness on the horizon, which may present investors & traders with more advantageous entry points.

LEN stock has support at the $97.41 (10 day moving average), $94.88 & $94.13/share price level, as they look to break out above their $100.89, $101.20 & $109.28 resistance levels.

Lennar Corp. LEN Stock As A Long-Term Investment

Long-term oriented investors will like LEN stock’s valuation metrics, with a 6.16 P/E (ttm) & a 1.16 P/B (mrq).

They recently reported 20.6% Quarterly Revenue Growth Y-o-Y, with 11.1% Quarterly Earnings Growth Y-o-Y.

Their balance sheet will require a more thorough examination, with $4.64B of Total Cash (mrq) & $6.36B of Total Debt (mrq)

LEN stock pays a 1.54% dividend, which appears to be sustainable in the long-run, as their payout ratio is 9.54%.

97.5% of LEN stock’s outstanding share float is owned by institutional investors.

Lennar Corp. LEN Stock As A Short-Term Trade Using Options

Traders with shorter time horizons can trade options to profit from price movements in LEN stock, while protecting their portfolios from volatility.

I am looking at the contracts with the 4/21 expiration date.

The $97.50, $95 & $92.50 call options are all in-the-money, listed from highest to lowest level of open interest.

The $100, $105, $110 & $115 puts are also all in-the-money, with the former being more liquid than the latter strikes.

Tying It All Together

LEN stock has many interesting characteristics that traders & investors will find appealing.

Investors will like their valuation metrics & dividend yield, but may want to look into their balance sheet deeper.

Traders will like their recent technical performance & liquid options.

All-in-all, it is worth taking a closer look into LEN stock to see how it fits into your portfolio strategy.

*** I DO NOT OWN SHARES OR OPTIONS CONTRACT POSITIONS IN LEN STOCK AT THE TIME OF PUBLISHING THIS ARTICLE ***