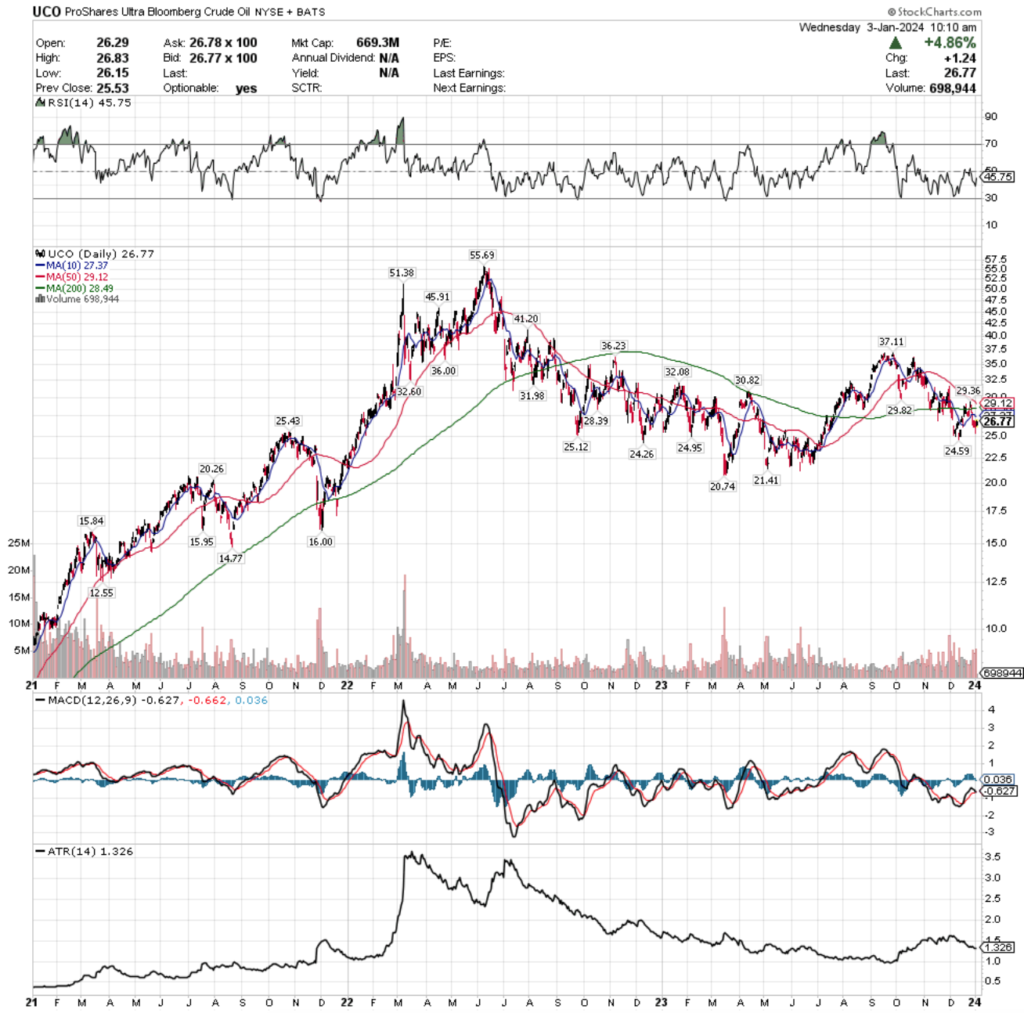
UCO, the ProShares Ultra Bloomberg Crude Oil ETF has declined -9.85% over the past year, falling -31.2% from its 52-week high in September of 2023, while advancing +23.1% from its 52-week low in March of 2023 (using 1/2/2024’s closing price data).
After a volatile week last week, it is worth taking a look at how their shares have traded at different price levels in terms of volume from recent history.
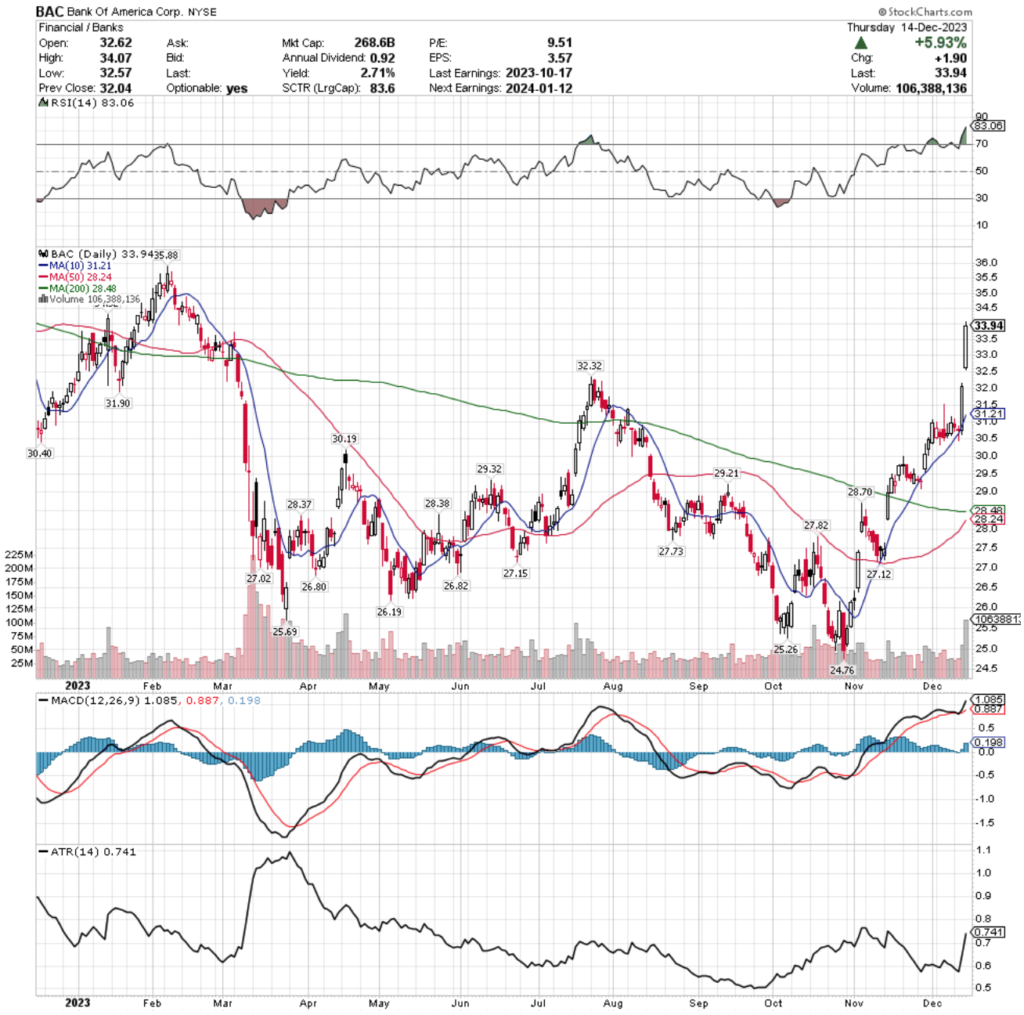
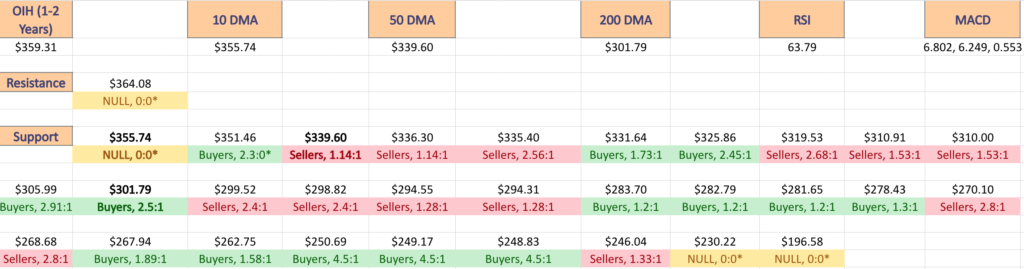
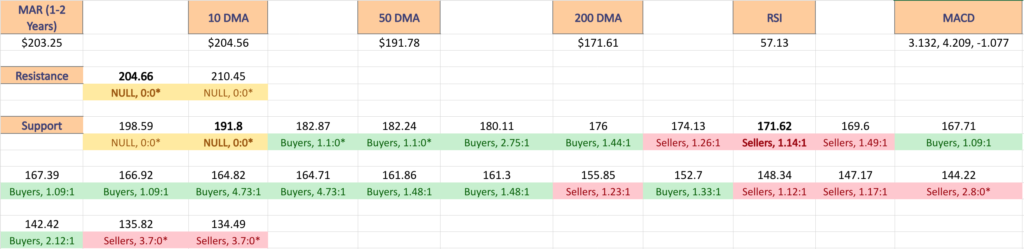
This is particularly important at a time such as now, when prices are stuck between a support zone created by the price consolidation of mid 2023 & the downward resistance pressure of their 10, 50 & 200 day moving averages.
Below is a brief technical analysis of UCO’s recent performance, as well as a review of Buyer:Seller volume at each price level that they’ve traded at over the past 2-3 years.
It is not intended as investment advice, but rather as an additional tool that can be looked at in addition to your normal due diligence process to assess the strength (or weakness) of support & resistance levels.
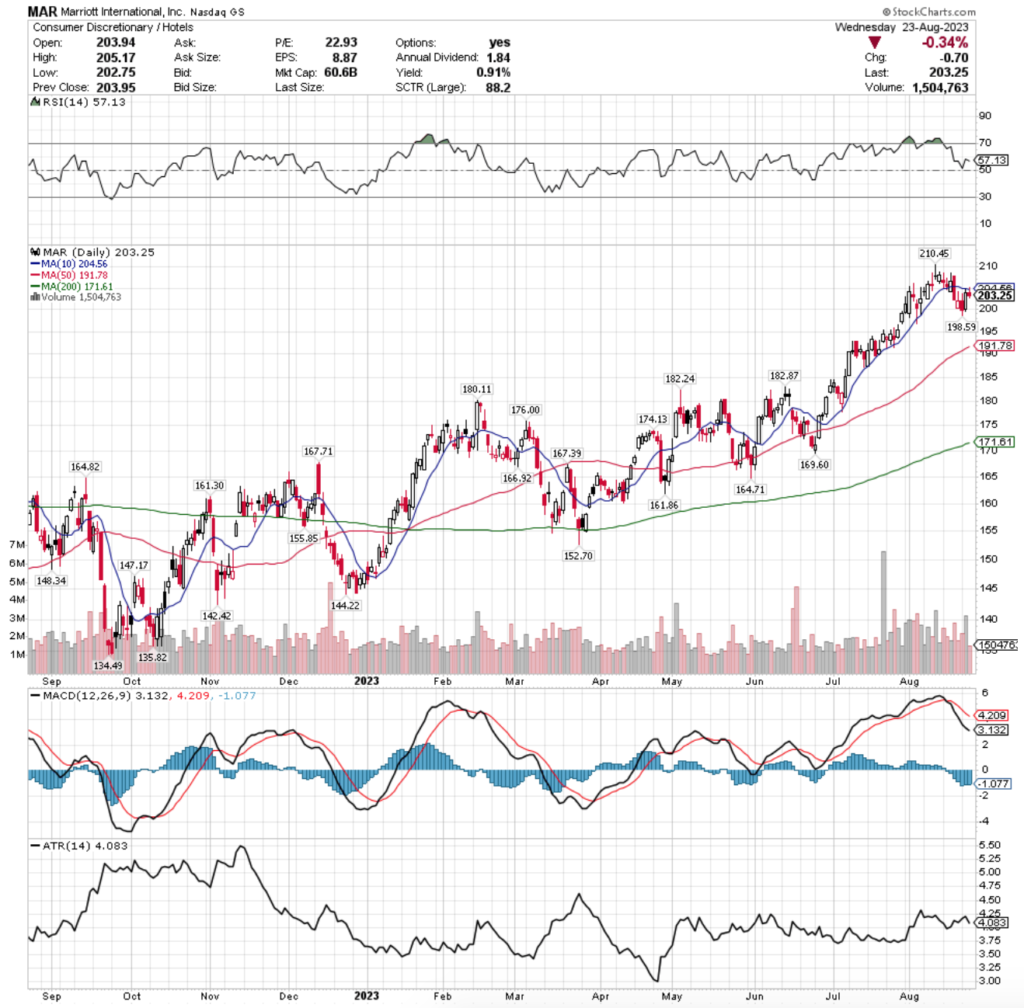
Technical Analysis Of UCO, The ProShares Ultra Bloomberg Crude Oil ETF
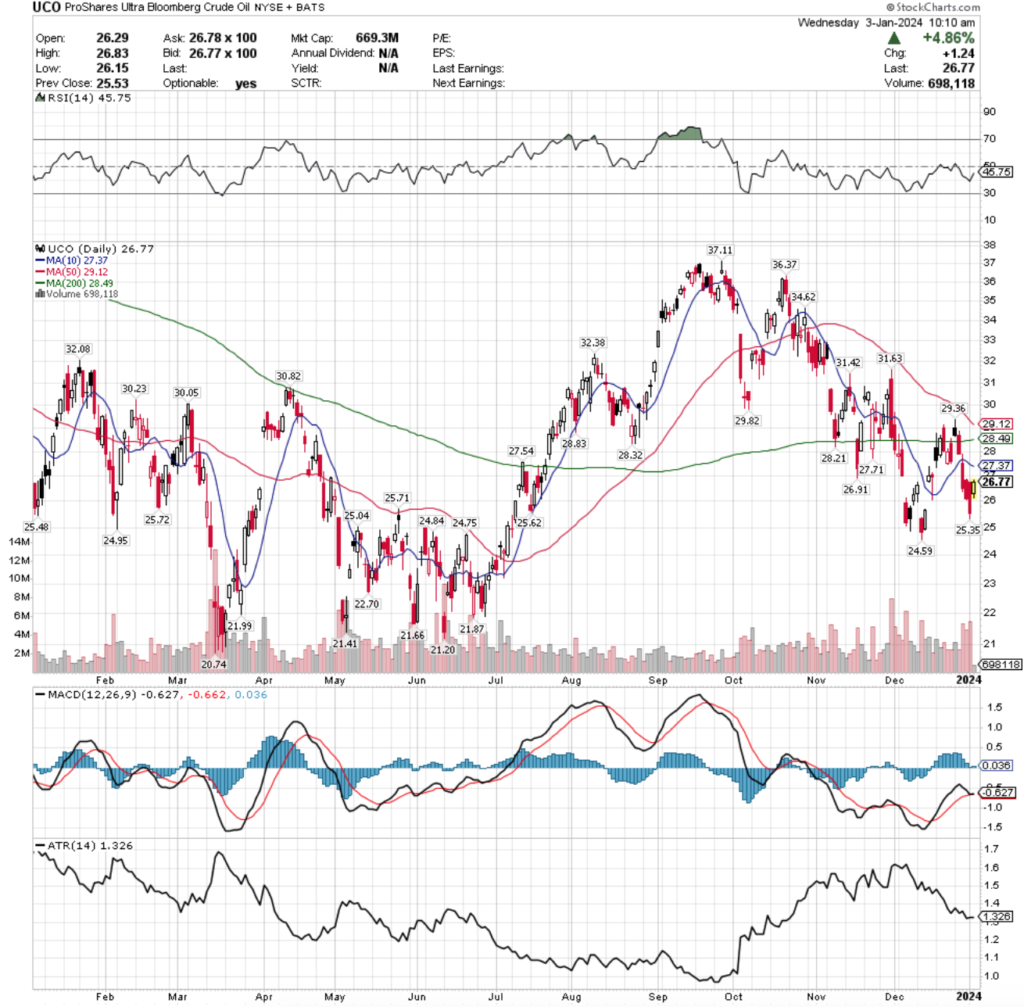
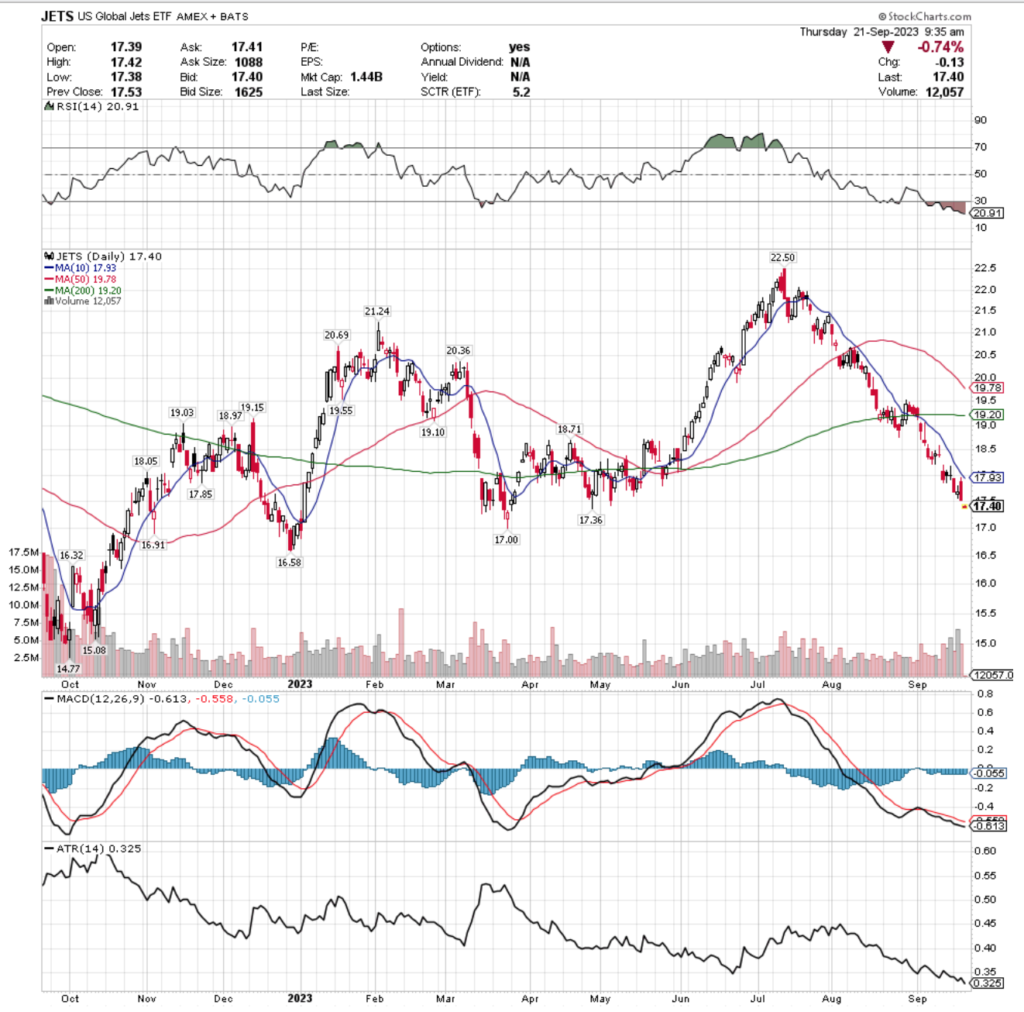
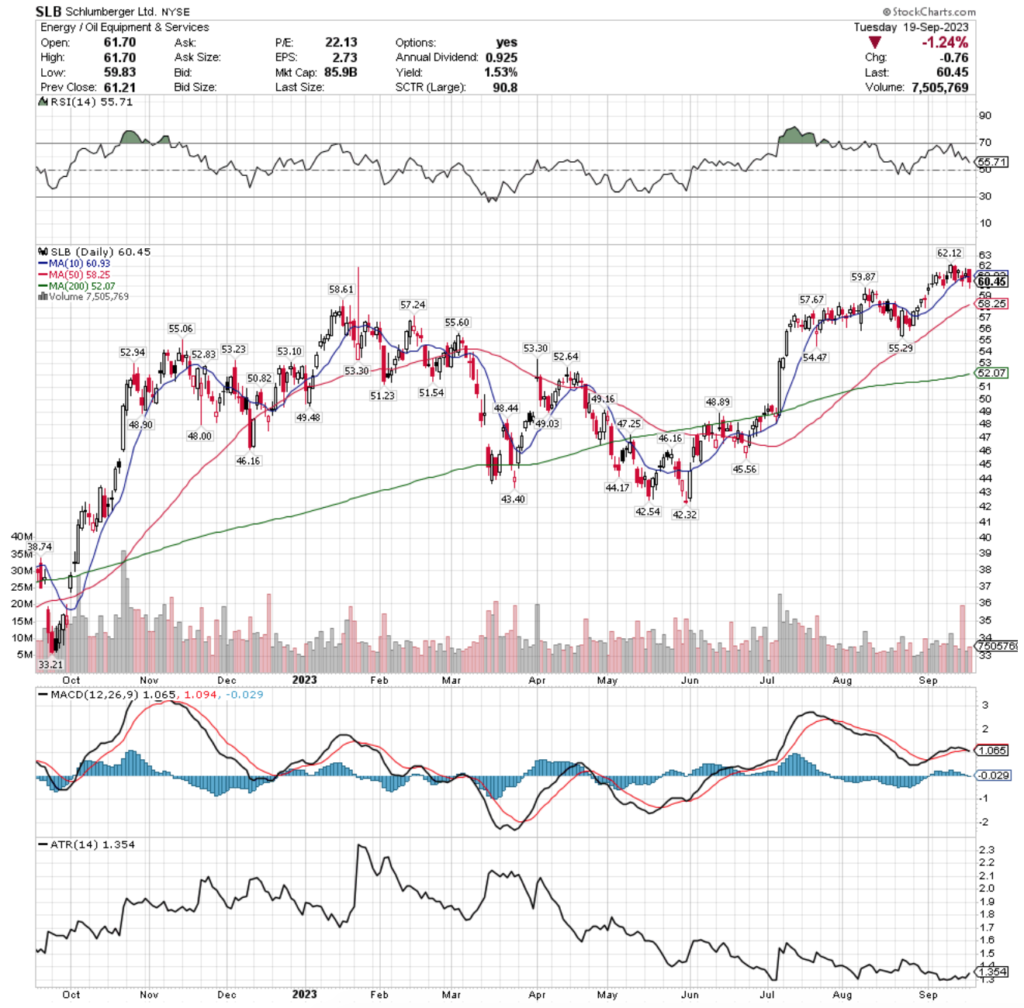
Their RSI is currently trending back towards neutral & sits at 45.75, while their MACD has recently flattened after being in bearish decline following the declines of the past week.
Volumes last week were +44.34% above average compared to the year prior (4,165,920 vs. 2,886,132.67) as market participants were eager to sell their shares of UCO.
Last week kicked off with a shooting star candlestick on Tuesday 12/26/2023, which was right in between the 50 & 200 day moving averages, setting the stage for the declines of the rest of the week.
The next day opened just below Tuesday’s close, tested higher but ultimately declined through the support of the 200 day moving average on light volume, which could be attributed to people taking time off for the holiday, or it could show indecision about the strength of the 200 DMA.
Thursday brought the sellers out in full force, with the session opening below the 10 day moving average, temporarily rising above its resistance, but ultimately falling back down & the day declined ~-5% from Wednesday’s close.
Friday the risk off sentiment continued, with the session opening above the day prior’s close, but ultimately it was risk-off sentiment going into the weekend & sellers forced the price lower.
This week kicked off on Tuesday with UCO opening near Friday’s opening price, but the sellers came back out in full force & drove the price down -2.18% on the day.
Their lows have been increasing since mid-December, but their moving averages are currently painting a bearish picture for the near-term, with the current price being below the 10, 50 & 200 day moving averages, all of which are moving bearishly.
The 50 DMA is set to make a death cross with the 200 DMA in the coming days which is also something that investors & traders will need to keep an eye on.
There are many support touch-points in the $25-26/share zone, as well as the $24-25/share zone which will be where all eyes focus in the event of further near-term declines.
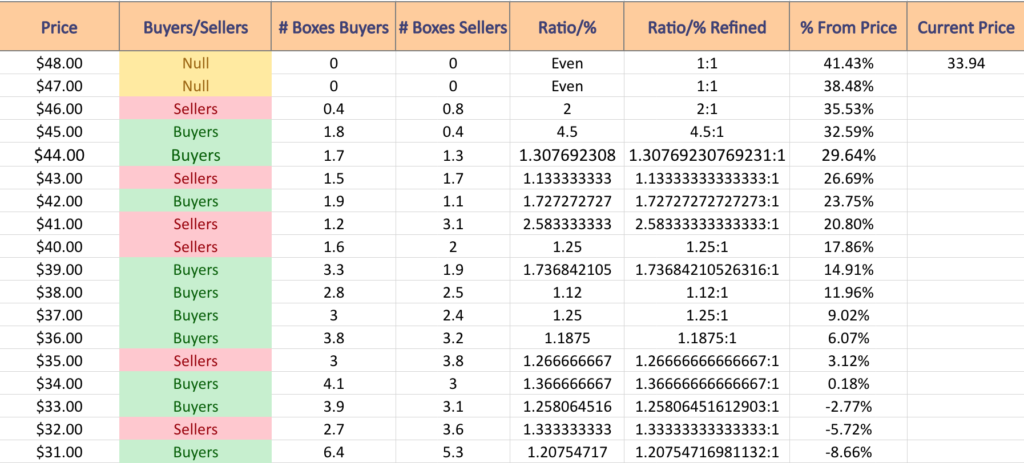
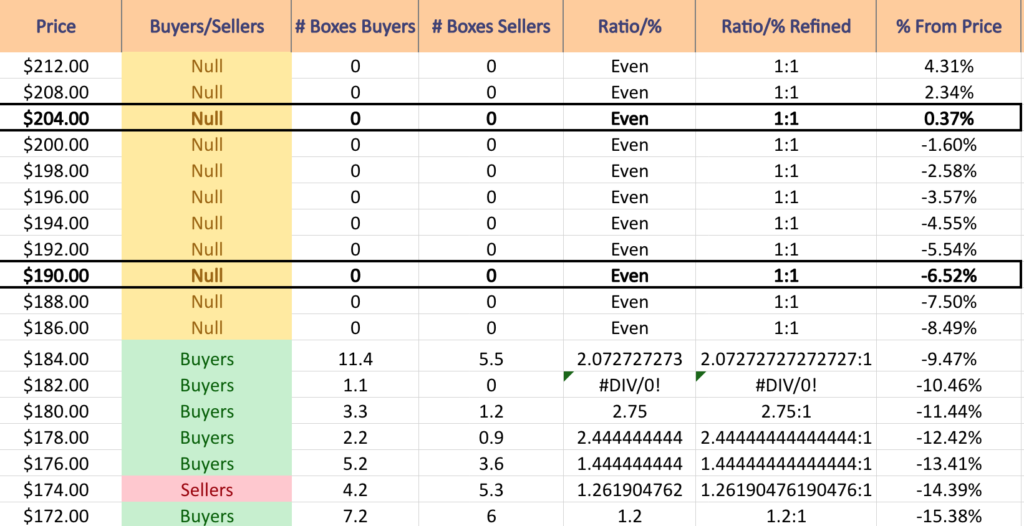
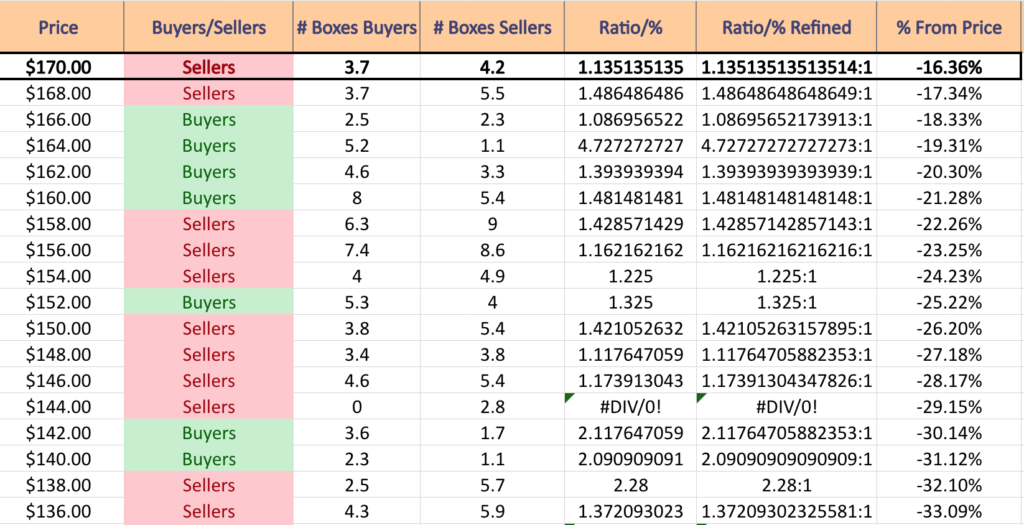
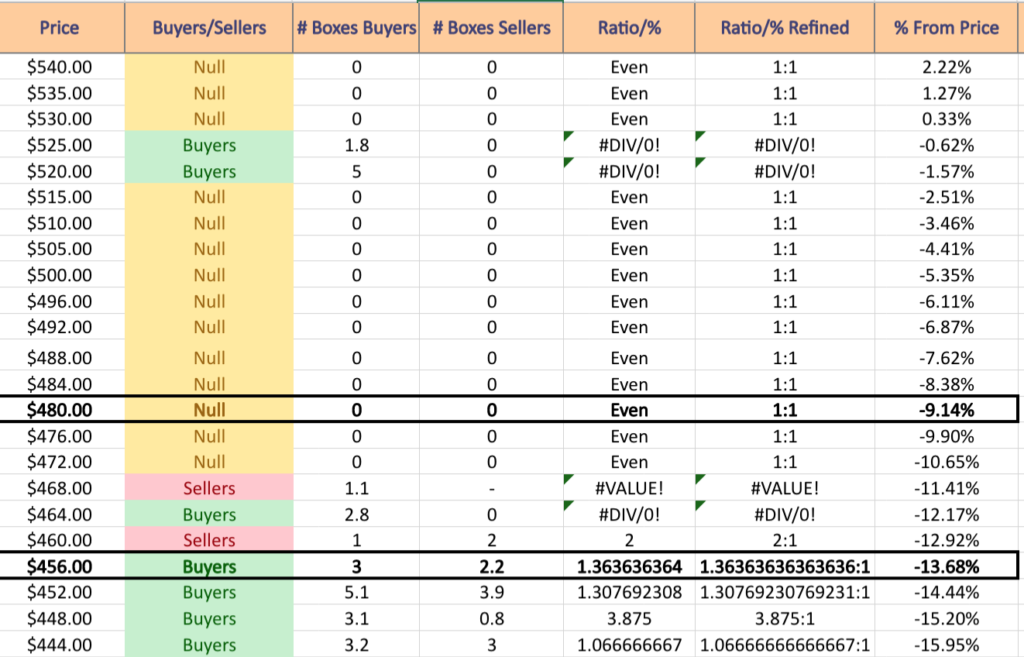
The price level:volume sentiment analysis below can be used as an additional tool to identify the strength (or weakness) of support & resistance levels that UCO has traded at over the past 2-3 years.
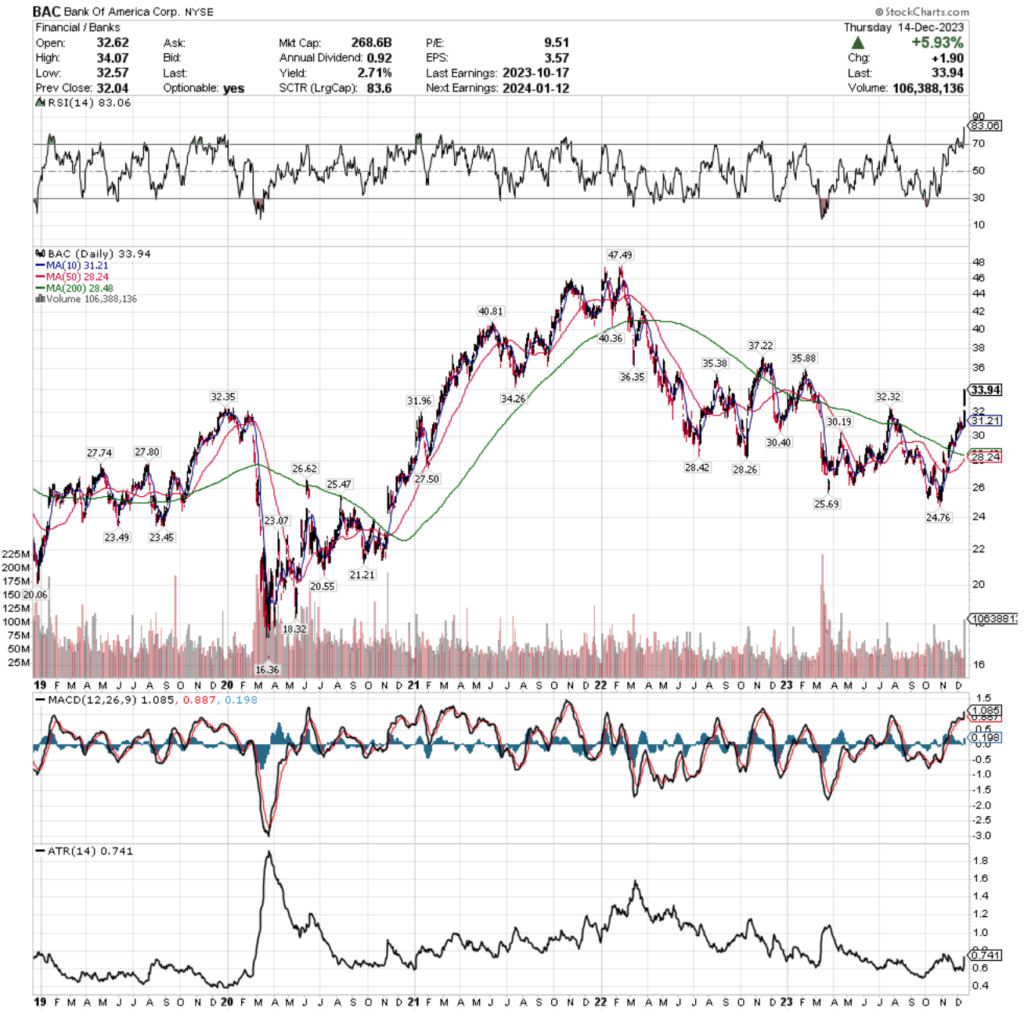
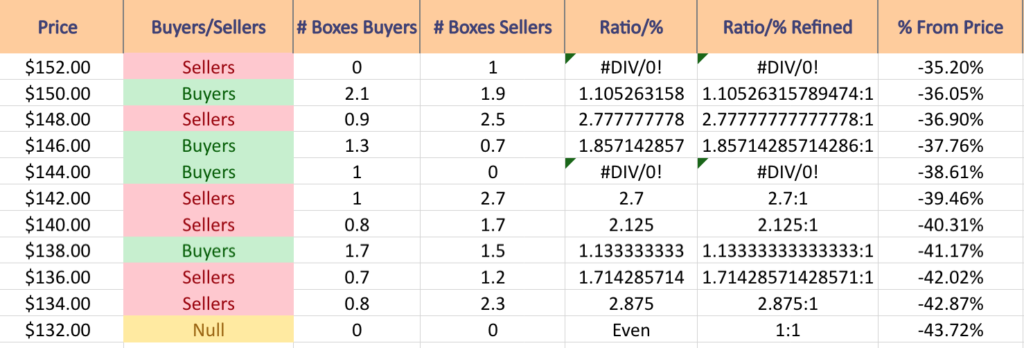
Given that the volume data goes back that far, the chart below is also included, covering the technical performance of UCO for the past 3 years.
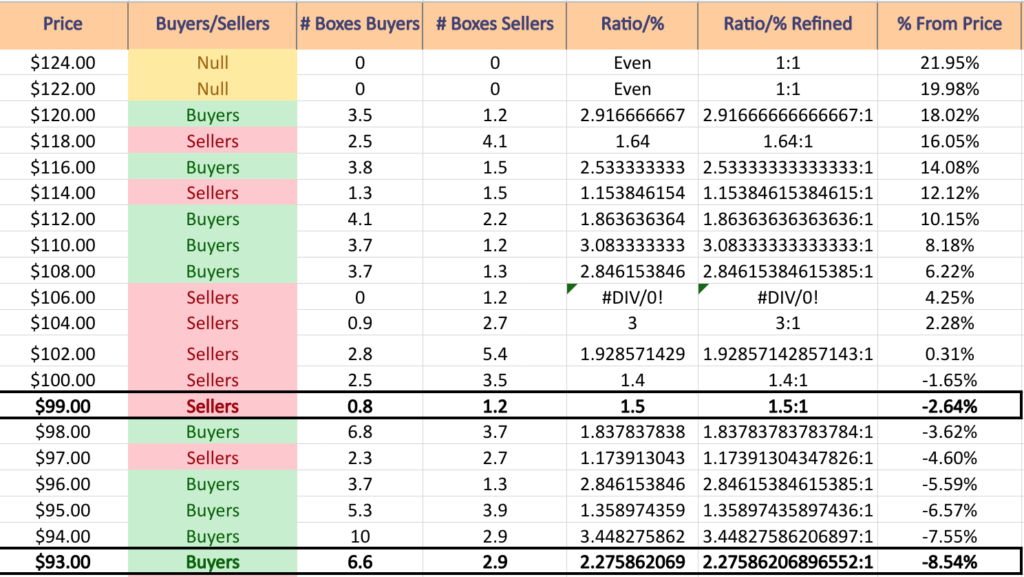
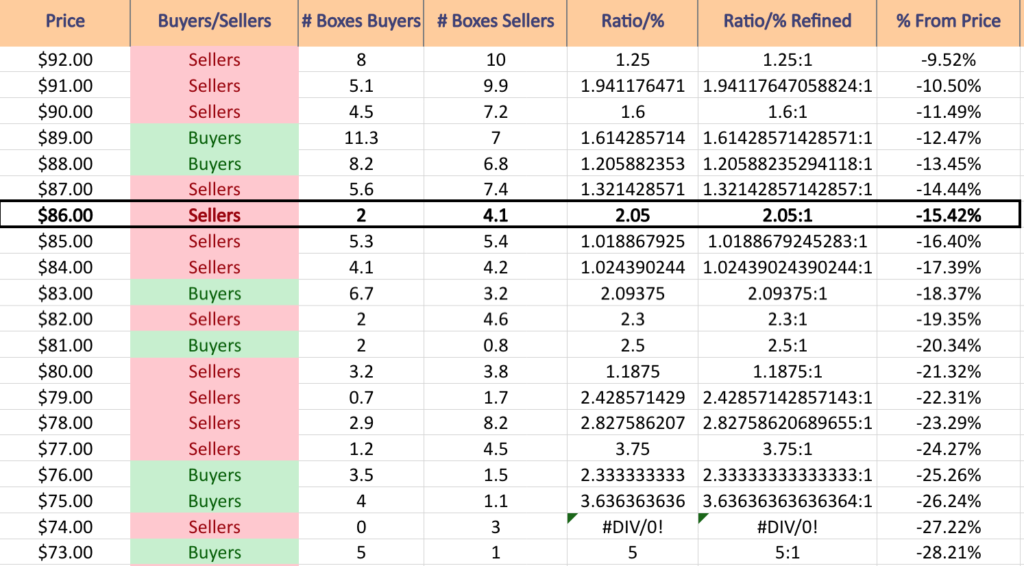
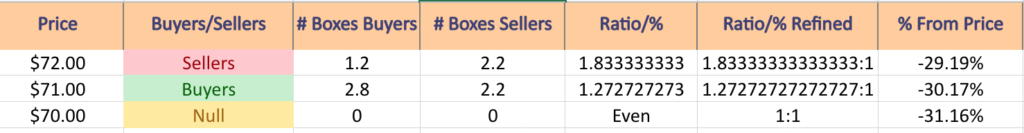
Price Level:Volume Sentiment Analysis For UCO, The ProShares Ultra Bloomberg Crude Oil ETF
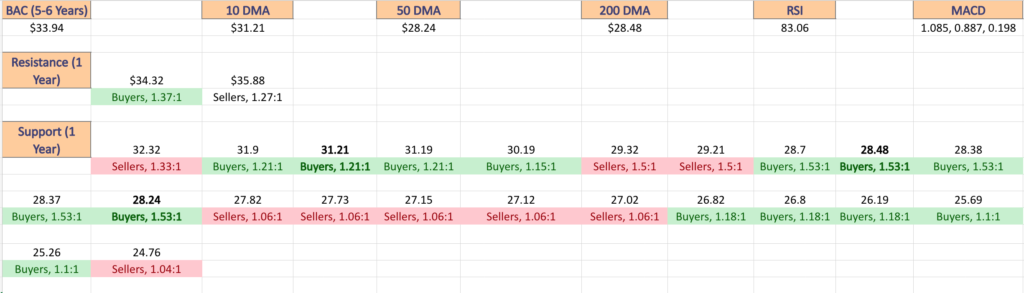
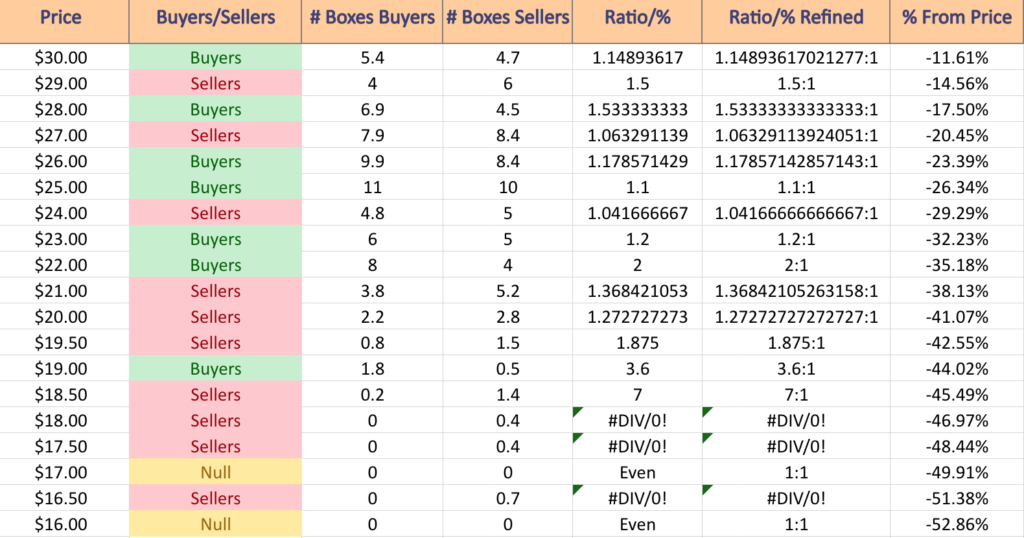
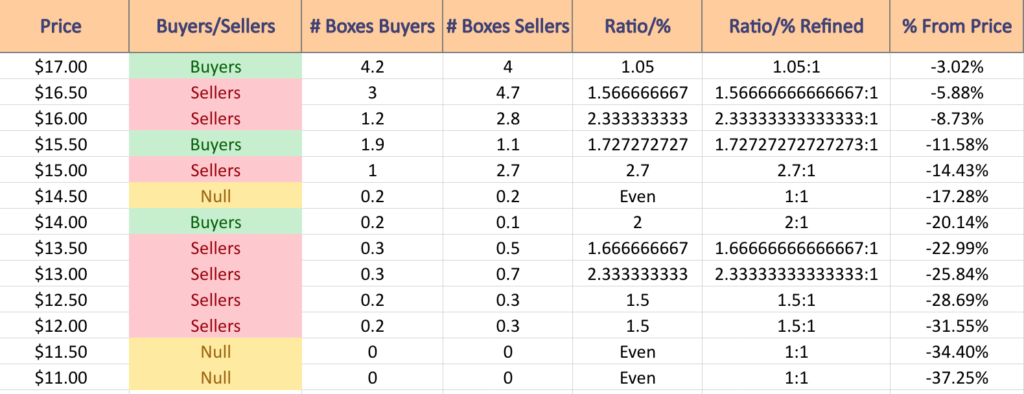
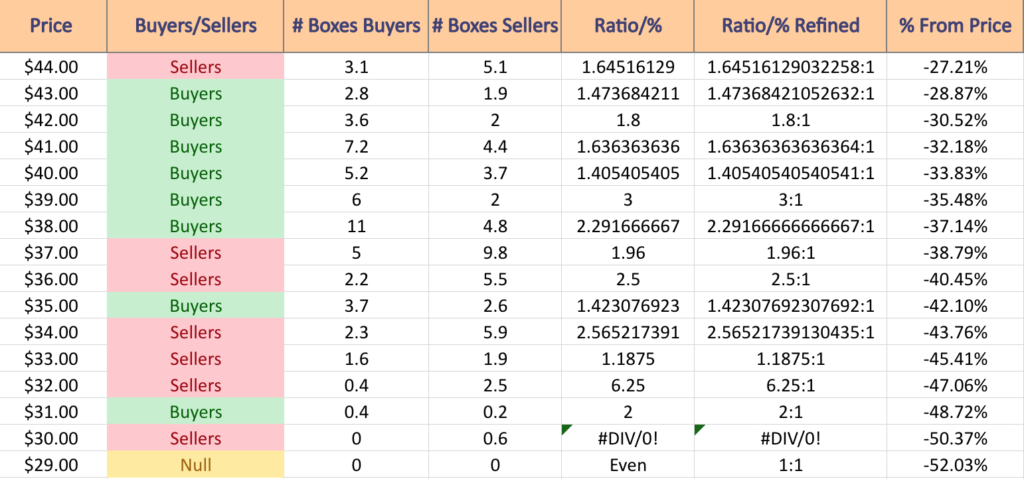
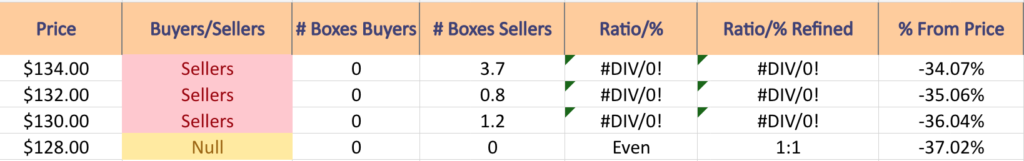
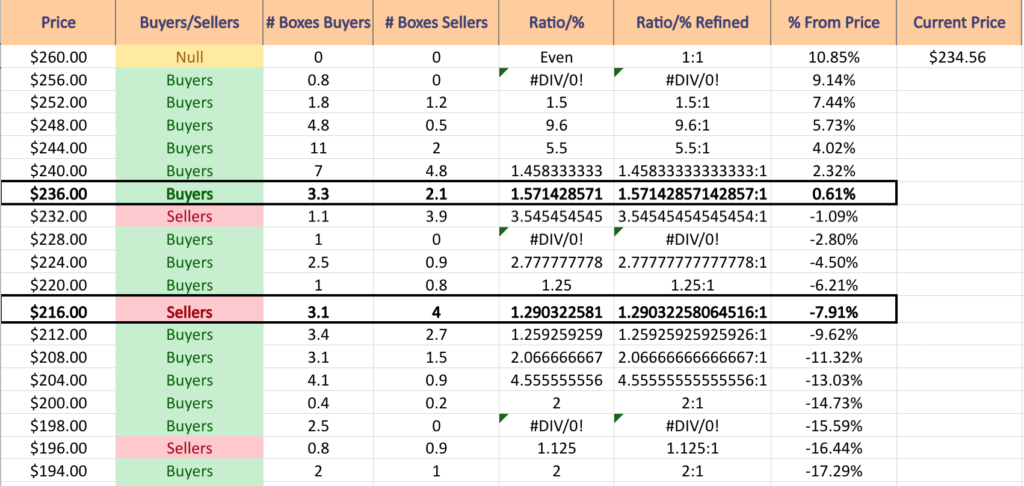
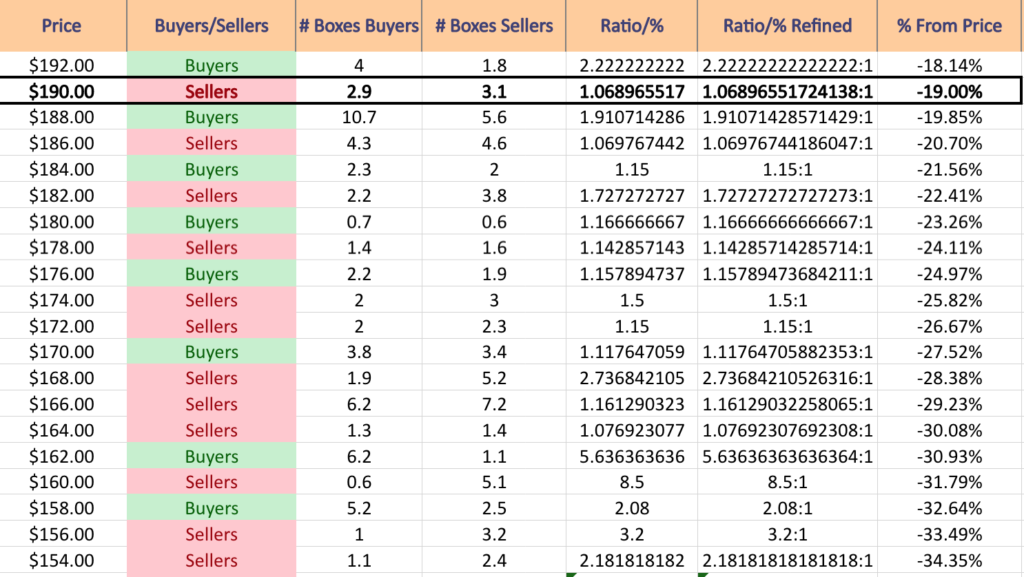
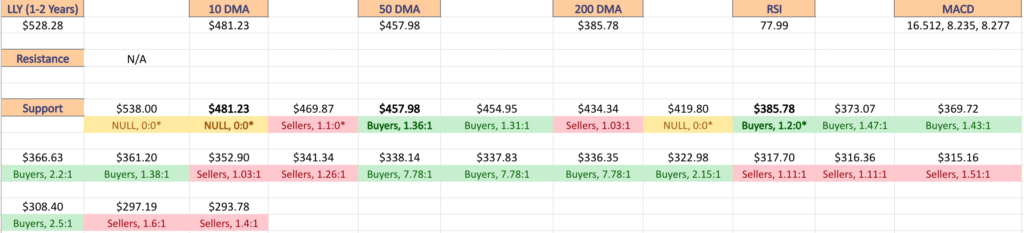
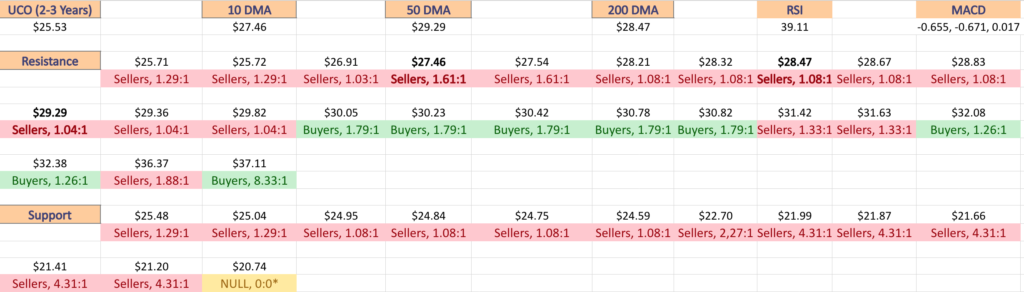
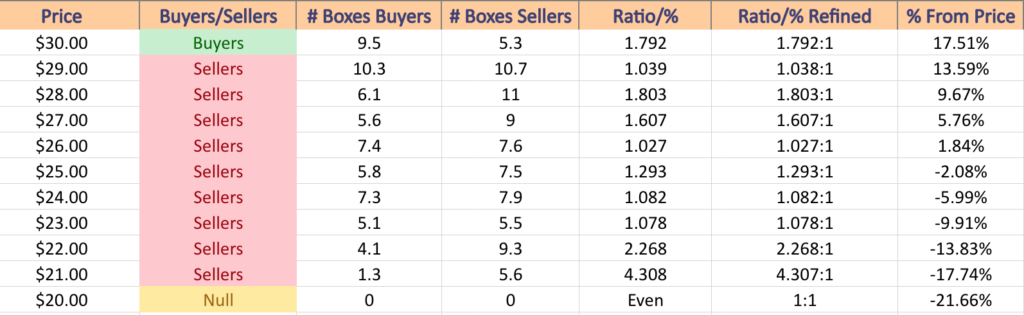
The first chart below shows the current 1-year support & resistance levels for UCO, as well as the price level:volume sentiment for each touch-point.
The ratio of buyers:sellers can be used in addition to your other due diligence tools to assess the strength or weakness of the support/resistance levels based on previous investor behavior at these levels.
This is not investment advice & is only meant to serve as an additional perspective to consider when looking at price charts.
While most of the support levels seen below are dominated by sellers, the $24-25 price level historically has seen 1.08:1 Sellers:Buyers, which may indicate that there will be stronger support there than at the $25-26/share level (Sellers, 1.29:1) or the $21-22/share (Sellers, 4.31:1) price levels.
Another important consideration to take when reading the information below is that at price extremes there will tend to be more of a skew to one side or the other.
This is in part due to the extreme levels inciting more volatile, higher volume trading, and the appearance of gaps up or down from the extreme price levels when market participants finally run out of steam.
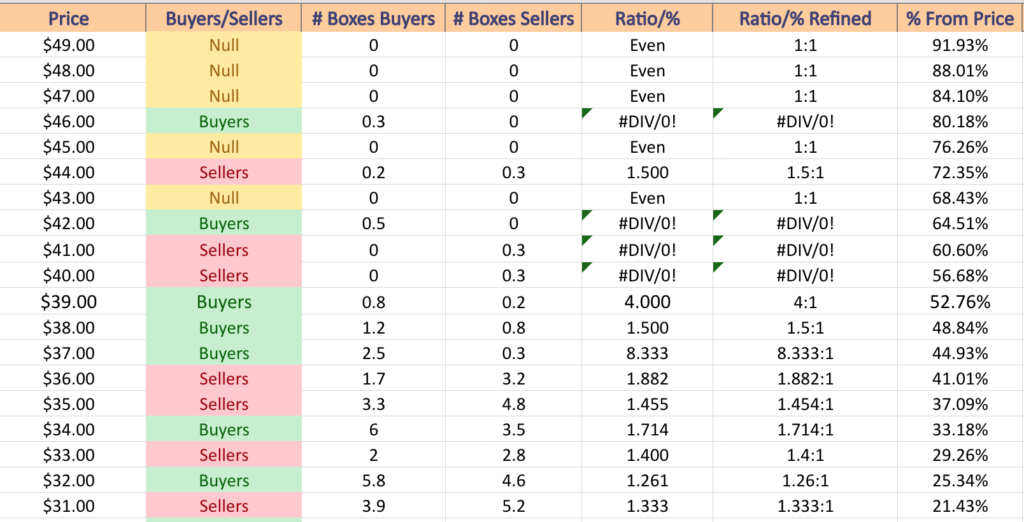
$49 – NULL – 0:0*; +91.93% From Current Price Level
$48 – NULL – 0:0*; +88.01% From Current Price Level
$47 – NULL – 0:0*; +84.1% From Current Price Level
$46 – Buyers – 0.3:0*; +80.18% From Current Price Level
$45 – NULL – 0:0*; +76.26% From Current Price Level
$44 – Sellers – 1.5:1; +72.35% From Current Price Level
$43 – NULL – 0:0*; +68.43% From Current Price Level
$42 – Buyers – 0.5:0*; +64.51% From Current Price Level
$41 – Sellers – 0.3:0*; +60.6% From Current Price Level
$40 – Sellers – 0.3:0*; +56.68% From Current Price Level
$39 – Buyers – 4:1; +52.76% From Current Price Level
$38 – Buyers – 1.5:1; +48.48% From Current Price Level
$37 – Buyers – 8.33:1; +44.93% From Current Price Level
$36 – Sellers – 1.88:1; +41.01% From Current Price Level
$35 – Sellers – 1.45:1; +37.09% From Current Price Level
$34 – Buyers – 1.71:1; +33.18% From Current Price Level
$33 – Sellers – 1.4:1; +29.26% From Current Price Level
$32 – Buyers – 1.26:1; +25.43% From Current Price Level
$31 – Sellers – 1.33:1; +21.43% From Current Price Level
$30 – Buyers – 1.79:1; +17.51% From Current Price Level
$29 – Sellers -1.04:1; +13.59% From Current Price Level – 50 Day Moving Average*
$28 – Sellers – 1.8:1; +9.67% From Current Price Level – 200 Day Moving Average*
$27 – Sellers – 1.61:1; +5.76% From Current Price Level – 10 Day Moving Average
$26 – Sellers – 1.03:1; +1.84% From Current Price Level
$25 – Sellers – 1.29:1; -2.08% From Current Price Level – Current Price Block*
$24 – Sellers – 1.08:1; -5.99% From Current Price Level
$23 – Sellers – 1.08:1; -9.91% From Current Price Level
$22 – Sellers – 2.27:1; -13.83% From Current Price Level
$21 – Sellers – 4.31:1; -17.74% From Current Price Level
$20 – NULL – 0:0*; -21.66% From Current Price Level
*** I DO NOT OWN SHARES OR OPTIONS CONTRACT POSITIONS IN UCO ETF AT THE TIME OF PUBLISHING THIS ARTICLE ***