UUP, the Invesco DB U.S. Dollar Index Bullish Fund ETF tracks the value of the U.S. Dollar against a basket of six other global currencies, the euro, the Japanese yen, the British pound, the Canadian dollar, the Swedish krona & the Swiss franc.
Last week while chatting about markets with Turtle Capital (@Corp_Raider99) of Swami Research (@SwamiResearch) he had the idea to run one of my price:volume sentiment analyses on currencies & a number of other commodities; if you’re not following both of those accounts I highly recommend that you do.
The Price:Volume analysis below seeks to display the volume at specific share-price levels from over the past one-to-two years & is intended to serve as a reference point for how investors viewed UUP ETF’s value at each level.
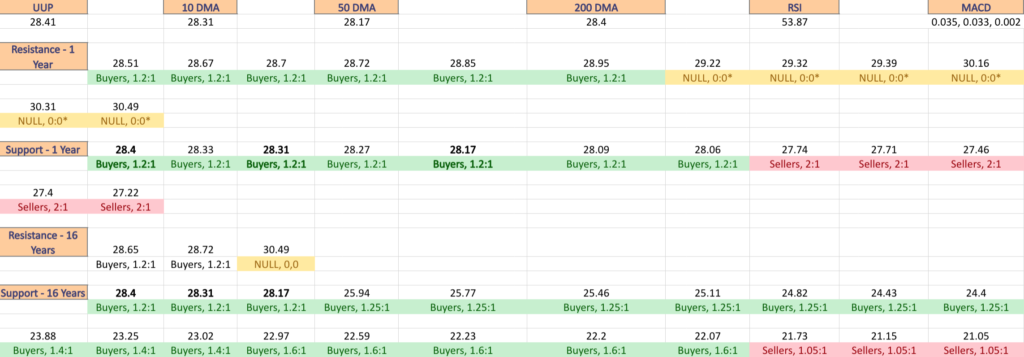
It also includes a list of moving averages, as well as support & resistance levels, which will be marked in bold.
UUP, The Invesco DB U.S. Dollar Index Bullish Fund ETF’s Price:Volume Sentiment Broken Down
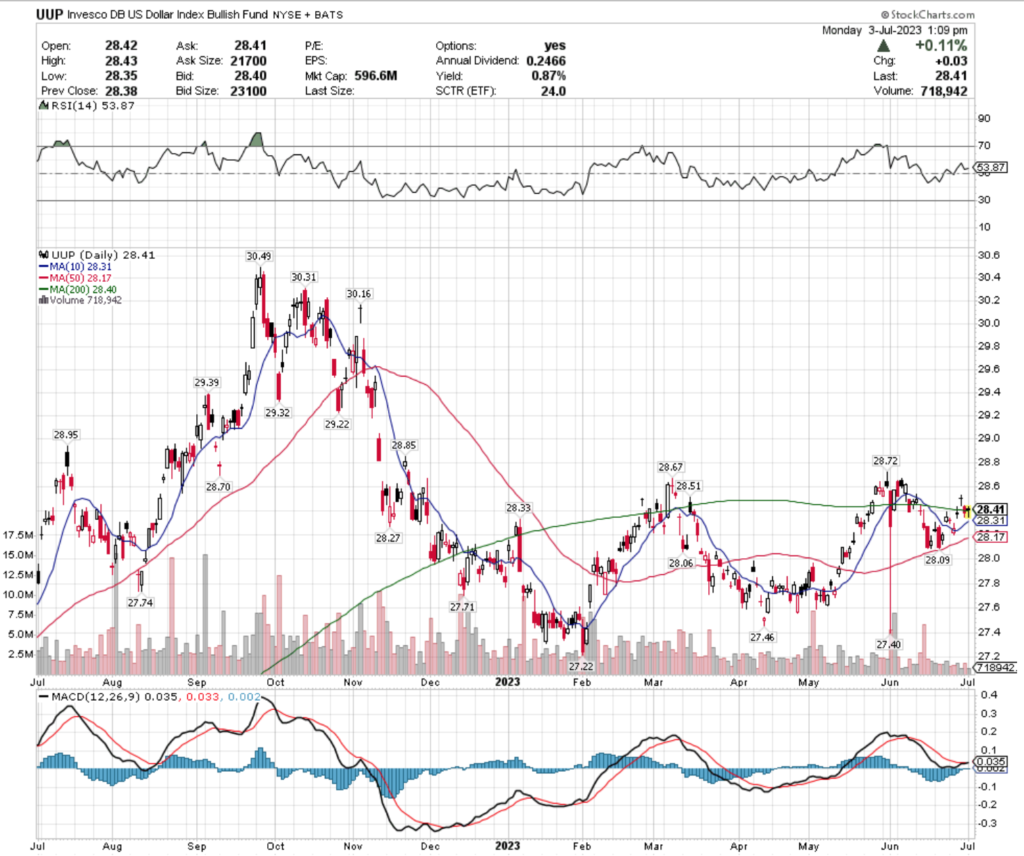
Using UUP’s one year chart, note that their RSI is relatively neutral at 53.87 & their MACD is bullish/flat.
Recent trading volumes have been below average compared to the year prior, as trades & investors have become less enthusiastic & more cautious in the last month.
Their past two weeks have primarily closed in spinning top or doji candlesticks, with the last four sessions in particular clustering around the 200 day moving average.
Thursday’s dragonfly doji signaled the oncoming reversal, which is confirmed by the following two sessions ducking lower, testing the same area with their lower shadows & both resulting in filled in real bodies of the candles (Friday’s was red, Monday’s black), which further indicates uncertainty among market participants about UUP’s near-term value.
The price:volume sentiment data covers the last 15-16 years, so I have also included the 16 year chart for UUP below, so that you can see the support & resistance points over that time period as well.
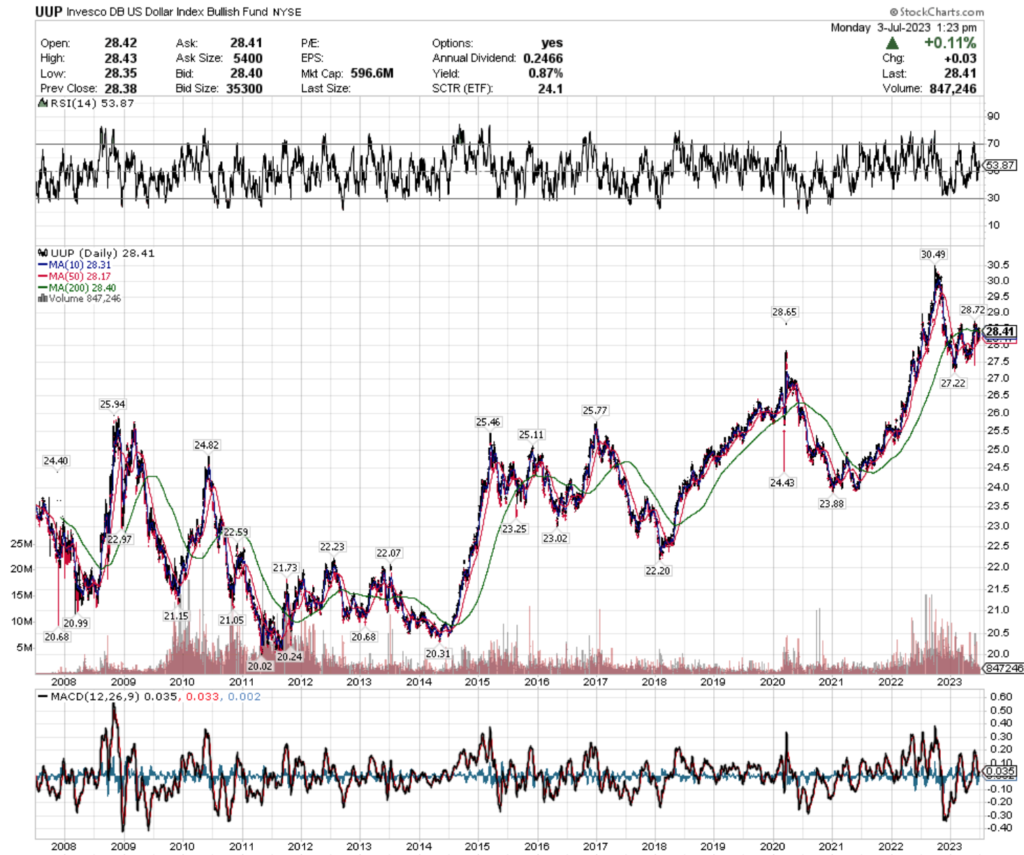
The bold prices on the image below denote the moving average levels just listed & the bold entries in the list form of the analysis under the images include other levels of support.
Each corresponding price level using a ratio of Buyers:Sellers (or Sellers:Buyers), NULL values denote that there was not enough data, so the ratio would’ve been 0:0.
Ratios with a 0 for the denominator/constant are denoted with an *, but are reported as is, as we are accounting for volume/sentiment.
Also, as there is such a wide spread between many price levels having activity data, many of the levels are marked NULL, as there was limited volume data for them, and they were not included in the long list below unless they were relevant to support/resistance levels.

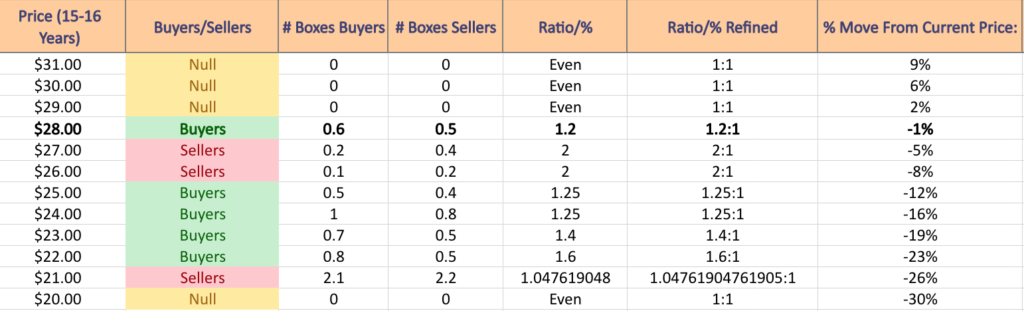
UUP, The Invesco DB U.S. Dollar Index Bullish Fund ETF’s Volume By Price Level
$31 – NULL – o:0*, 9% From Current Market Price
$30 – NULL – 0:0*, 6% From Current Market Price
$29 – NULL – 0:0*, 2% From Current Market Price
$28 – Buyers – 1.2:1, -1% From Current Market Price
$27 – Sellers – 2:1, -5% From Current Market Price
$26 – Sellers – 2:1, -8% From Current Market Price
$25 – Buyers – 1.25:1, -12% From Current Market Price
$24 – Buyers – 1.25:1, -16% From Current Market Price
$23 – Buyers – 1.4:1, -19% From Current Market Price
$22 – Buyers – 1.6:1, -23% From Current Market Price
$21 – Sellers – 1.05:1, -26% From Current Market Price
$20 – NULL – 0:0*, -30% From Current Market Price
Tying It All Together
The list & image above paint the picture as to how investors & traders have behaved at various price levels that UUP has been at over the past fifteen-to-sixteen years.
It is not meant to serve as investment/trading advice, and is simply a way to visualize what investor/trader sentiment has been like at each of the price levels mentioned, as well as what it was at levels of support & resistance that are denoted in the image & list.
As always, do your own due diligence before making investing/trading decisions.
For more on the methodology on how the data was collected & put together, please refer to our original Price:Volume analysis.
*** I DO NOT OWN SHARES OR OPTIONS CONTRACT POSITIONS IN UUP AT THE TIME OF PUBLISHING THIS ARTICLE ***