SPY, the SPDR S&P 500 ETF gained +2.32% over the past week, much of which came from Friday’s +1.18% gap up session.
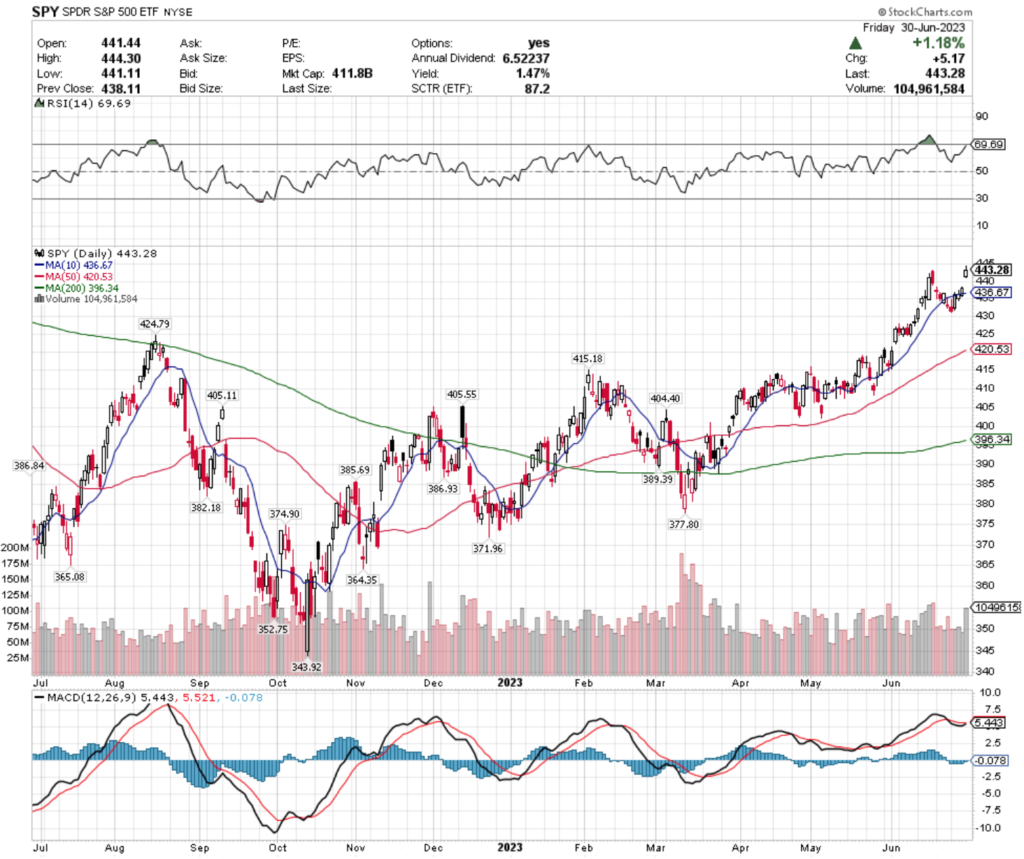
Their RSI is about to enter overbought territory at 69.69 & their MACD is bullish.
Last week’s trading volumes were above average compared to the year prior, signaling confidence behind their price action in investors’ eyes.
However, Wednesday’s spinning top & Friday’s shooting star candlestick are signaling that there will be a cool down period in prices in the near-term, especially when combined with the other indicators.
Their 10 day moving average will be the first major test of support.
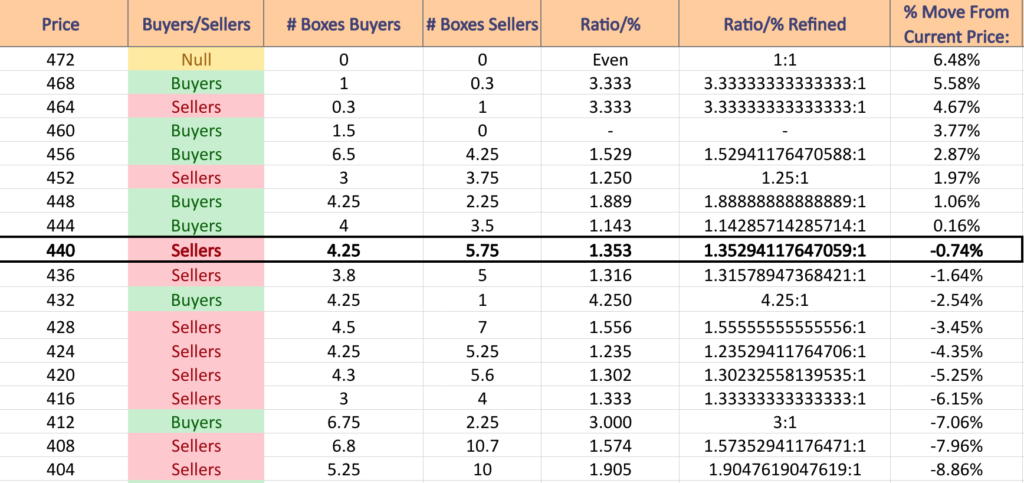
SPY has support at the $436.67 (10 Day Moving Average; Volume Sentiment: Sellers, 1.32:1), $424.79 (Volume Sentiment: Sellers, 1.24:1), $420.53 (50 Day Moving Average; Volume Sentiment: Sellers, 1.30:1) & $415.18/share (Volume Sentiment: Buyers, 3:1) price levels, with resistance (all on 2 year chart) at the $447.43 (Volume Sentiment: Buyers, 1.14:1), $452.69 (Volume Sentiment: Sellers, 1.25:1), $460.87 (Volume Sentiment: Buyers, 1.5:0*) & $468.78/share (Volume Sentiment: Buyers, 3.33:1) price levels.
QQQ, the Invesco QQQ Trust ETF added +1.9% over the past week, mostly due to Friday’s +1.54% gap up after spending the week in a consolidation range.
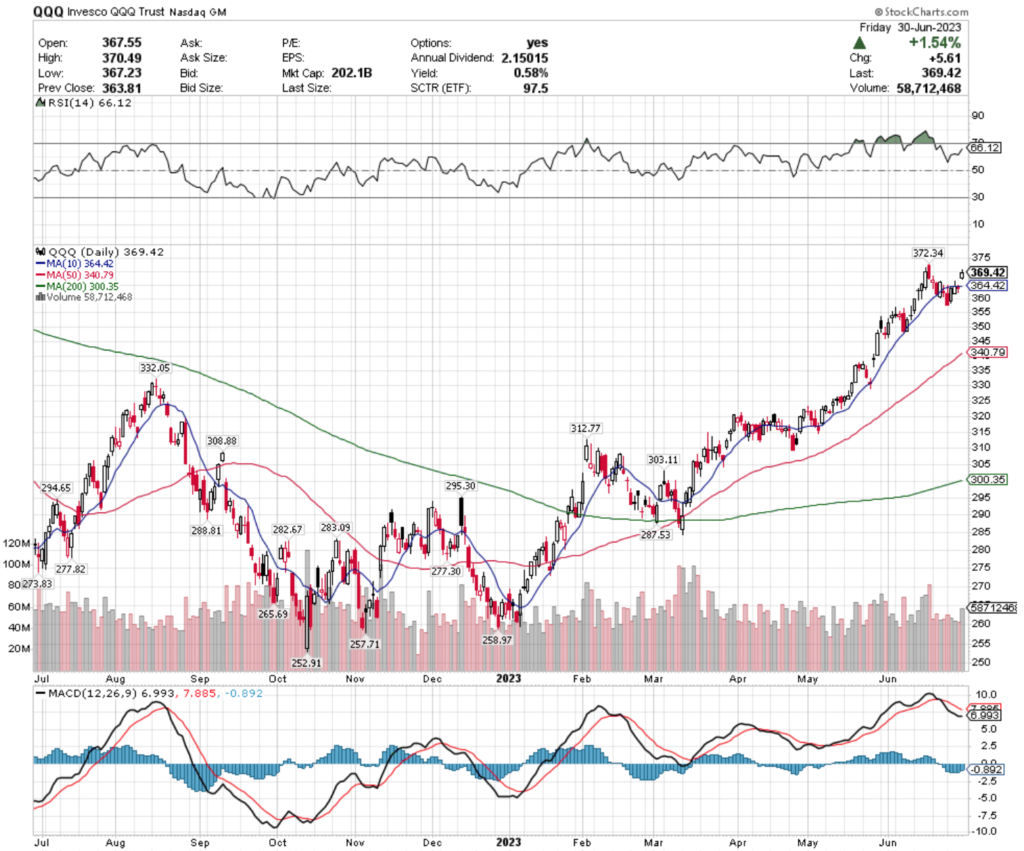
Their RSI is trending towards overbought conditions, with their MACD bearishly falling.
Last week’s trading volumes were relatively average compared to the year prior, with the candlesticks for the week adding more color to how investors are feeling about QQQ.
The first four days of the week traded in a relatively tight range, with Thursday closing with a hanging man candlestick, projecting bearish sentiment.
Friday’s candle’s open to closing price range all took place on the lower range of the candle overall, which also paints a cautious attitude among investors.
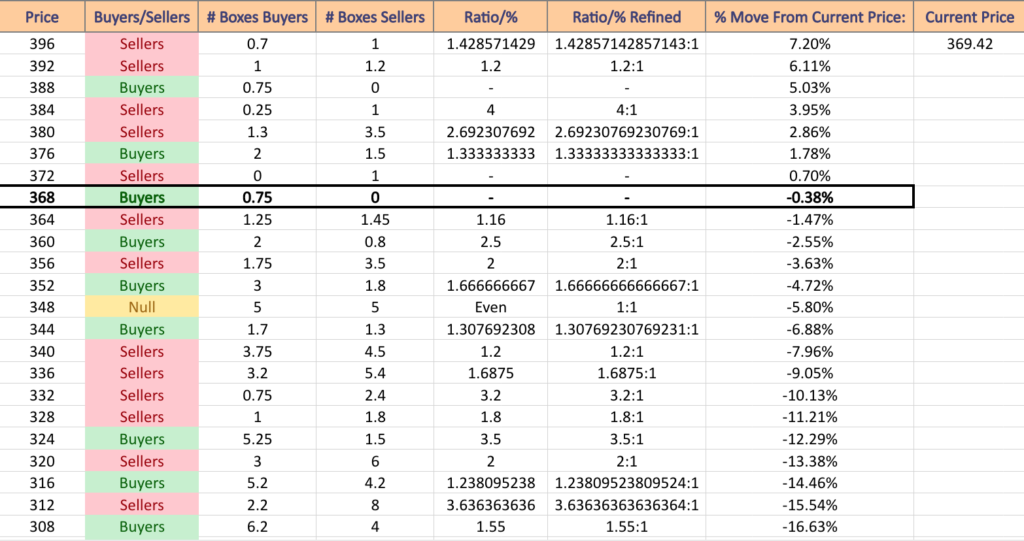
QQQ has support at the $364.42 (10 Day Moving Average; Volume Sentiment: Buyers, 1.16:1), $340.79 (50 Day Moving Average; Volume Sentiment: Sellers, 1.2:1), $332.05 (Volume Sentiment: Sellers, 3.2:1) & $312.77/share (Volume Sentiment: Sellers, 3.64:1) price levels, with resistance at the $372.34 (Volume Sentiment: Sellers, 1:0*), $374.55 (Volume Sentiment: Sellers, 1:0*), $377.97 (Volume Sentiment: Buyers, 1.33:1) & $400.45/share (Volume Sentiment: NULL, 0:0*) price levels.
IWM, the iShares Russell 2000 ETF climbed +3.71% over the past week, as small caps were the favorite among investors for the week.
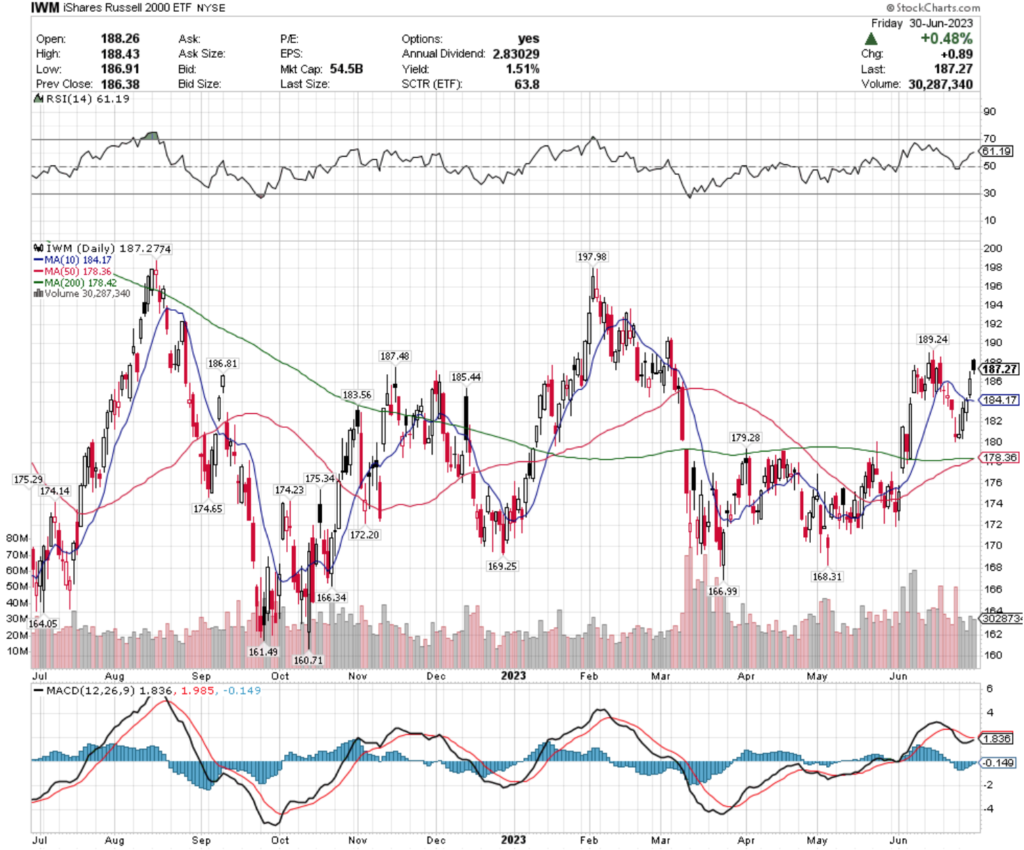
Their RSI is trending towards overbought at 61.19, with their MACD bullish.
Recent volumes this past week were above average compared to the year prior, but Friday’s filled in, but bullish hanging man candle casts a foreboding shadow around a week of solid growth & performance for IWM.
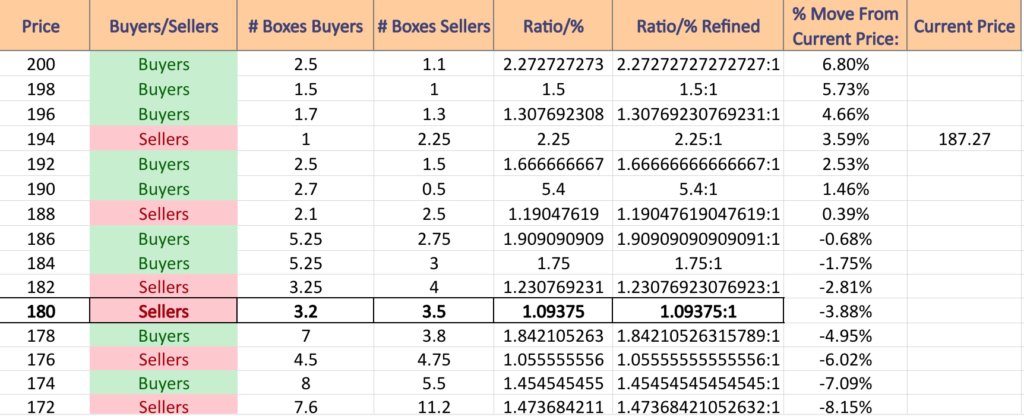
IWM has support at the $186.81 (Volume Sentiment: Buyers, 1.91:1) $185.44 (Volume Sentiment: Buyers, 1.75:1), $184.17 (10 Day Moving Average; Volume Sentiment: Buyers, 1.75:1) & $183.56/share (Volume Sentiment: Sellers, 1.23:1) price levels, with resistance at the $187.48 (Volume Sentiment: Buyers, 1.91:1), $189.24 (Volume Sentiment: Sellers, 1.19:1), $197.98 (Volume Sentiment: Buyers, 1.31:1) & $198.74/share (Volume Sentiment: Buyers, 1.5:1) price levels.
DIA, the SPDR Dow Jones Industrial Average ETF improved +1.98% over the past week, in large part thanks to Friday’s +0.79% gap up session.
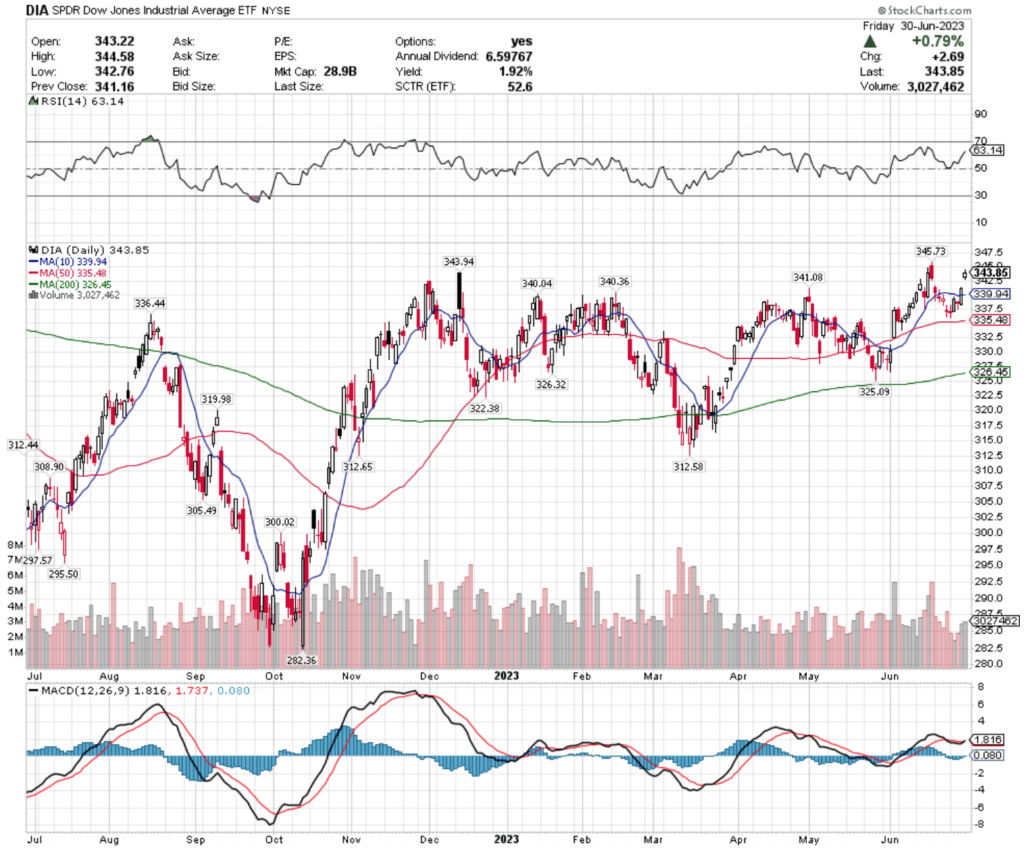
Their RSI is trending towards overbought, with a bullish MACD.
Recent volumes this past week were slightly below average compared to the year prior.
Friday’s spinning top candle will make it important to watch the window created by the day’s gap up, as well as the support that the 10 day moving average provides in the near-term for when trying to figure out where there price is heading next.
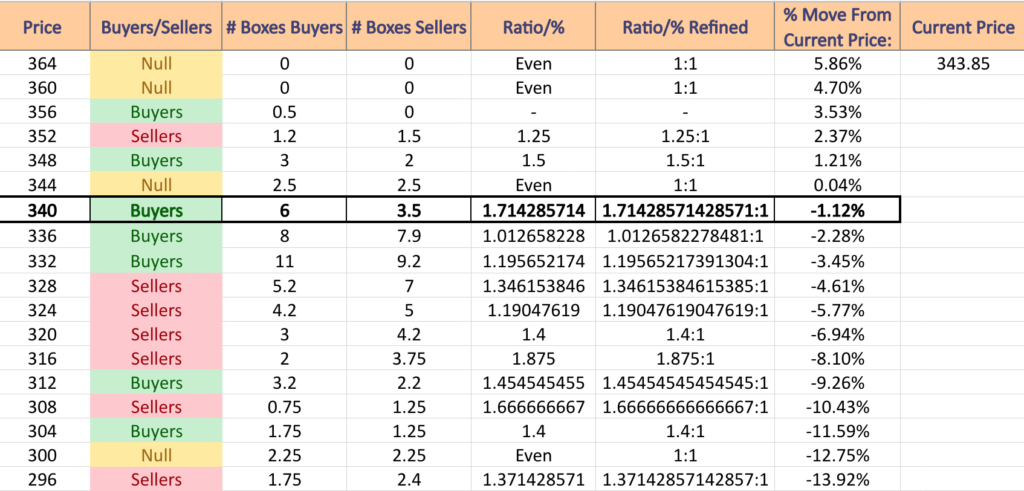
DIA has support at the $341.08 (Volume Sentiment: Buyers, 1.71:1), $340.36 (Volume Sentiment: Buyers, 1.71:1), $340.04 (Volume Sentiment: Buyers, 1.71:1) & $339.94/share (10 Day Moving Average; Volume Sentiment: Buyers, 1.01:1), with resistance at the $343.94 (Volume Sentiment: Buyers, 1.71:1), $345.73 (Volume Sentiment: Even, 1:1), $346.22 (Volume Sentiment: Even, 1:1) & $347.93/share (Volume Sentiment: Even, 1:1) price levels.
Let’s dive into some of the best & worst performing geo-locations & industries in the market based on technical ratings from this week’s data!
Greece (GREK), Information Technology (FTEC), U.S. Infrastructure Development (PAVE) & Self Driving EV & Tech (IDRV) Are All Bullishly Leading The Market
GREK, the Global X MSCI Greece ETF has gained +64.96% over the past year, climbing +79.03% since their 52-week low in September of 2022 (ex-distributions).
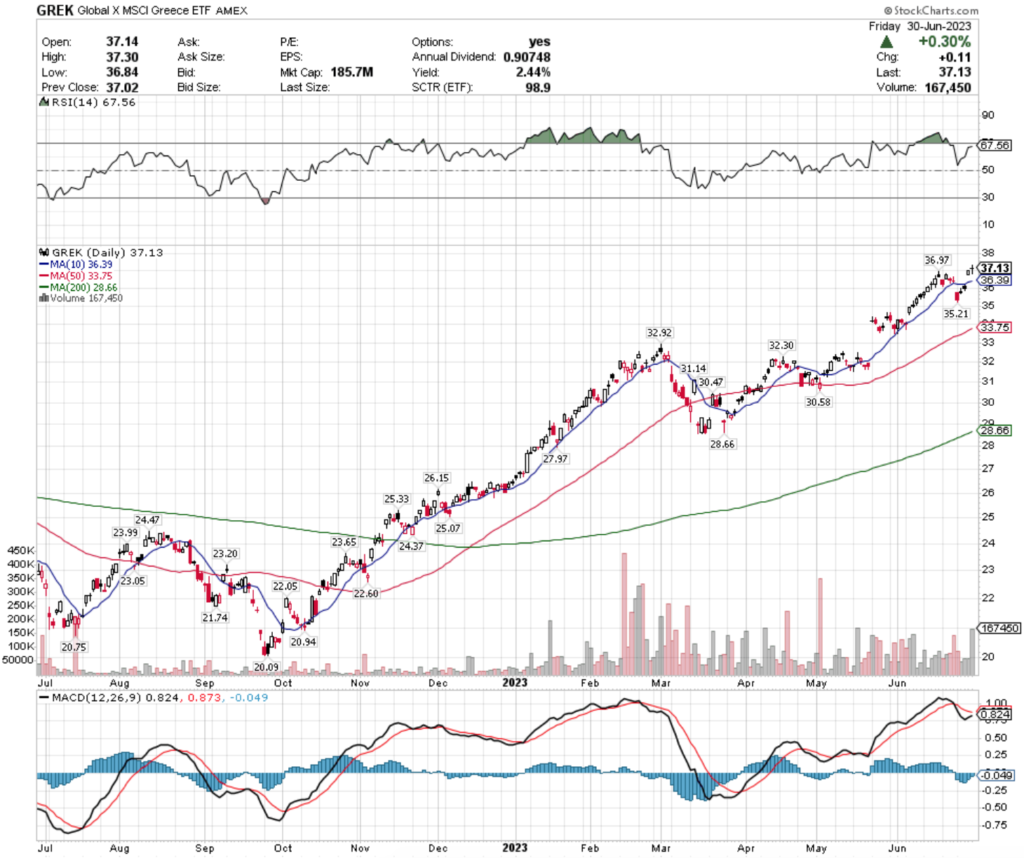
Their RSI is approaching overbought conditions at 67.56, with their MACD primed to bullishly crossover in the coming days.
Recent trading volumes have been above average, showing that investors are confident in GREK at the moment, but they did dip under their 10 day moving average last week, indicating that the support was broken & may not be strong in the near-term.
Last week’s candlesticks had a few spinning tops, a large gap up on Thursday & a doji to close the week on Friday, which also hints at upcoming weakness on the horizon.
While they offer a 2.44% distribution yield to long-term holders, investors would be wise to have an options position for insurance against losses in the near-term, such as selling calls or buying puts, while watching their behavior at support levels.
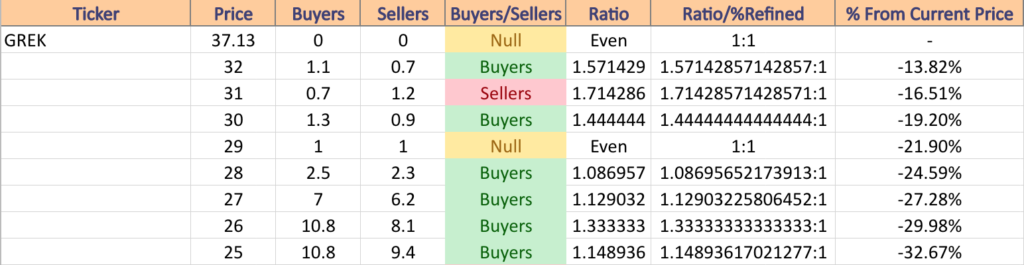
GREK has support at the $36.97 (Volume Sentiment: NULL, 0:0*), $36.39 (10 Day Moving Average; Volume Sentiment: NULL, 0:0*), $35.21 (Volume Sentiment: NULL, 0:0*), $33.75/share (50 Day Moving Average; Volume Sentiment: NULL, 0:0*), with resistance at the (11 year chart) $43.93 (Volume Sentiment: NULL, 0:0*), $46.86 (Volume Sentiment: NULL, 0:0*), $48.65 (Volume Sentiment: NULL, 0:0*) & $50.09/share (Volume Sentiment: NULL, 0:0*) price levels.
FTEC, the Fidelity MSCI Information Technology ETF has improved +36.04% over the past year, including a +51.57% gain since their 52-week low in September of 2022 (ex-distributions.)
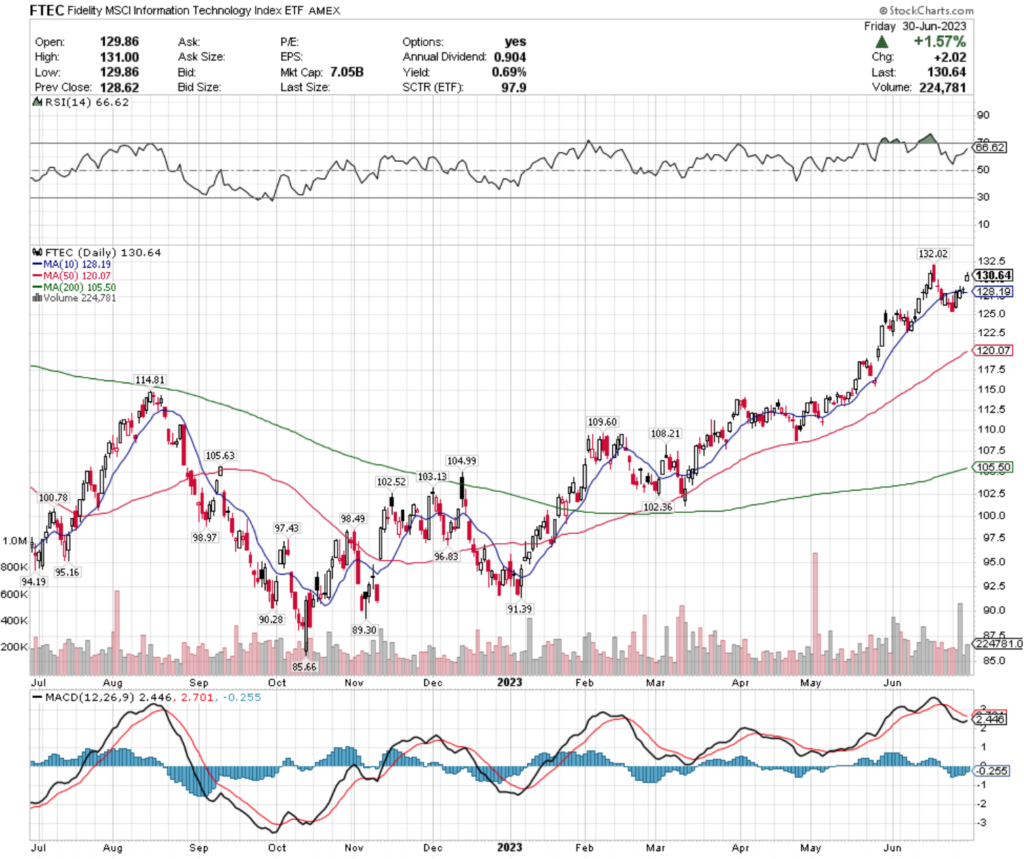
Their RSI is approaching overbought conditions at 66.62, with their MACD curling upwards looking to bullishly crossover.
Recent trading volumes have been about average, but last week’s candlesticks do not paint the rosiest of outlook pictures.
Most of the price action of the first three sessions of last week was centered around the bottom of each daily candles’ range, except for Tuesday whose real body was the majority of the candle, with small shadows on top & bottom, showing that prices favored being lower.
Thursday’s dragonfly doji followed by Friday’s +1.57% gap up & shooting star candlestick do not signal strength & the window created by the gap will be an interesting place to watch to see if it fills in in the near-term.
FTEC pays a modest 0.69% distribution yield to long-term shareholders, which provides limited cushion against losses, making it important to have some form of insurance using options in order to prevent near-term losses.
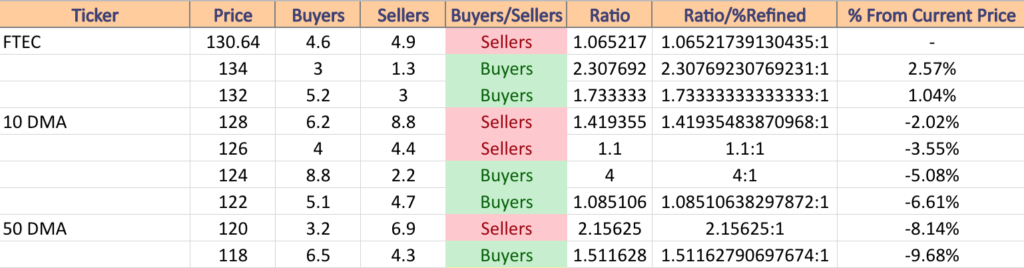
FTEC has support at the $128.19 (10 Day Moving Average; Volume Sentiment: Sellers, 1.42:1), $120.07 (Volume Sentiment: Sellers, 2.16:1)$114.81 (Volume Sentiment: Sellers, 1.12:1) & $109.60/share (Volume Sentiment: Buyers, 1.29:1) price levels, with resistance at the $132.02 (Volume Sentiment: Buyers, 1.73:1) & $136.37/share (2022; Volume Sentiment: NULL, 0:0*) price levels.
PAVE, the Global X U.S. Infrastructure Development ETF has added +38.22% over the past year, climbing +41.93% since their 52-week low in July of 2022 (ex-distributions).
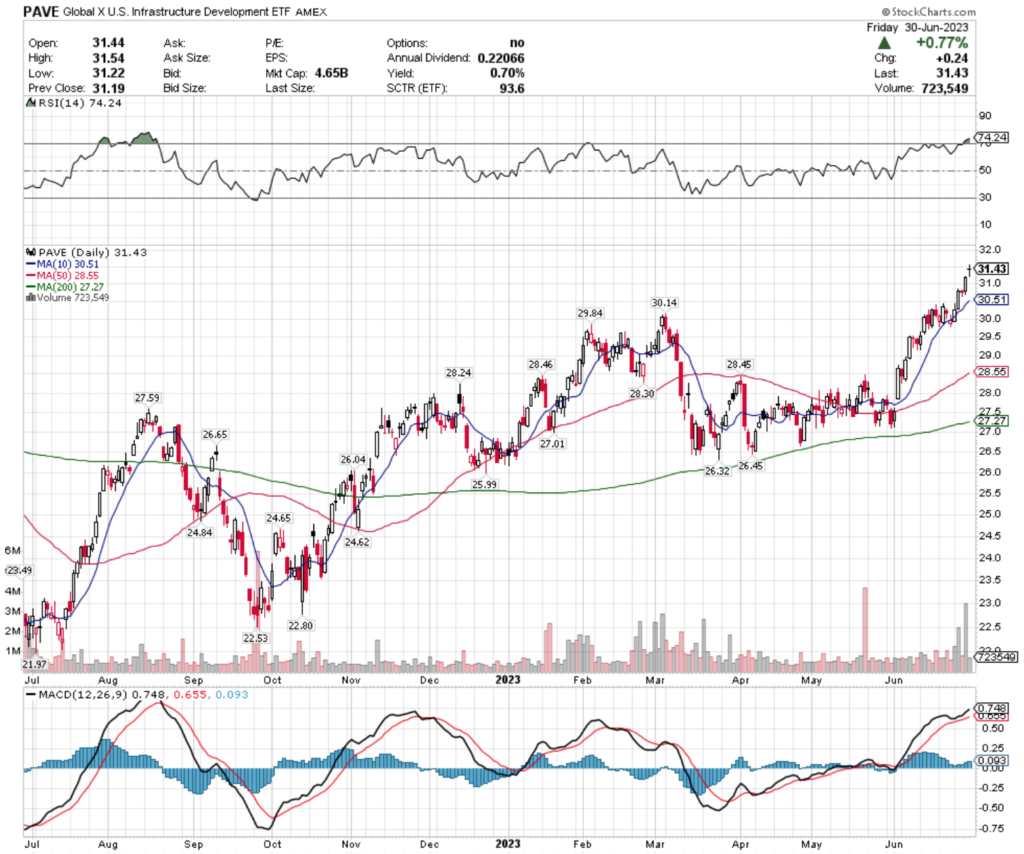
Their RSI is overbought at 74.24 & their MACD is bullish, after they spent late-May through June rallying ~14%.
Recent trading volumes have been above average compared to the year prior, confirming the rally in price.
There should be a near-term pullback in price, indicated by both the oscillators & Wednesday & Friday’s dragonfly doji candlesticks.
PAVE’s 0.7% distribution yield is not much in terms of protection against losses, so it would be wise to have an options strategy for loss protection up while waiting to see how they behave around support levels.
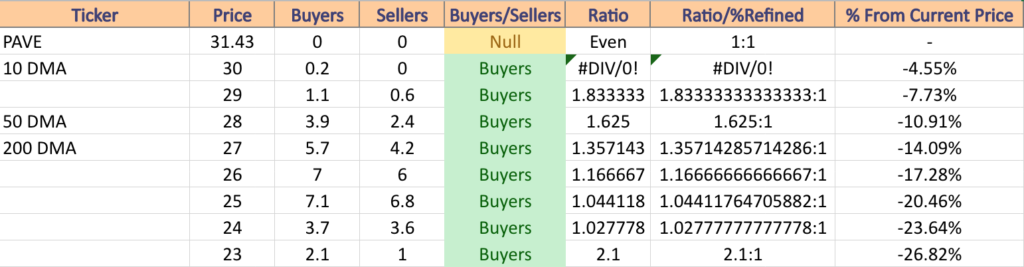
PAVE has support at the $30.51 (10 Day Moving Average; Volume Sentiment: Buyers, 0.2:0*), $30.14 (Volume Sentiment: Buyers, 0.2:0*), $29.84 (Volume Sentiment: Buyers, 1.83:1) & $28.46/share (Volume Sentiment: Buyers, 1.63:1) price levels, with no current resistance levels as they are at an all time high.
IDRV, the iShares Self Driving EV & Tech ETF has gained +14.18% over the past year, gaining +28.41% since their 52-week low in October of 2022 (ex-distributions).
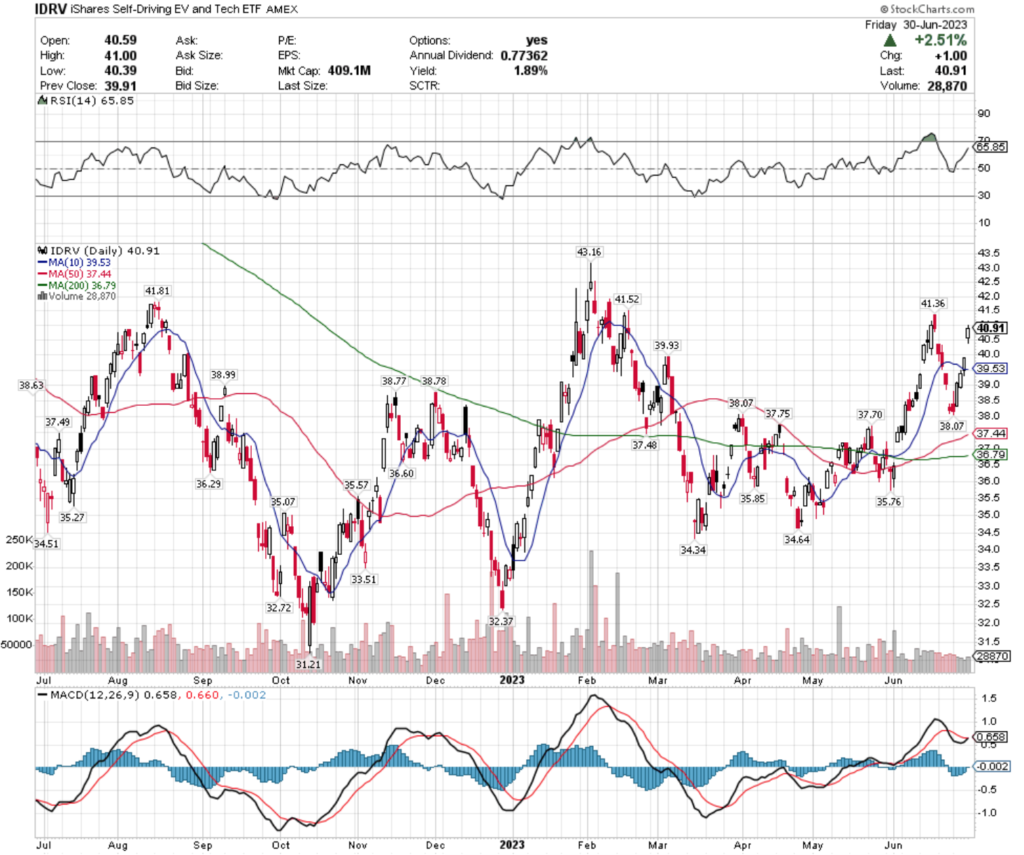
Their RSI is trending towards overbought at 65.85 & their MACD has recently bullishly crossed over.
Recent volumes have been below average compared to the year prior though, signaling that investors are becoming less enthusiastic about IDRV recently.
The 10 day moving average will be an important support level to watch in the coming week, especially once the window that resulted from Friday’s +2.51% gap up session begins to close.
IDRV pays a 1.89% distribution yield for long-term holders, which does not provide much protection against losses, making it important to have some form of an options strategy for insurance along with any open position.
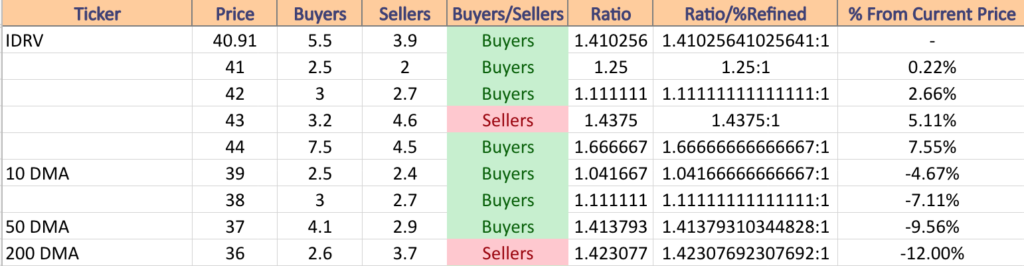
IDRV has support at the $39.93 (Volume Sentiment: Buyers, 1.04:1), $39.53 (10 Day Moving Average; Volume Sentiment: Buyers, 1.04:1), $38.99 (Volume Sentiment: Buyers, 1.11:1) & $38.78/share (Volume Sentiment: Buyers, 1.11:1) price levels, with resistance at the $41.36 (Volume Sentiment: Buyers, 1.25:1), $41.52 (Volume Sentiment: Buyers, 1.25:1), $41.81 (Volume Sentiment: Buyers, 1.25:1) & $43.16/share (Volume Sentiment: Sellers, 1.44:1) price levels.
Regional Banking (KRE), Tail Risk (TAIL), Global Agriculture (FTAG) & China (GXC) Are All Bearishly Lagging The Market
KRE, the SPDR S&P Regional Banking ETF has fallen -28.71% over the past year, losing -40.68% since their 52-week high in August of 2022, but has gained +18.28% since their 52-week low in May of 2023 (ex-distributions).
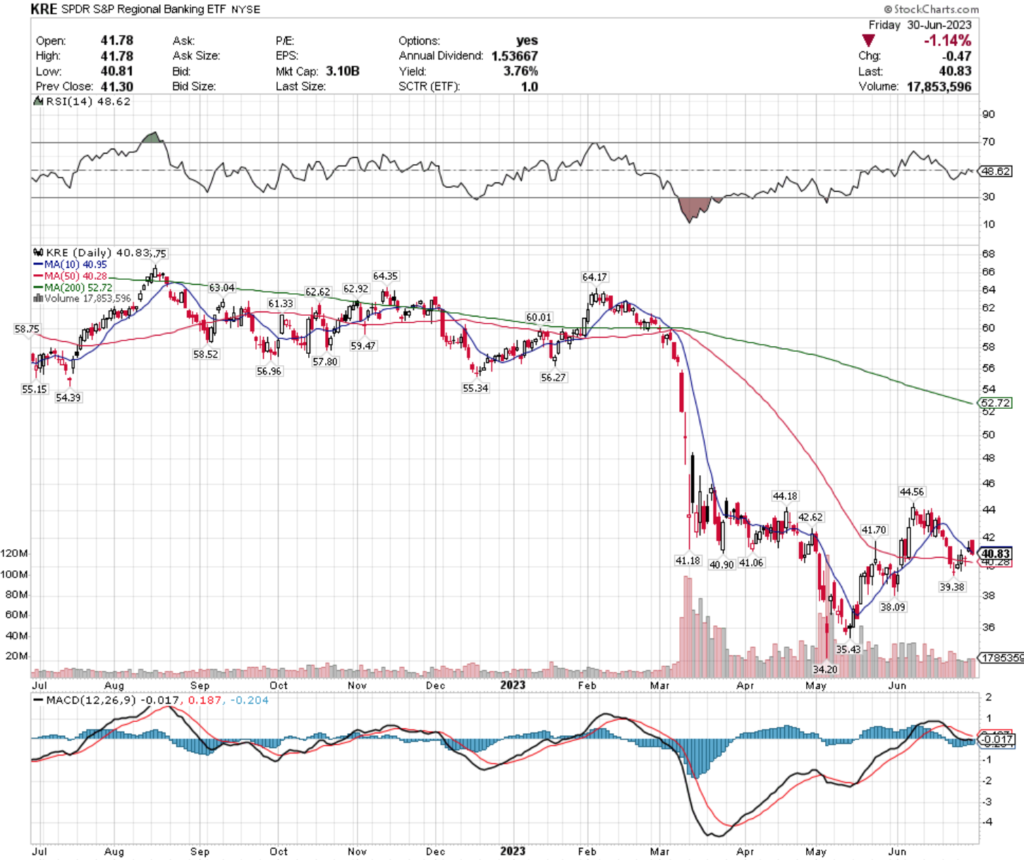
Their RSI is neutral at 48.62 & their MACD is looking to bullishly crossover in the coming sessions.
Recent trading volumes have been above average compared to the year prior, but Friday’s bearish engulfing candlestick hints at more downside risk on the horizon.
Last Monday kicked off with an inverted hammer candlestick, which signals a bullish reversal, but the top of the shadow will need to remain in tact after Friday’s close came close to it, breaking below the 10 day moving average, but remaining above the 50 day moving average.
KRE does offer a 3.76% distribution yield for long-term holders, but caution should be exercised in the near-term with KRE until they have established an uptrend from support levels.
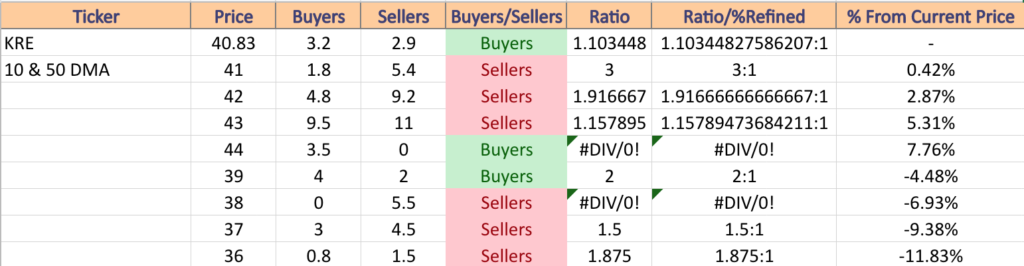
KRE has support at the $40.28 (50 Day Moving Average; Volume Sentiment: ), $39.38 (Volume Sentiment: ), $38.09 (Volume Sentiment: ) & $35.43/share (Volume Sentiment: ) price levels, with resistance at the $40.90 (Volume Sentiment: ), $40.95 (10 Day Moving Average; Volume Sentiment: ), $41.06 (Volume Sentiment: ) & $41.18/share (Volume Sentiment: ) price levels.
TAIL, the Cambria Tail Risk ETF has declined -20.6% over the past year, losing -24.72% from their 52-week high in July of 2022 & recently added +0.37% to their 52-week low in June of 2023 (ex-distributions).
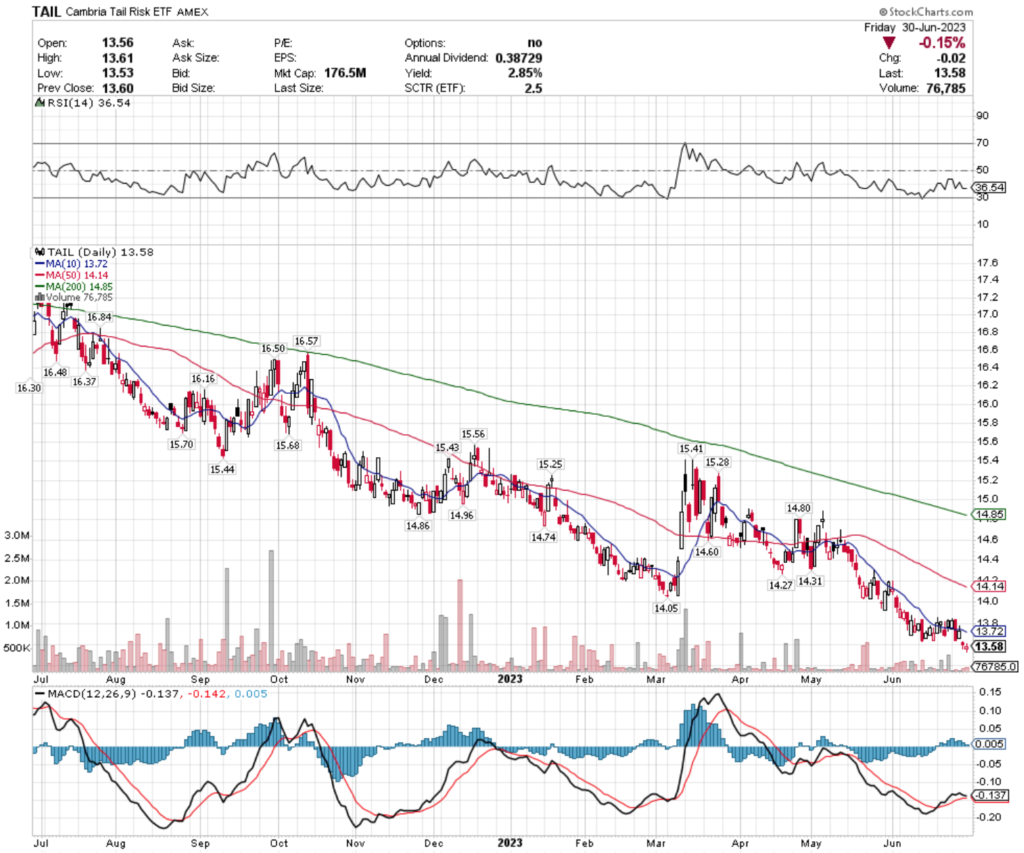
Their RSI is moving back towards oversold levels at 36.54, as their MACD is on the verge of a bearish crossover.
Recent trading volumes have been below average compared to the year prior, signaling investors are not overly confident in TAIL.
While they offer a 2.85% distribution yield for long-term holders, they’re currently trading at an all-time low, making that limited additional loss cushion still too risky until the price has begun to stabilize & trend back upwards.
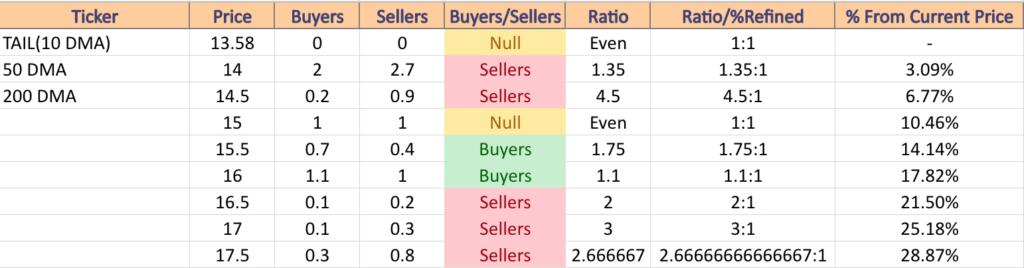
TAIL has no current support levels as it is at an all-time low & has resistance overhead at the $13.72 (10 Day Moving Average; Volume Sentiment: ), $14.05 (Volume Sentiment: ), $14.14 (50 Day Moving Average; Volume Sentiment: ) & $14.27/share (Volume Sentiment: ) price levels.
FTAG, the First Trust IndXX Global Agriculture ETF has lost -1.31% over the past year, falling -13.82% from their 52-week high in August of 2022, while improving +4.24% since their 52-week low in July of 2022 (ex-distributions).
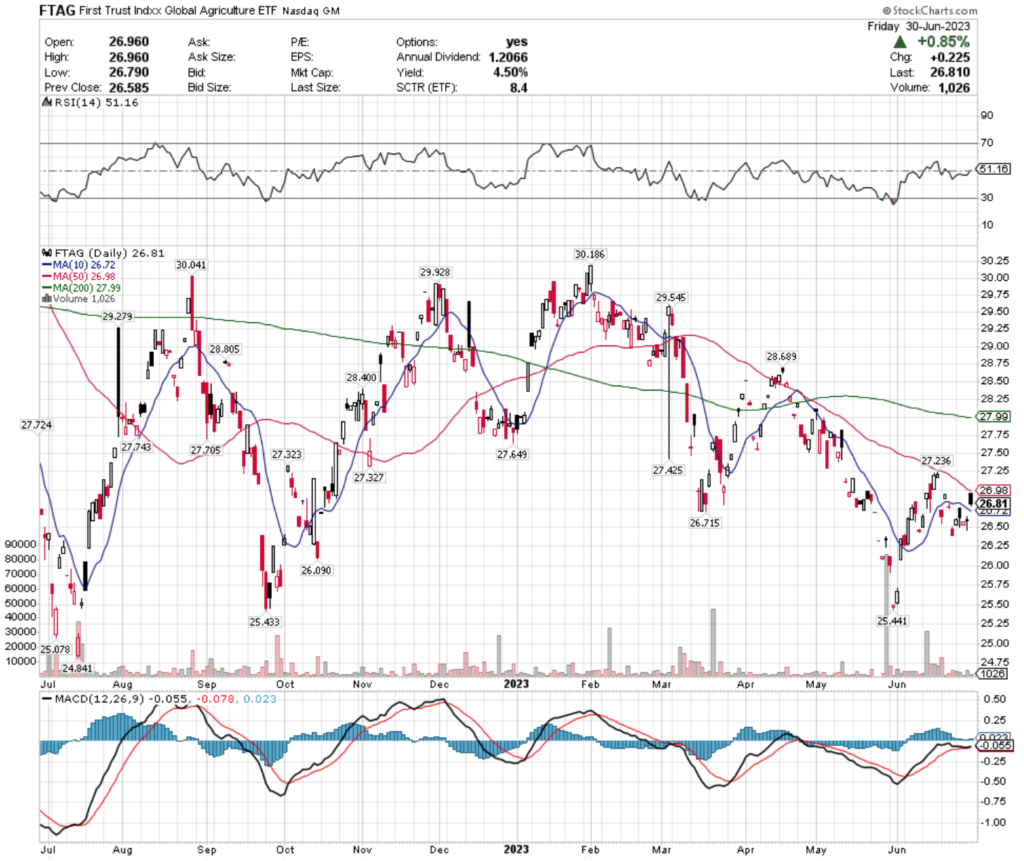
Their RSI is neutral at 51.16, with a flat MACD as their price sits between the 10 & 50 day moving averages.
Recent trading volumes have been lighter than average compared to the prior year, as investors are beginning to lack enthusiasm in FTAG’s price movements.
While Friday’s session was a +0.85% gap up, the candle is filled in as the price closed lower than it opened & with the shadow on the bottom of the candle there is still negative sentiment for FTAG.
They offer a 4.5% distribution yield for long-term holders, which does provide some cushion against losses, but it would be best to see which side they breakout & begin trending in in the near-term to mitigate risk.
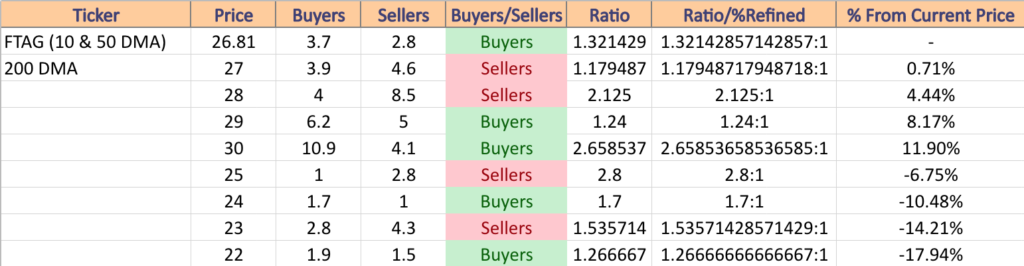
FTAG has support at the $26.72 (10 Day Moving Average & 2 Touch-points; Volume Sentiment: ), $26.09 (Volume Sentiment: ), $25.44 (Volume Sentiment: ) & $25.43/share (Volume Sentiment: ) price levels, with resistance at the $26.98 (50 Day Moving Average; Volume Sentiment: ), $27.24 (Volume Sentiment: ), $27.32 (Volume Sentiment: ) & $27.33/share (Volume Sentiment: ) price levels.
GXC, the SPDR S&P China ETF has shed -17.51% over the past year, dropping -20.25% since their 52-week high in July of 2022, but has recovered +22.3% since their 52-week low in October of 2022 (ex-distributions).
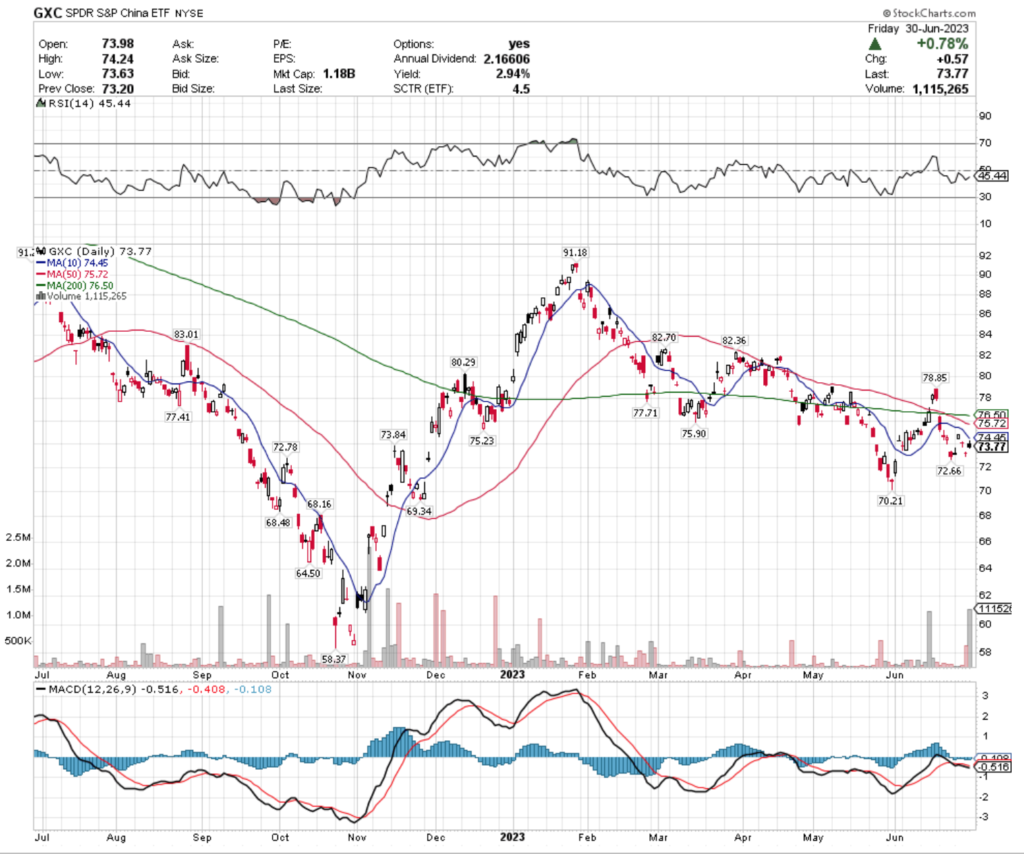
Their RSI is trending back towards neutral at 45.44, but their MACD is still currently bearish.
Recent volumes have been above average compared to the year prior, but not consistently which still indicates indecision among investors.
Two Friday’s ago closed in a hammer, which was followed by last Monday’s session with a gavestone doji mostly in the same range.
The rest of the week was marked by gappy trading up & down, with a couple of dragonfly dojis midweek, making the range that they were gapping around an interesting level to watch in the near-term.
They offer a 2.94% distribution yield, but investors should wait for them to establish a trend before starting or adding to an existing position.
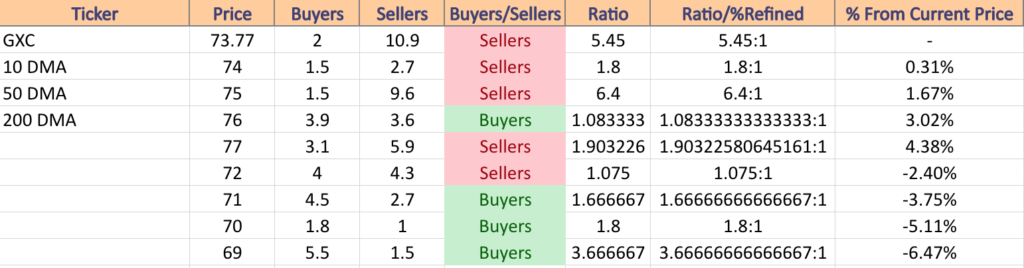
GXC has support at the $72.78 (Volume Sentiment: ), $72.66 (Volume Sentiment: ), $70.21 (Volume Sentiment: ) & $69.34/share (Volume Sentiment: ) price levels, with resistance overhead at the $73.84 (Volume Sentiment: ), $74.45 (10 Day Moving Average; Volume Sentiment: ), $75.23 (Volume Sentiment: ) & $75.72/share (50 Day Moving Average; Volume Sentiment: ) price levels.
Tying It All Together
Monday kicks off with ISM Manufacturing & Construction Spending data at 10 am before the markets close early for the Fourth of July.
Tuesday the markets will all be closed in observance of Fourth of July.
Wednesday begins with ADP Employment data at 8:15 am, followed by Factory Orders data at 10 am & at 2pm the Minutes of the Fed’s June FOMC Meeting are released.
On Thursday Initial Jobless Claims & the U.S. Trade Deficit data are reported at 8:30 am & at 10 am Job Openings & ISM Services data are set to be reported.
Levi Strauss will report earnings on Thursday.
The week concludes with the U.S. Employment Report, U.S. Unemployment Rate, U.S. Hourly Wages & Hourly Wages Year-over-Year data all coming out at 8:30 am on Friday.
AZZ is set to report earnings on Friday.
See you back here next week!
*** I DO NOT OWN SHARES OR OPTIONS CONTRACT POSITIONS IN SPY, QQQ, IWM, DIA, GREK, FTEC, PAVE, IDRV, KRE, TAIL, FTAG, or GXC AT THE TIME OF PUBLISHING THIS ARTICLE ***