Amazon.com Inc. stock trades under the ticker AMZN & has had a strong year, gaining +58.79% since their 52-week low in January of 2023.
AMZN is featured in a number of popular ETFs, including ONLN (23.84%), VCR (23.32%), XLY (22.82%), RTH (20.34%), IEDI (14.42%), FDIS (21.36%) & many more.
The Price:Volume analysis below seeks to display the volume at specific share-price levels from over the past one-to-two years & is intended to serve as a reference point for how investors viewed AMZN stock’s value at each level.
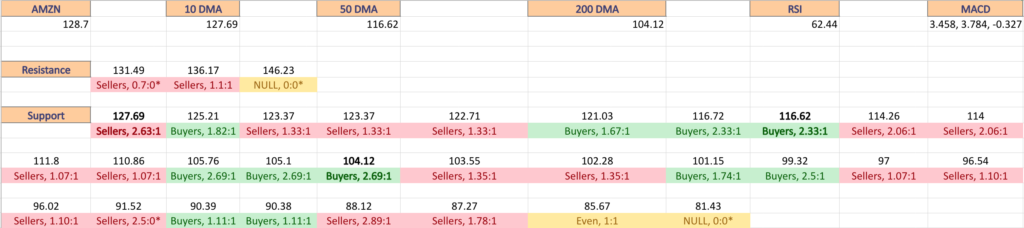
It also includes a list of moving averages, as well as support & resistance levels, which will be marked in bold.
Amazon.com Inc. AMZN Stock’s Price:Volume Sentiment Broken Down
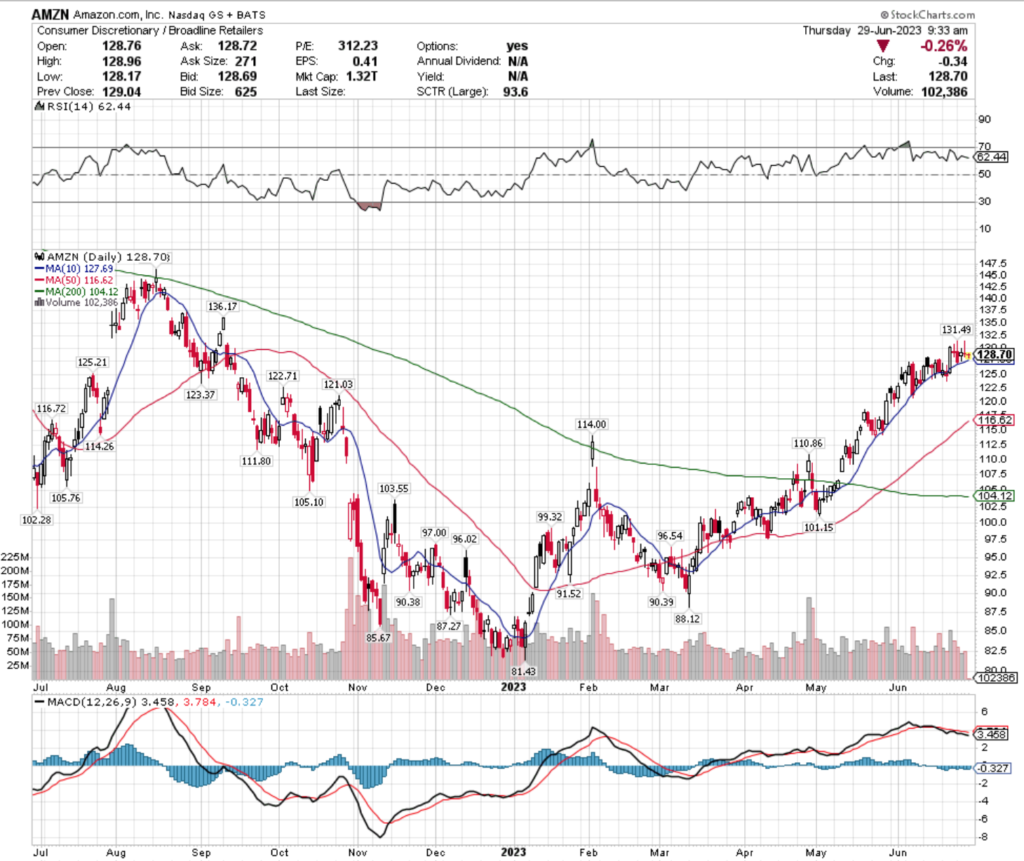
Using yesterday morning’s chart pictured above, AMZN’s RSI is currently trending back towards neutral from near overbought conditions at 62.44 & their MACD is currently trending bearishly after a recent consolidation period.
Recent trading volumes have been roughly average compared to the year prior, but their candlesticks are signaling hesitance by investors.
Friday of last week ended on a doji, with this week kicking off with a high upper shadow on a session that opened & closed on the lower ends of the candle.
Tuesday’s spinning top signaled further uncertainty, with Wednesday’s session resulting in a gravestone doji, hinting at a reversal being on the near-horizon.
The bold prices on the image below denote the moving average levels just listed & the bold entries in the list form of the analysis under the images include other levels of support.
Each corresponding price level using a ratio of Buyers:Sellers (or Sellers:Buyers), NULL values denote that there was not enough data, so the ratio would’ve been 0:0.
Ratios with a 0 for the denominator/constant are denoted with an *, but are reported as is, as we are accounting for volume/sentiment.
Also, as there is such a wide spread between many price levels having activity data, many of the levels are marked NULL, as there was limited volume data for them, and they were not included in the long list below unless they were relevant to support/resistance levels.
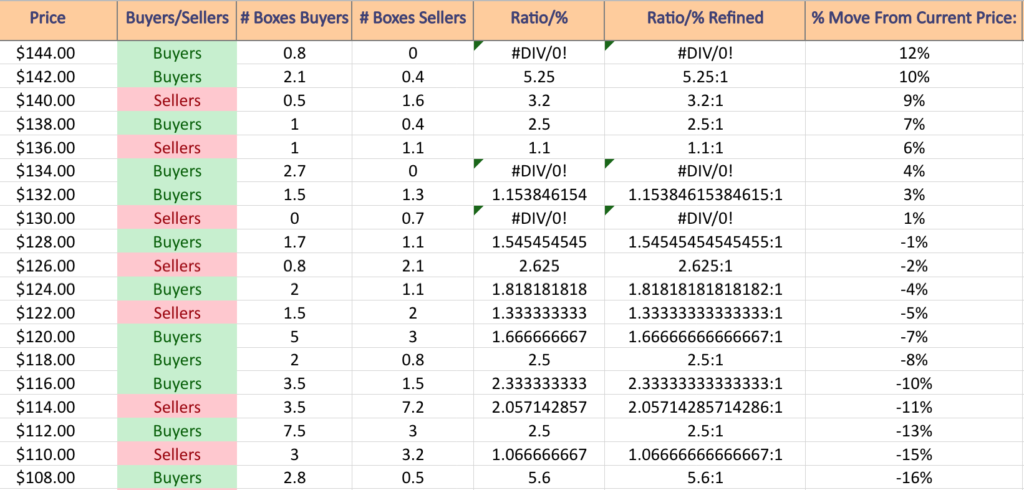
Amazon.com Inc. AMZN Stock’s Volume By Price Level
$144 – Buyers – 0.8:0*, 12% From Current Price Level
$142 – Buyers – 5.25:1, 10% From Current Price Level
$140 – Sellers – 3.2:1, 9% From Current Price Level
$138 – Buyers – 2.5:1, 7% From Current Price Level
$136 – Sellers – 1.1:1, 6% From Current Price Level
$134 – Buyers – 2.7:0*, 4% From Current Price Level
$132 – Buyers – 1.15:1, 3% From Current Price Level
$130 – Sellers – 0.7:0*, 1% From Current Price Level
$128 – Buyers – 1.55:1, -1% From Current Price Level
$126 – Sellers – 2.63:1, -2% From Current Price Level
$124 – Buyers – 1.82:1, -4% From Current Price Level
$122 – Sellers – 1.33:1, -5% From Current Price Level
$120 – Buyers – 1.67:1, -7% From Current Price Level
$118 – Buyers – 2.5:1, -8% From Current Price Level
$116 – Buyers – 2.33:1, -10% From Current Price Level
$114 – Sellers – 2.06:1, -11% From Current Price Level
$112 – Buyers – 2.5:1, -13% From Current Price Level
$110 – Sellers – 1.07:1, -15% From Current Price Level
$108 – Buyers – 5.6:1, -16% From Current Price Level
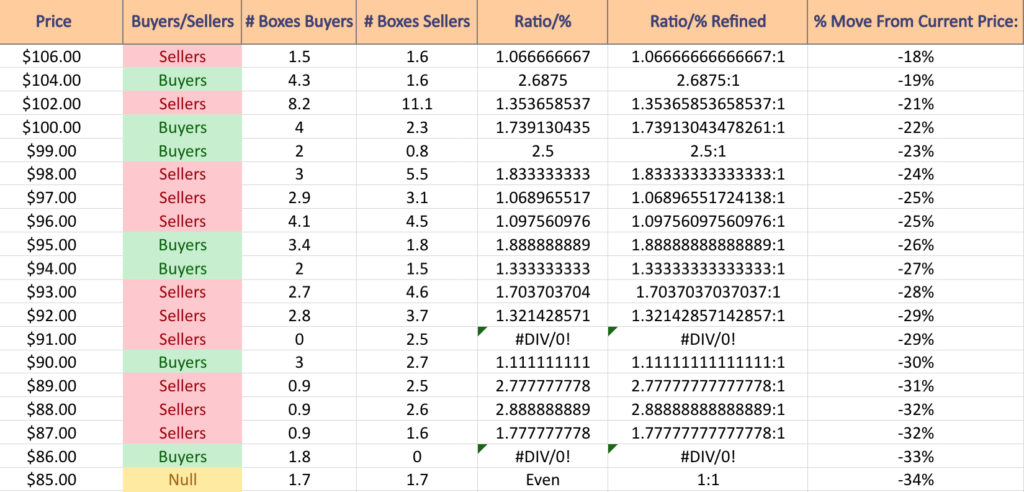
$106 – Sellers – 1.07:1, -18% From Current Price Level
$104 – Buyers – 2.69:1, -19% From Current Price Level
$102 – Sellers – 1.35:1, -21% From Current Price Level
$100 – Buyers – 1.74:1, -22% From Current Price Level
$99 – Buyers – 2.5:1, -23% From Current Price Level
$98 – Sellers – 1.83:1, -24% From Current Price Level
$97 – Sellers – 1.07:1, -25% From Current Price Level
$96 – Sellers – 1.10:1, -26% From Current Price Level
$95 – Buyers – 1.89:1, -26% From Current Price Level
$94 – Buyers – 1.33:1, -27% From Current Price Level
$93 – Sellers – 1.70:1, -28% From Current Price Level
$92 – Sellers – 1.32:1, -29% From Current Price Level
$91 – Sellers – 2.5:0*, -29% From Current Price Level
$90 – Buyers – 1.11:1, -30% From Current Price Level
$89 – Sellers – 2.78:1, -31% From Current Price Level
$88 – Sellers – 2.89:1, -32% From Current Price Level
$87 – Sellers – 1.78:1, -32% From Current Price Level
$86 – Buyers – 1.8:0*, -33% From Current Price Level
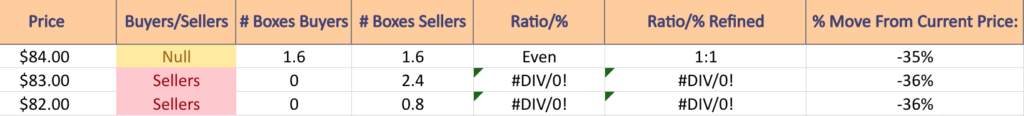
$85 – Even – 1:1, -34% From Current Price Level
$84 – Even – 1:1, -35% From Current Price Level
$83 – Sellers – 2.4:0*, -36% From Current Price Level
$82 – Sellers – 0.8:0*, -36% From Current Price Level
Tying It All Together
The list & image above paint the picture as to how investors & traders have behaved at various price levels that AMZN has been at over the past one-to-two years.
It is not meant to serve as investment/trading advice, and is simply a way to visualize what investor/trader sentiment has been like at each of the price levels mentioned, as well as what it was at levels of support & resistance that are denoted in the image & list.
As always, do your own due diligence before making investing/trading decisions.
For more on the methodology on how the data was collected & put together, please refer to our original Price:Volume analysis.
*** I DO NOT OWN SHARES OR OPTIONS CONTRACT POSITIONS IN AMZN AT THE TIME OF PUBLISHING THIS ARTICLE ***