DR Horton Inc. stock has recently reached a new all-time high as the homebuilders, construction & supplies industries have been booming in 2023.
DHI stock has gained +90.3% from their 52-week low in June of 2022 (ex-dividends).
They are a member of many popular ETFs, including ITB (15.25%), NAIL (9.47%), PKB (5.01%), XHB (3.86%), QMOM (2.12%) & others.
The Price:Volume analysis seeks to display the volume at specific share-price levels from over the past one-to-two years & is intended to serve as a reference point for how investors viewed DHI stock’s value at each level.
It also includes a list of moving averages, as well as support & resistance levels, which will be marked in bold.
DR Horton Inc. DHI Stock’s Price:Volume Sentiment Broken Down
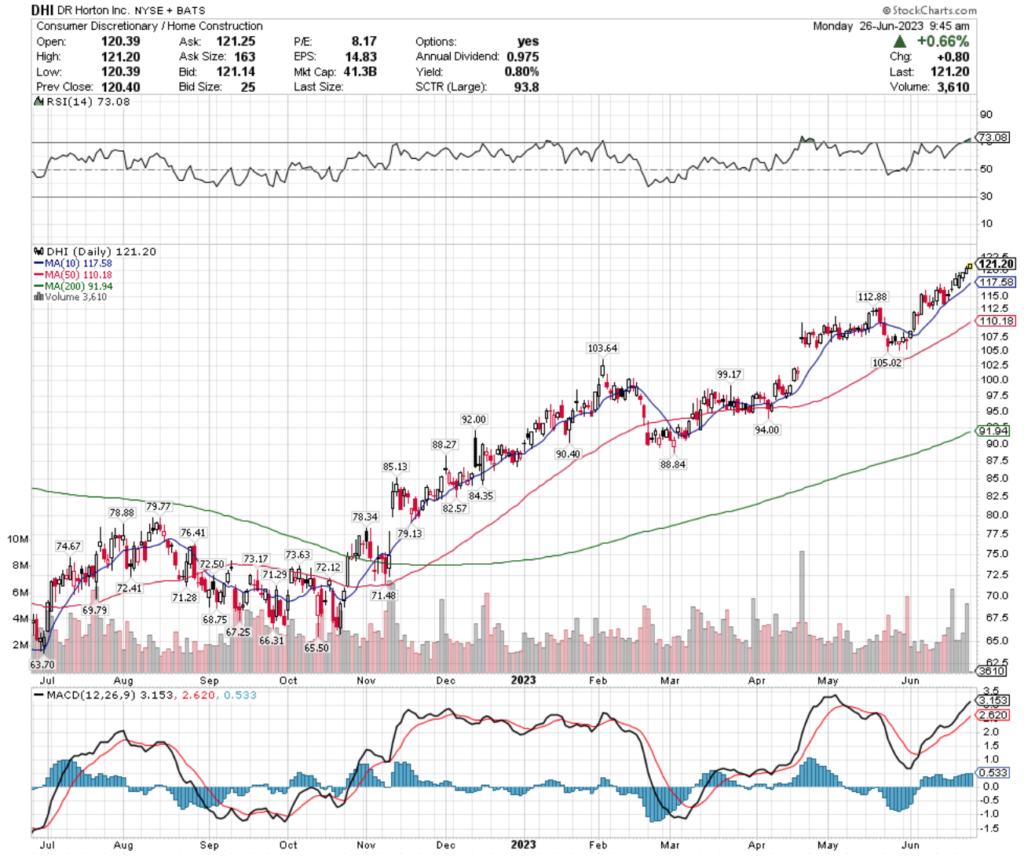
Their RSI is currently overbought at 73.08 & their MACD is in a bullish uptrend after the past week & a half of consistent positive days.
Recent trading volumes have been about average compared to the year prior, but they have fluctuated each day, as investors likely rotated capital into DHI while the broader market was having a difficult week.
Their candlesticks from last week do not indicate that the bull run is going to continue for long, as last Monday kicked off with a gravestone doji after the prior week closed on a spinning top & Tuesday’s candle was a shooting star that was engulfed by the following day’s candle.
The three candles since then have all been relatively concentrated around the same price range, but climbing incrementally, which does not suggest that there is much more near-term strength left in the eyes of market participants & enthusiasm is beginning to wane/profits are being taken.
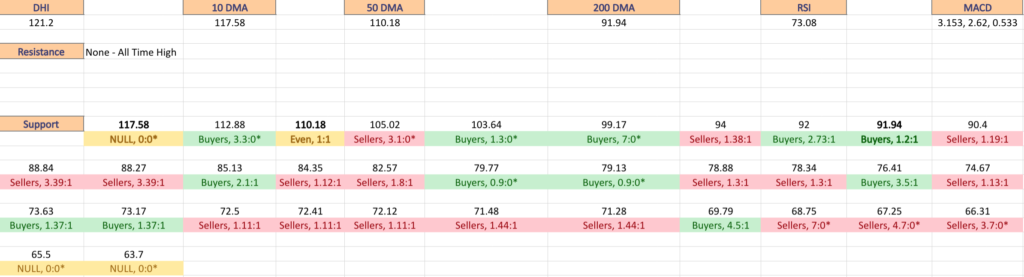
The bold prices on the image below denote the moving average levels just listed & the bold entries in the list form of the analysis under the images include other levels of support (there is no data for their resistance levels as they are at an all time high).
Each corresponding price level using a ratio of Buyers:Sellers (or Sellers:Buyers), NULL values denote that there was not enough data, so the ratio would’ve been 0:0.
Ratios with a 0 for the denominator/constant are denoted with an *, but are reported as is, as we are accounting for volume/sentiment.
Also, as there is such a wide spread between many price levels having activity data, many of the levels are marked NULL, as there was limited volume data for them, and they were not included in the long list below unless they were relevant to support/resistance levels.
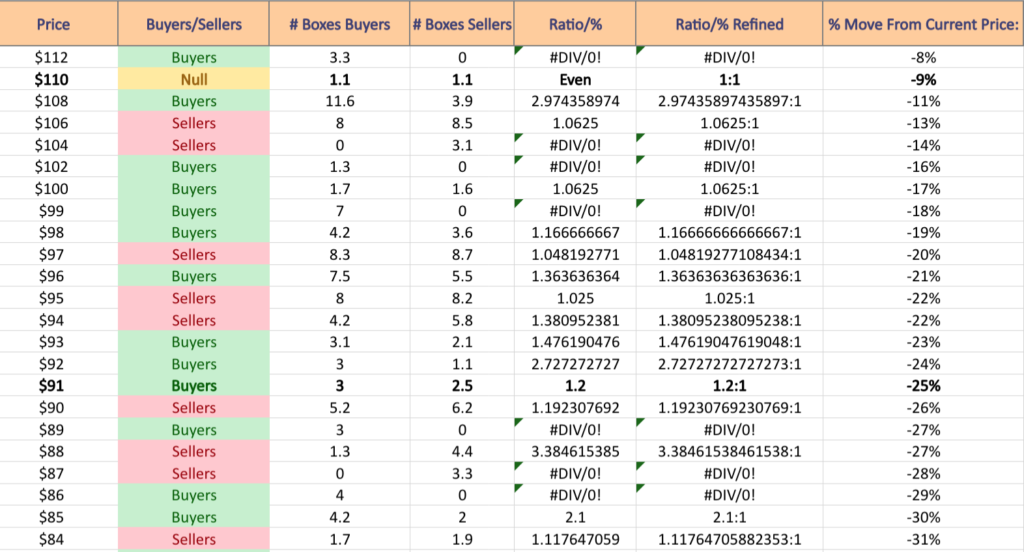
DR Horton Inc. DHI Stock’s Volume By Price Level
$112 – Buyers – 3.3:0*, -8% From Current Price
$110 – NULL/Even – 1:1, -9% From Current Price – 50 Day Moving Average
$108 – Buyers – 2.97:1, -11% From Current Price
$106 – Sellers – 1.06:1, -13% From Current Price
$104 – Sellers – 3.1:0*, -14% From Current Price
$102 – Buyers – 1.3:0*, -16% From Current Price
$100 – Buyers – 1.06:1, -17% From Current Price
$99 – Buyers – 7:0*, -18% From Current Price
$98 – Buyers – 1.17:1, -19% From Current Price
$97 – Sellers – 1.05:1, -20% From Current Price
$96 – Buyers – 1.36:1, -21% From Current Price
$95 – Sellers – 1.03:1, -22% From Current Price
$94 – Sellers – 1.38:1, -22% From Current Price
$93 – Buyers – 1.48:1, -23% From Current Price
$92 – Buyers – 2.73:1, -24% From Current Price
$91 – Buyers, 1.2:1, -25% From Current Price, 200 Day Moving Average
$90 – Sellers, 1.19:1, -26% From Current Price
$89 – Buyers – 3:0*, -27% From Current Price
$88 – Sellers – 3.39:1, -27% From Current Price
$87 – Sellers – 3.3:0*, -28% From Current Price
$86 – Buyers – 4:0*, -29% From Current Price
$85 – Buyers – 2.1:1, -30% From Current Price
$84 – Sellers – 1.12:1, -31% From Current Price
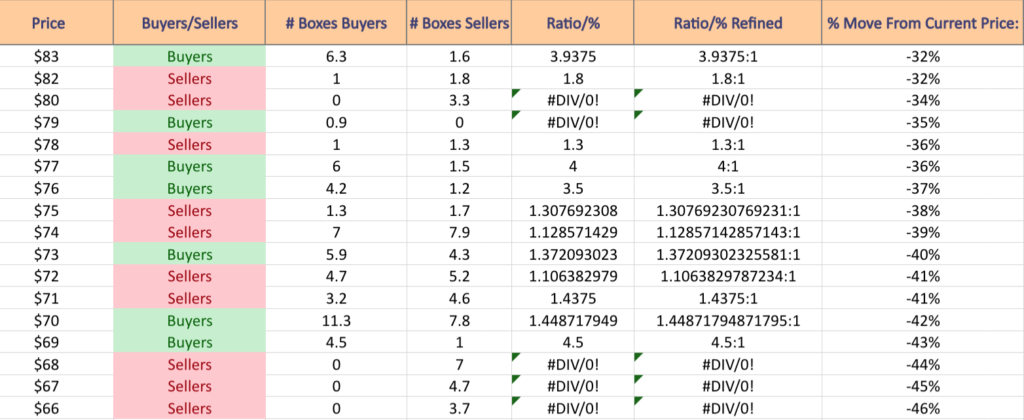
$83 – Buyers – 3.94:1, -32% From Current Price
$82 – Sellers – 1.8:1, -32% From Current Price
$80 – Sellers – 3.3:0*, -34% From Current Price
$79 – Buyers – 0.9:0*, -35% From Current Price
$78 – Sellers – 1.3:1, -36% From Current Price
$77 – Buyers – 4:1, -36% From Current Price
$76 – Buyers – 3.5:1, -37% From Current Price
$75 – Sellers – 1.31:1, -38% From Current Price
$74 – Sellers – 1.13:1, -39% From Current Price
$73 – Buyers – 1.37:1, -40% From Current Price
$72 – Sellers – 1.11:1, -41% From Current Price
$71 – Sellers – 1.44:1, -41% From Current Price
$70 – Buyers – 1.45:1, -42% From Current Price
$69 – Buyers – 4.5:1, -43% From Current Price
$68 – Sellers – 7:0*, -44% From Current Price
$67 – Sellers – 4.7:0*, -45% From Current Price
$66 – Sellers – 3.7:0*, -46% From Current Price
Tying It All Together
The list & image above paint the picture as to how investors & traders have behaved at various price levels that DHI has been at over the past one-to-two years.
It is not meant to serve as investment/trading advice, and is simply a way to visualize what investor/trader sentiment has been like at each of the price levels mentioned, as well as what it was at levels of support & resistance that are denoted in the image & list.
As always, do your own due diligence before making investing/trading decisions.
For more on the methodology on how the data was collected & put together, please refer to our original Price:Volume analysis.
*** I DO NOT OWN SHARES OR OPTIONS CONTRACT POSITIONS IN DHI AT THE TIME OF PUBLISHING THIS ARTICLE ***