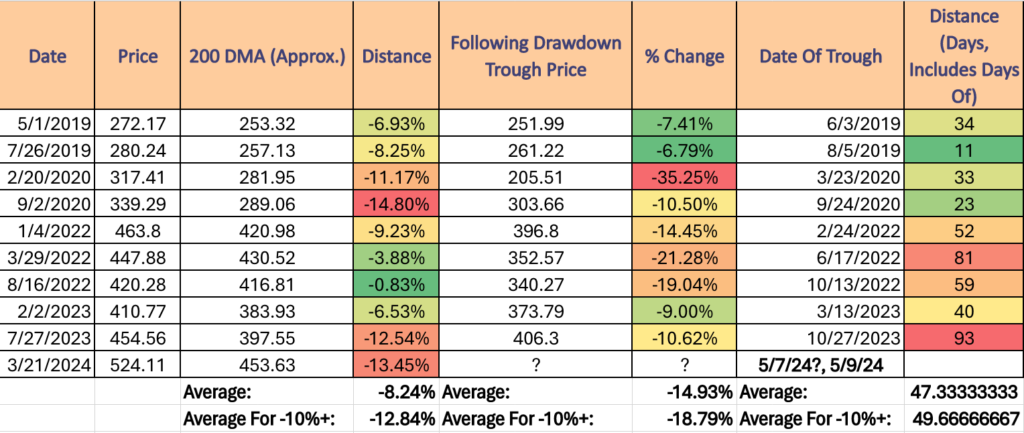
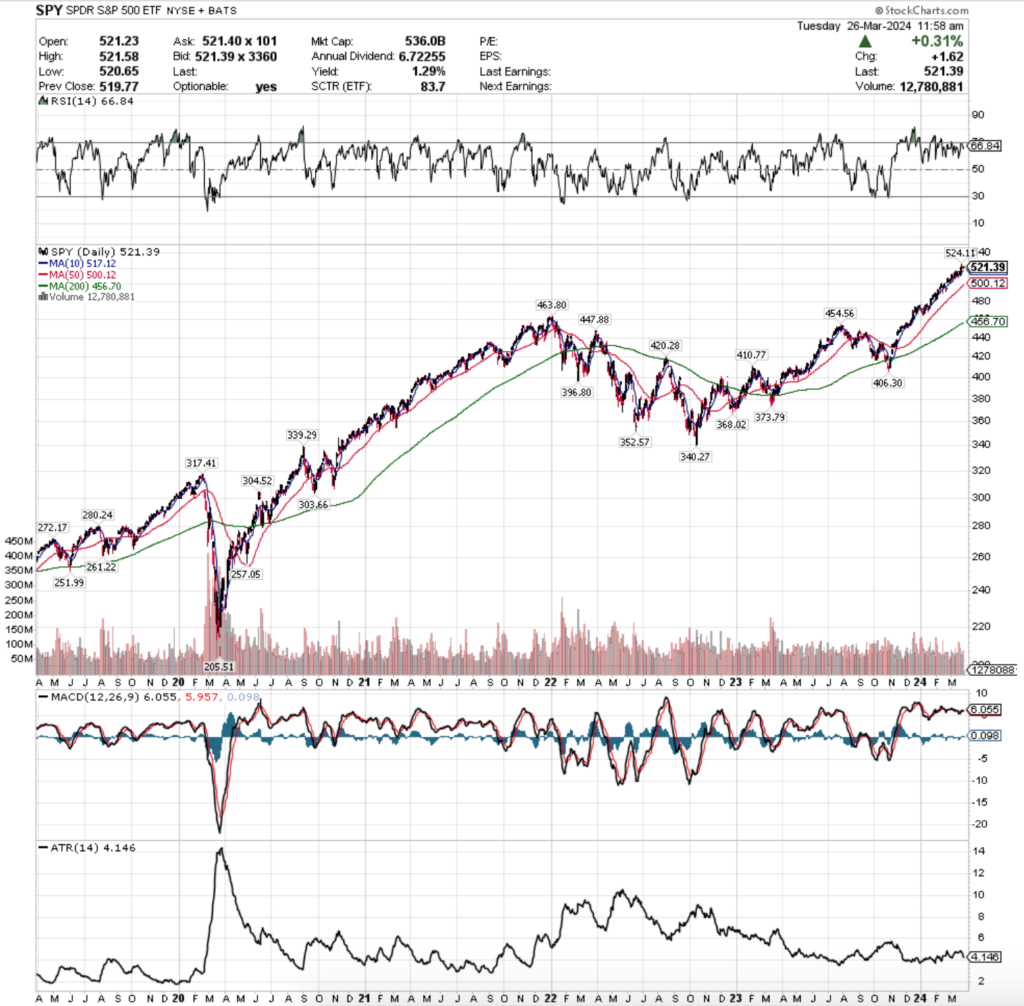
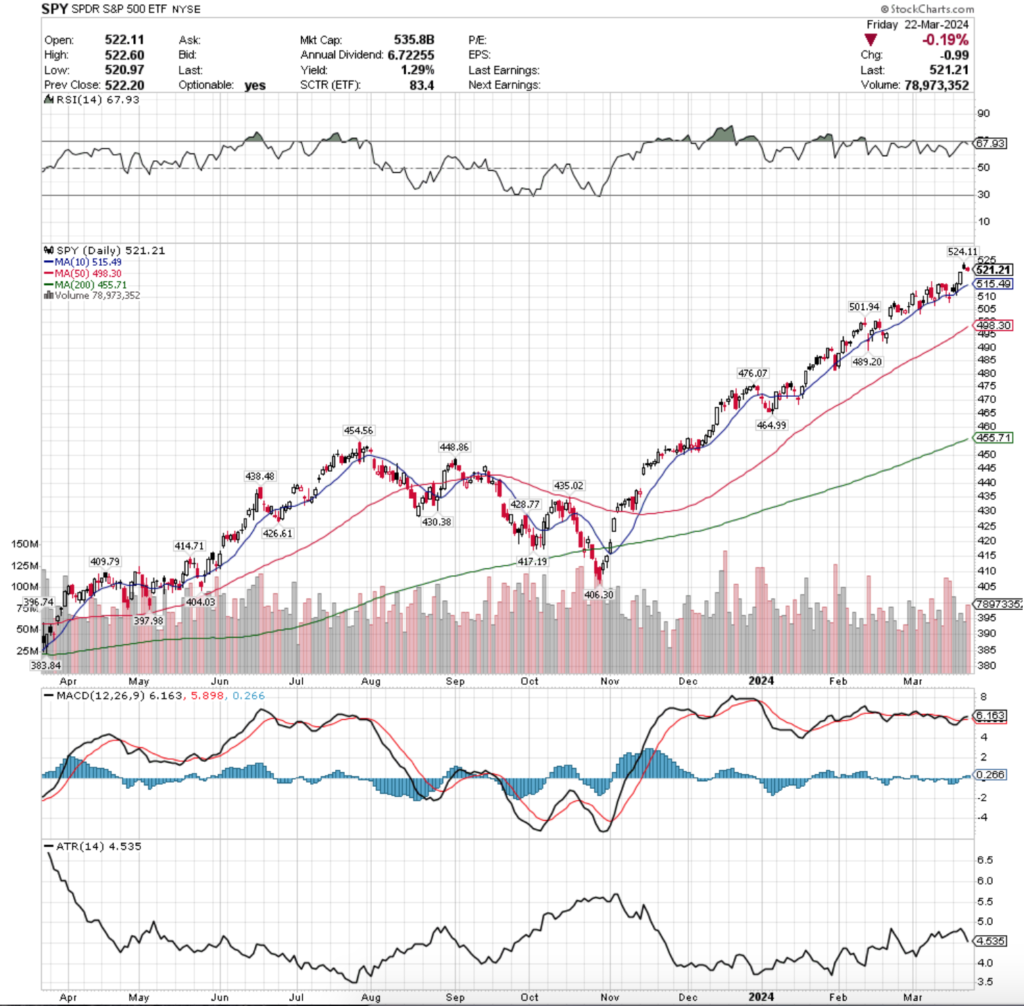
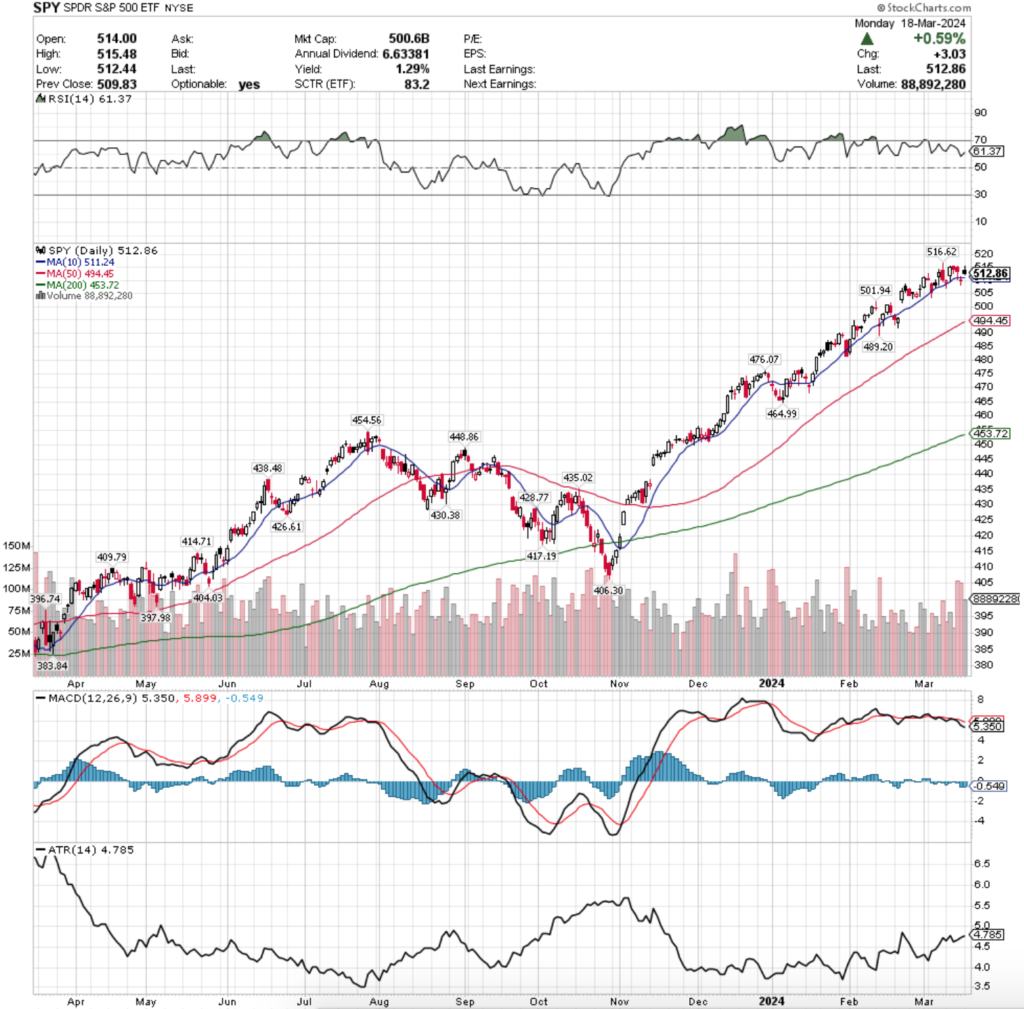
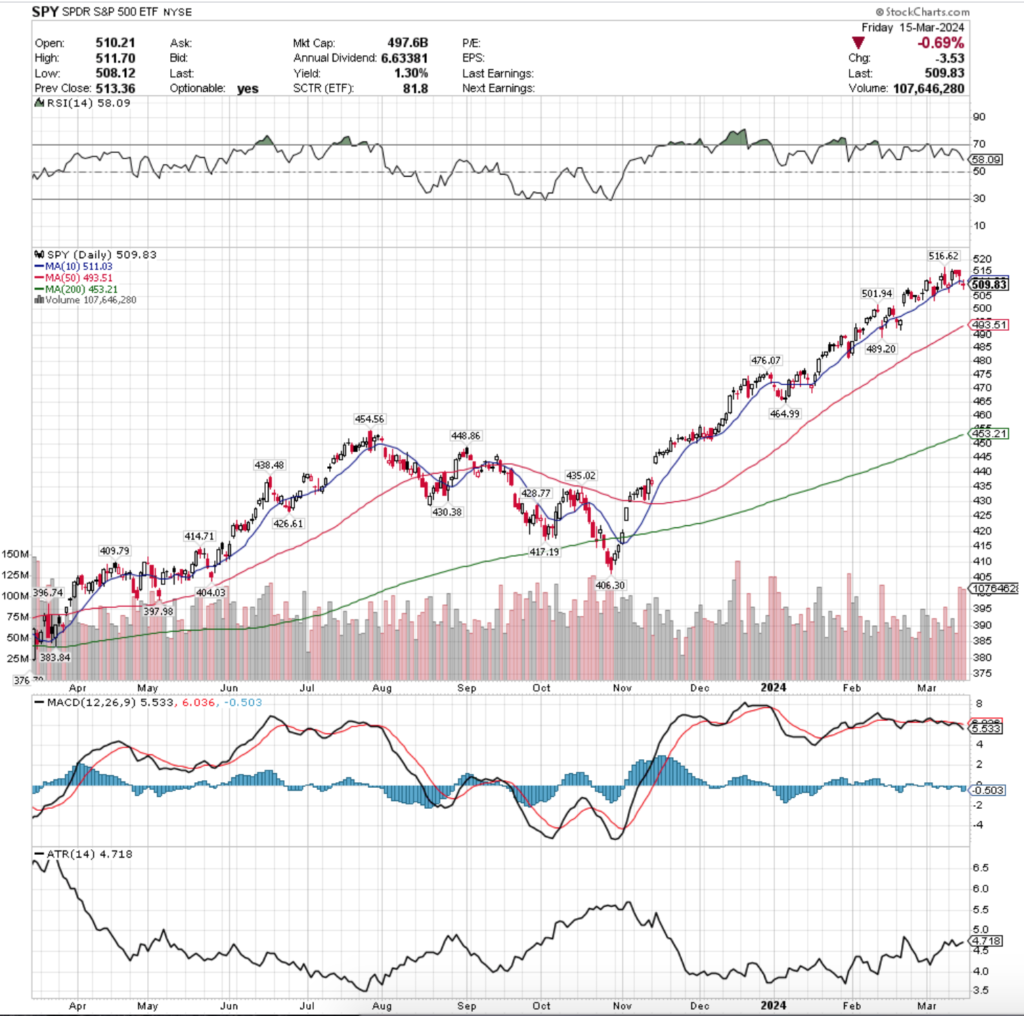
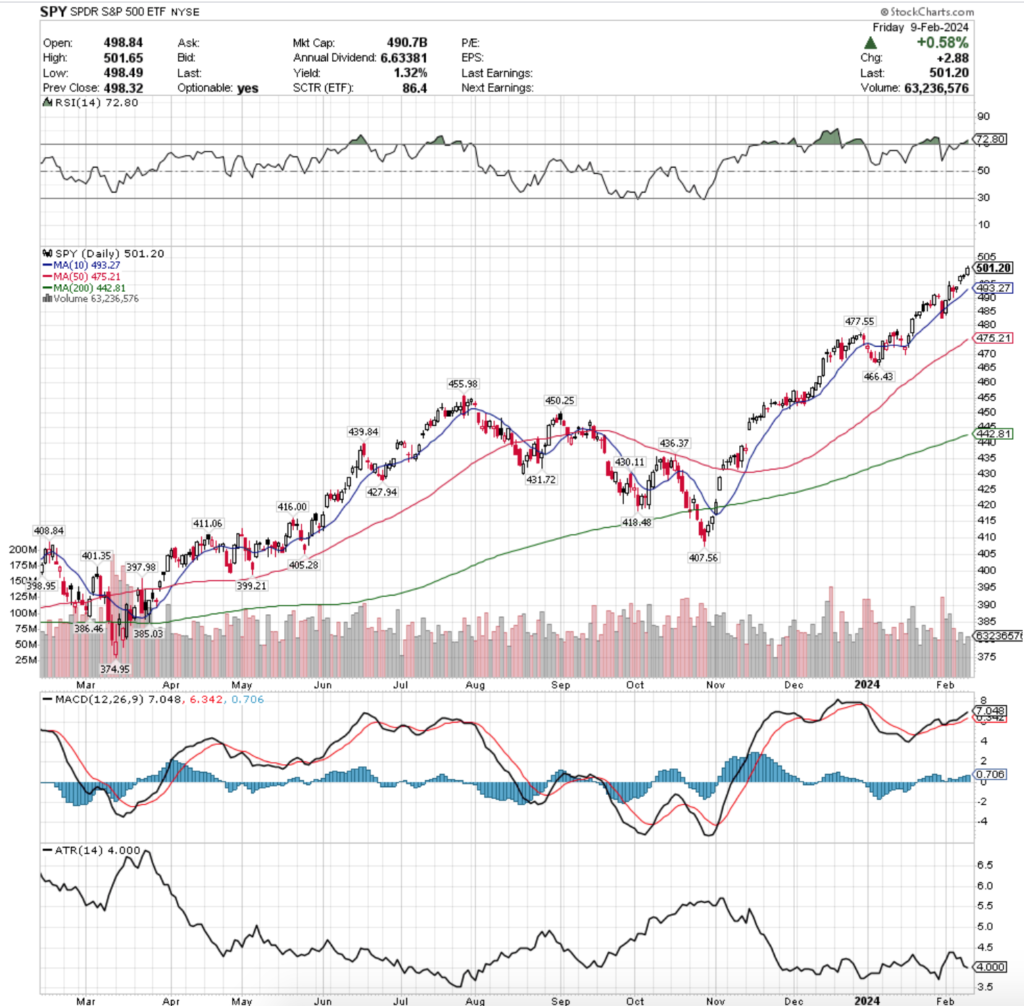
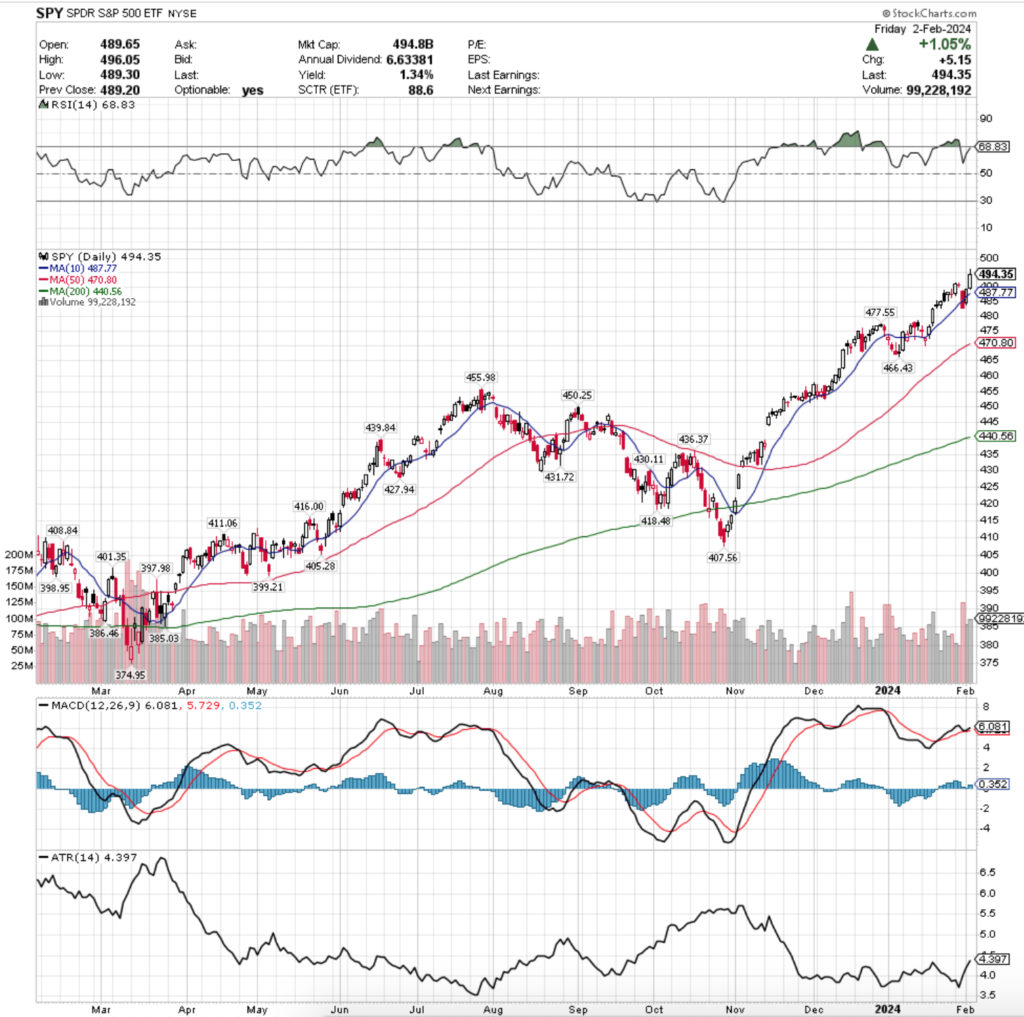
SPY, the SPDR S&P 500 ETF remained relatively flat this past week, adding +0.18% week-over-week at Thursday’s close (Friday the market was closed for celebration of Good Friday).
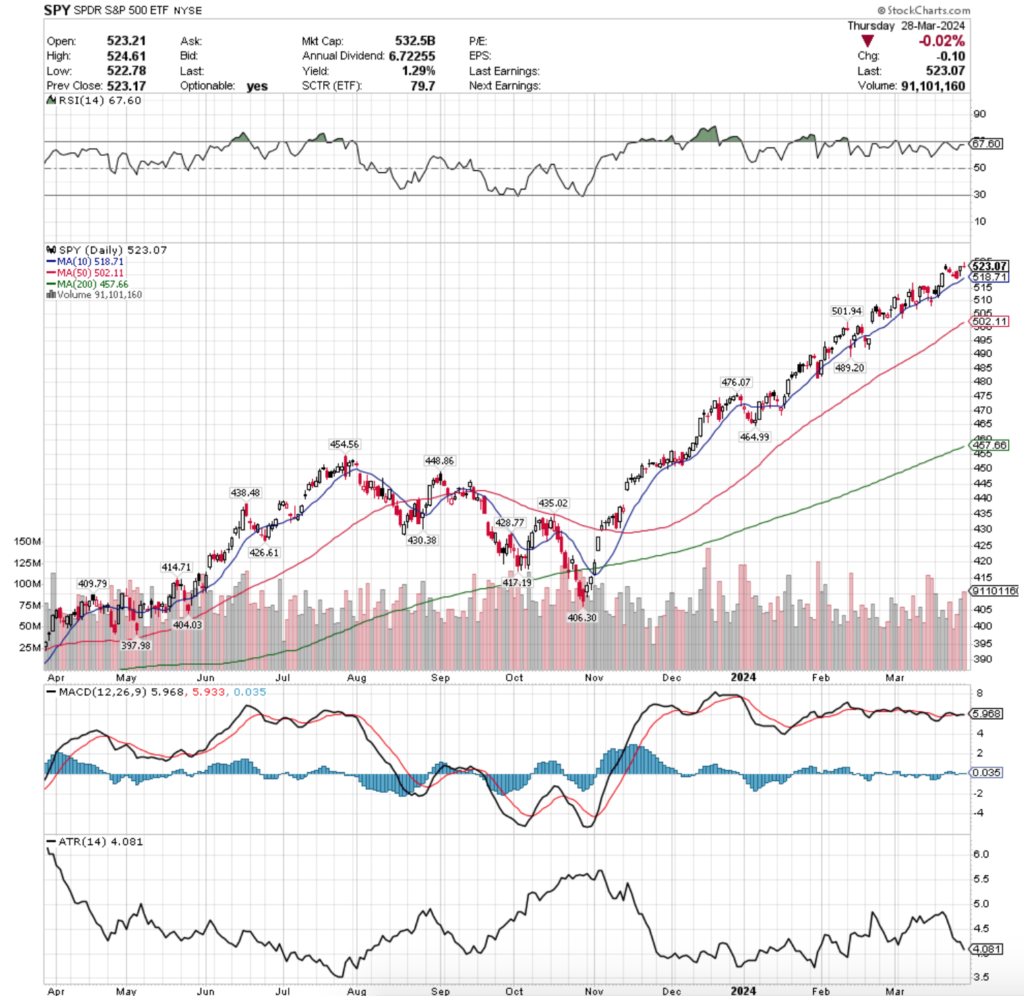
Their RSI has recently flattened out in the wake of the past few days’ consolidation, coupled with the last two days of the week remaining flat, but sits near the bounds of overbought territory at 67.6, while their MACD is bullish, but muted due to the same reasons as the RSI.
Volumes were -5.82% below average last week compared to the year prior (73,299,775 vs. 77,829,780), in a week that was marked by declining volume on narrow range trading sessions.
Monday kicked the week off on very light volume in a declining session, followed by Tuesday where we saw a slight uptick in volume & a wider trading range, as Tuesday’s candle formed a bearish engulfing pattern with Monday’s doji.
However, the doji’s uncertainty ruled the day on Thursday as SPY advanced on what became the second highest volume of the week, but was unable to touch the 52-week & all-time high that was set the previous Thursday.
Thursday’s candle was also a hanging man, as the real body is concentrated in the upper third of the session, while the lower ~60% of the candle is in the lower shadow & it came in the wake of a three day decline.
The lower shadow shows that for the day at least market participants were favoring higher values on SPY, as the open was on the high end of the candle & the close was above the open, despite testing lower during the day.
Friday’s session brought back the theme of uncertainty though, as the highest volume day of the week came off of a -0.02% declining session, where a minor gap up resulted in a gravestone doji for the day, showing outright uncertainty among investors.
For a day with limited price action there was a lot of volume, signaling that a lot of market participants are unsure about the near-term future & wanted to not be holding any risk going into the weekend, after rejecting the higher prices that it moved to throughout the day shown by the upper shadow.
Next week it will be important to keep an ear to what the many Fed speakers that are lined up to speak (detailed in the next section), as that will likely be one of the leading forces at play in determining SPY’s direction next week.
SPY’s 10 DMA will also be an area to keep an eye on, currently ~1% from their closing price on Thursday, as the next nearest level of support is ~4% from Thursday’s close (50 DMA).
Their Average True Range is still declining due to a lack of meaningful volatility (the early week declines were modest) & watching for an uptick in their ATR will be helpful for identifying if there is going to be weakness coming in the near-term.
At such high price levels a sudden uptick in volatility will likely queue some type of at least minor selloff/consolidation move as market participants will be quick to protect profits & take them off of the table.
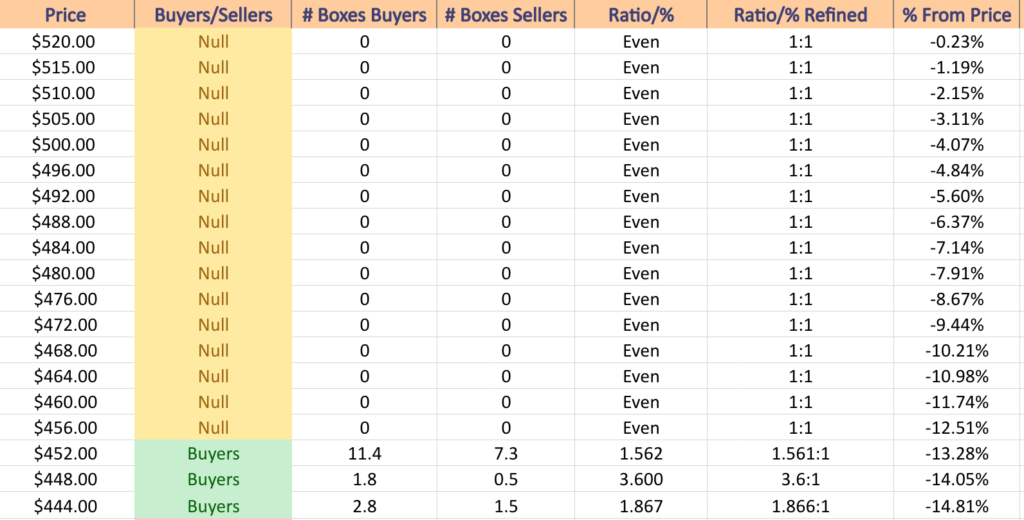
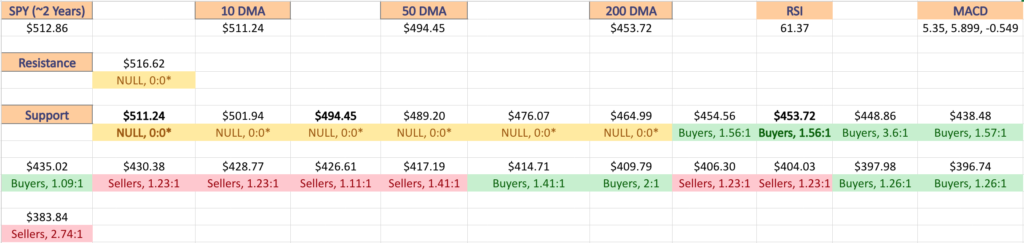
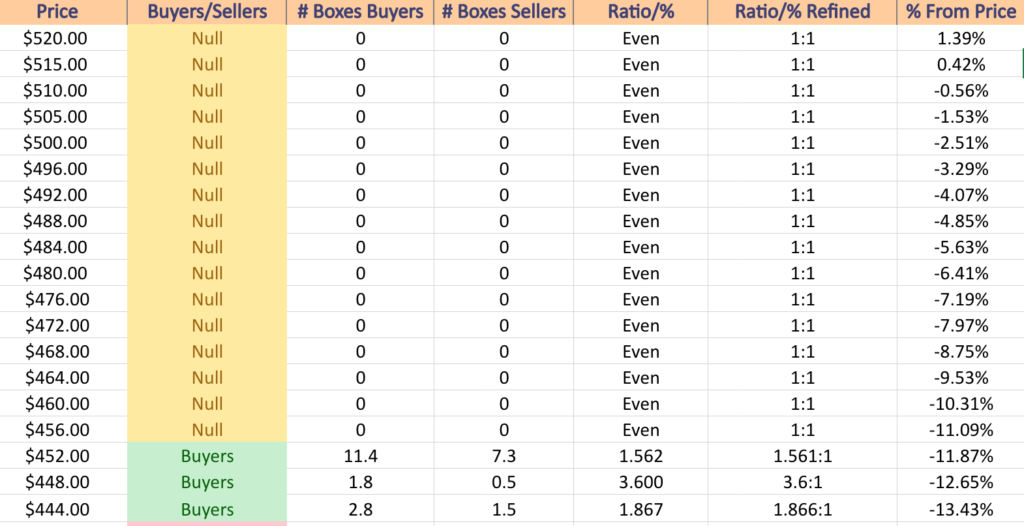
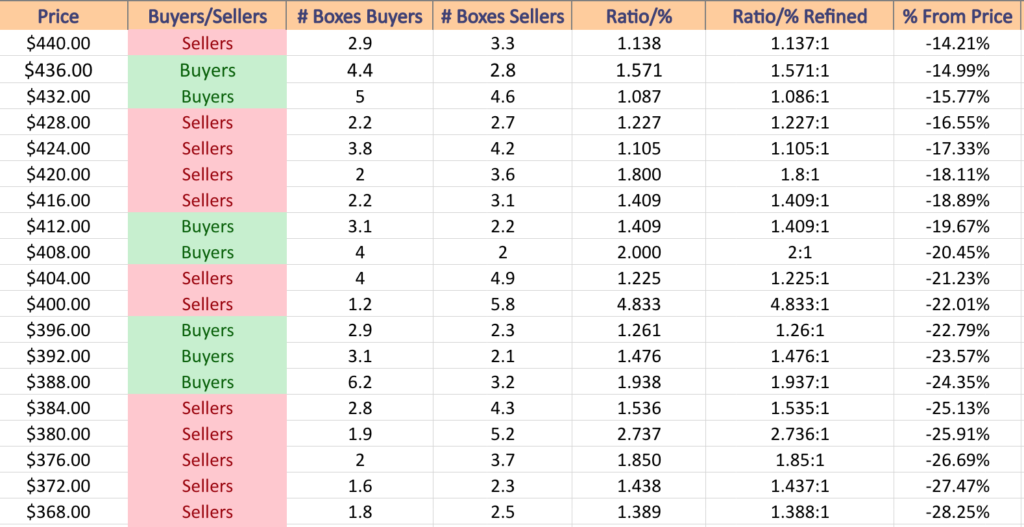
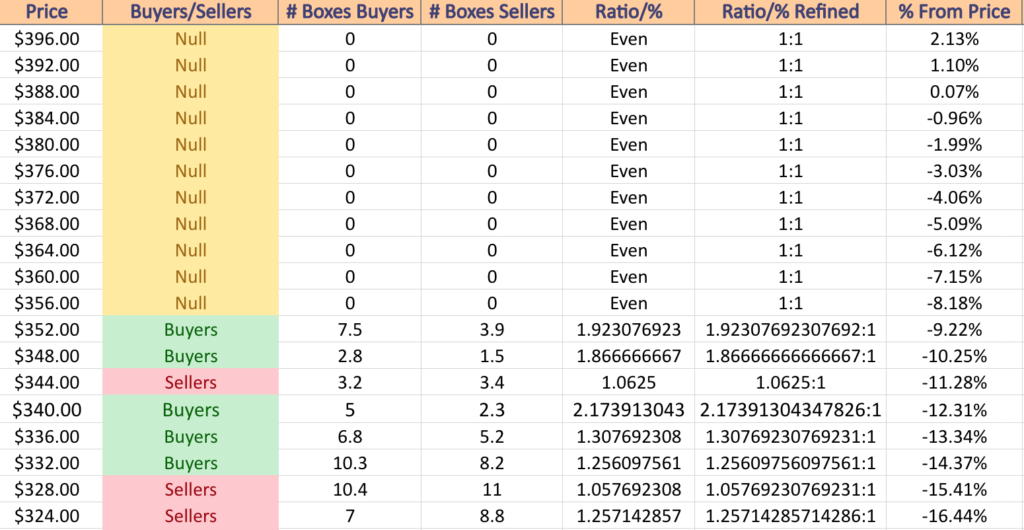
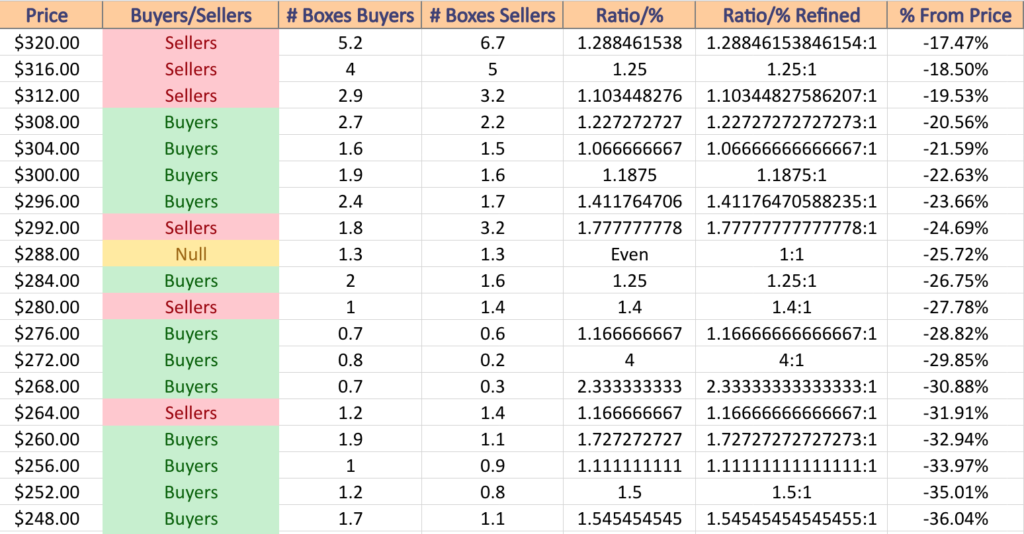
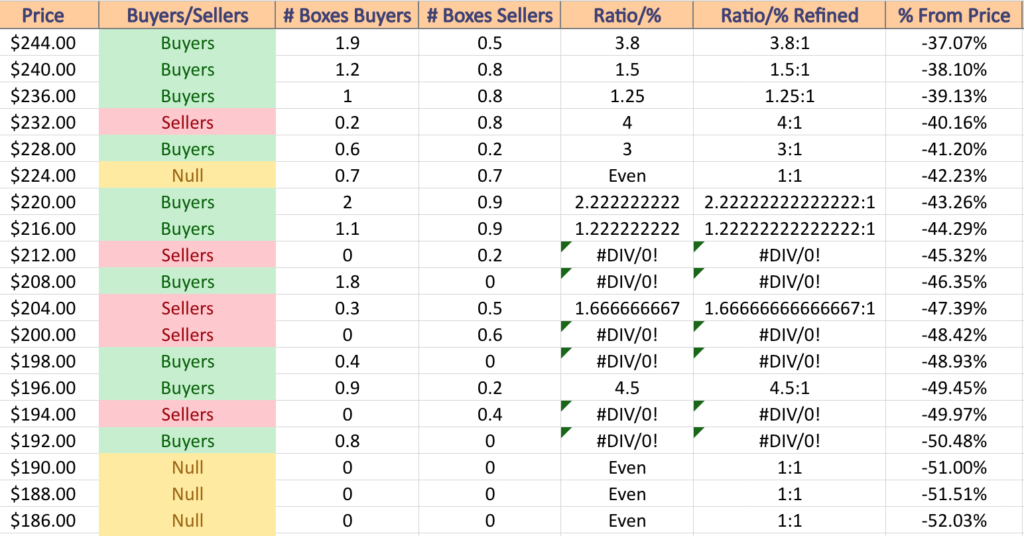
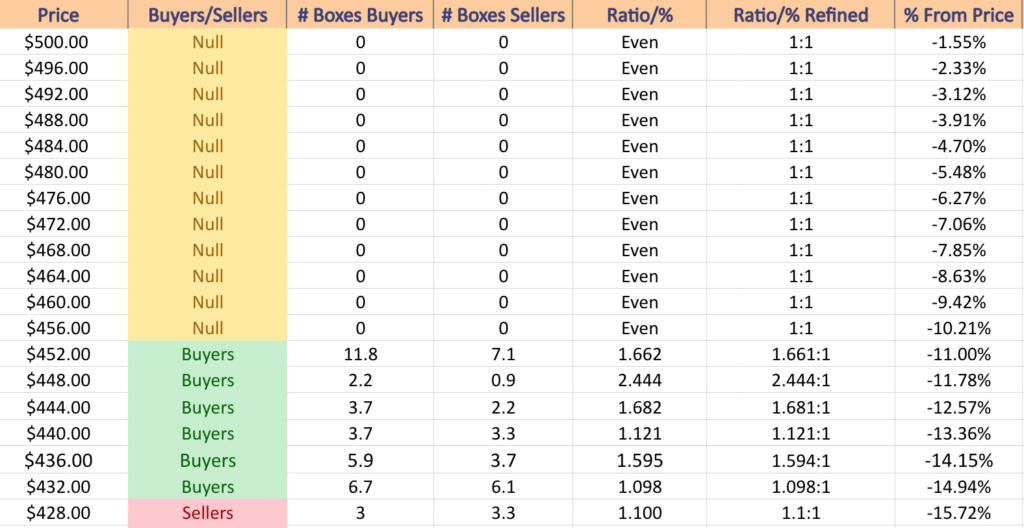
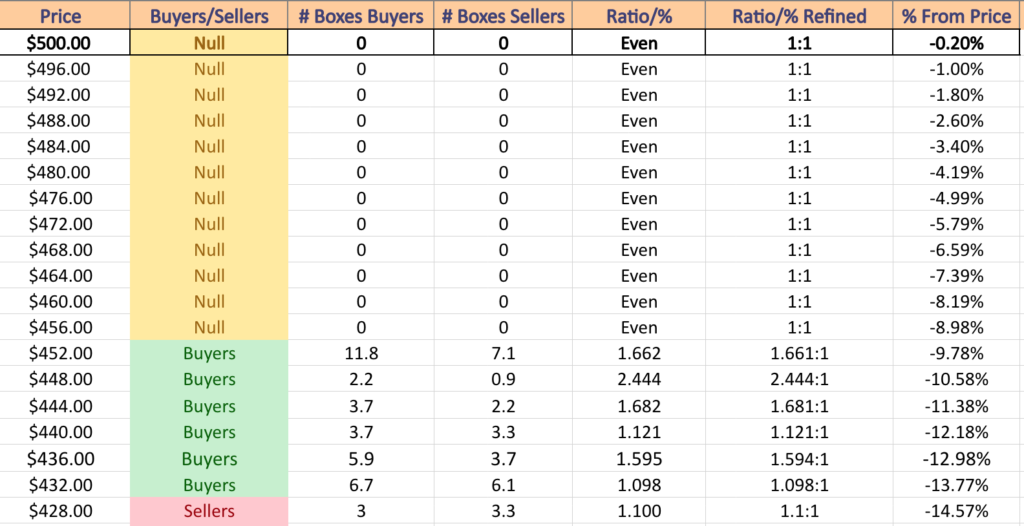
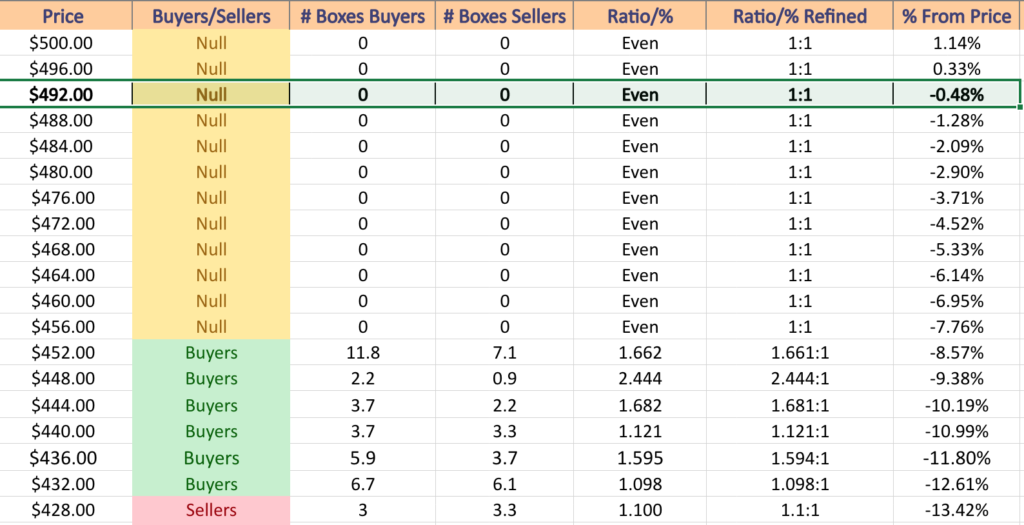
SPY has support at the $518.71 (10 Day Moving Average, Volume Sentiment: NULL, 0:0*), $502.11 (50 Day Moving Average, Volume Sentiment: NULL, 0:0*), $501.94 (Volume Sentiment: NULL, 0:0*) & $489.20/share (Volume Sentiment: NULL, 0:0*) price levels, with no one year resistance levels as they closed Thursday at a new all-time high.
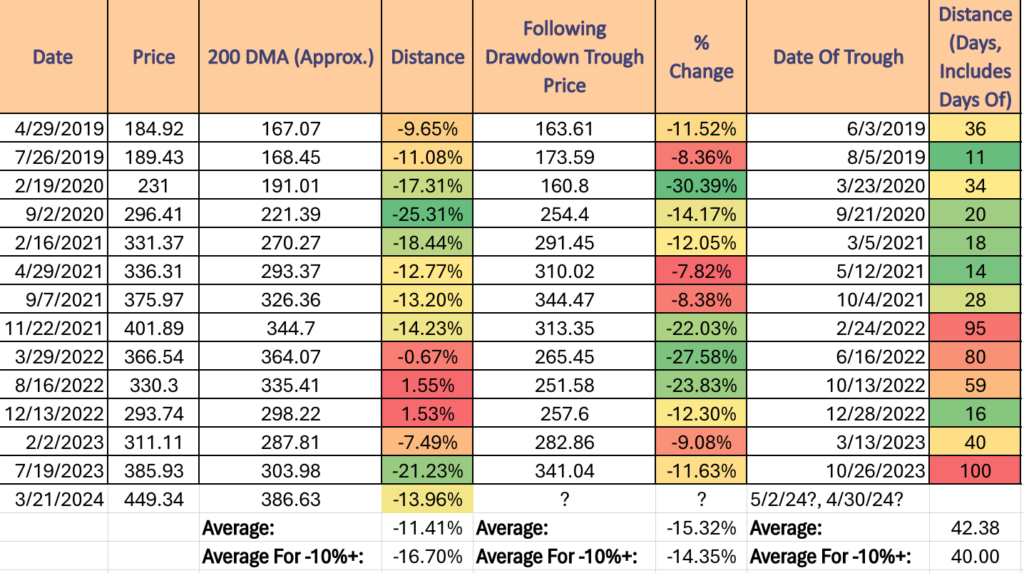
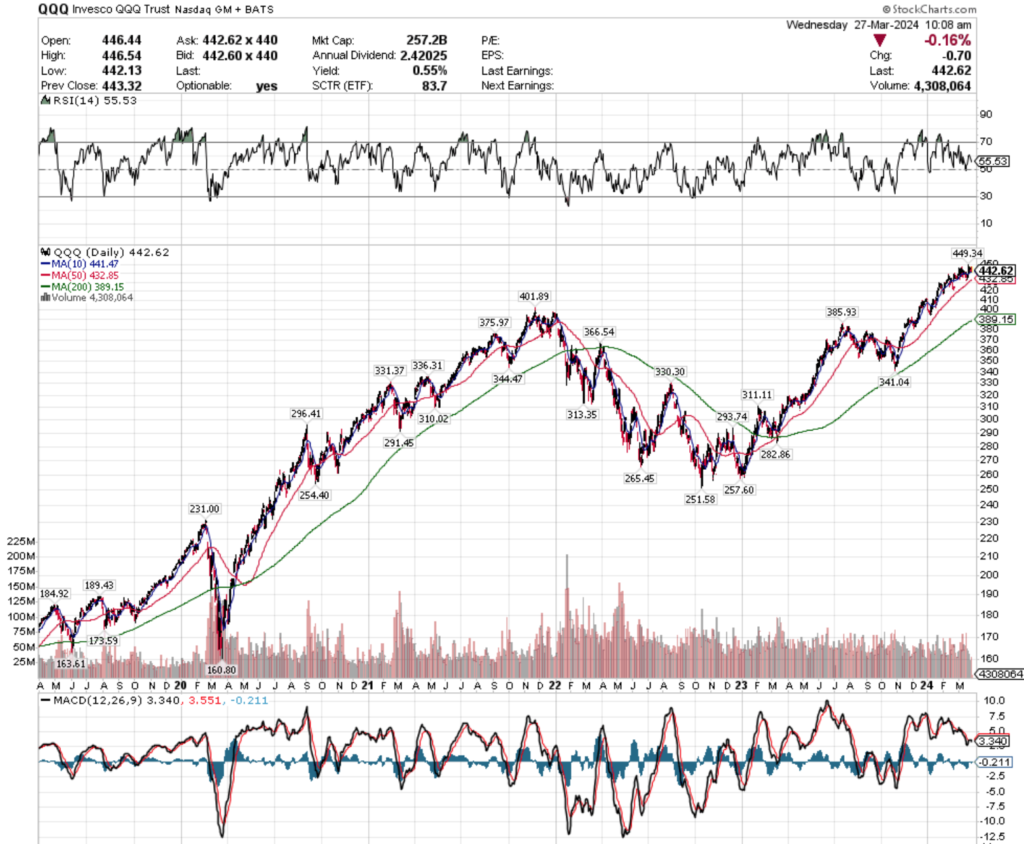
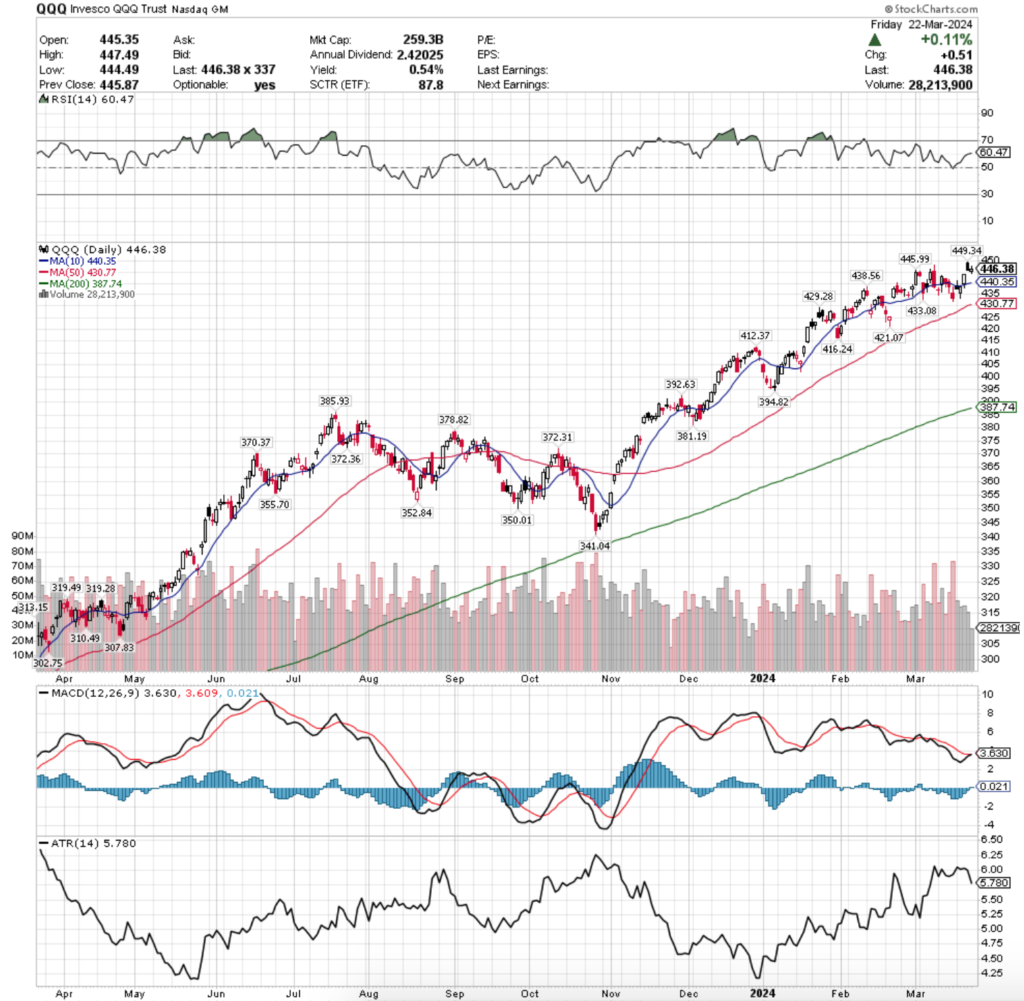
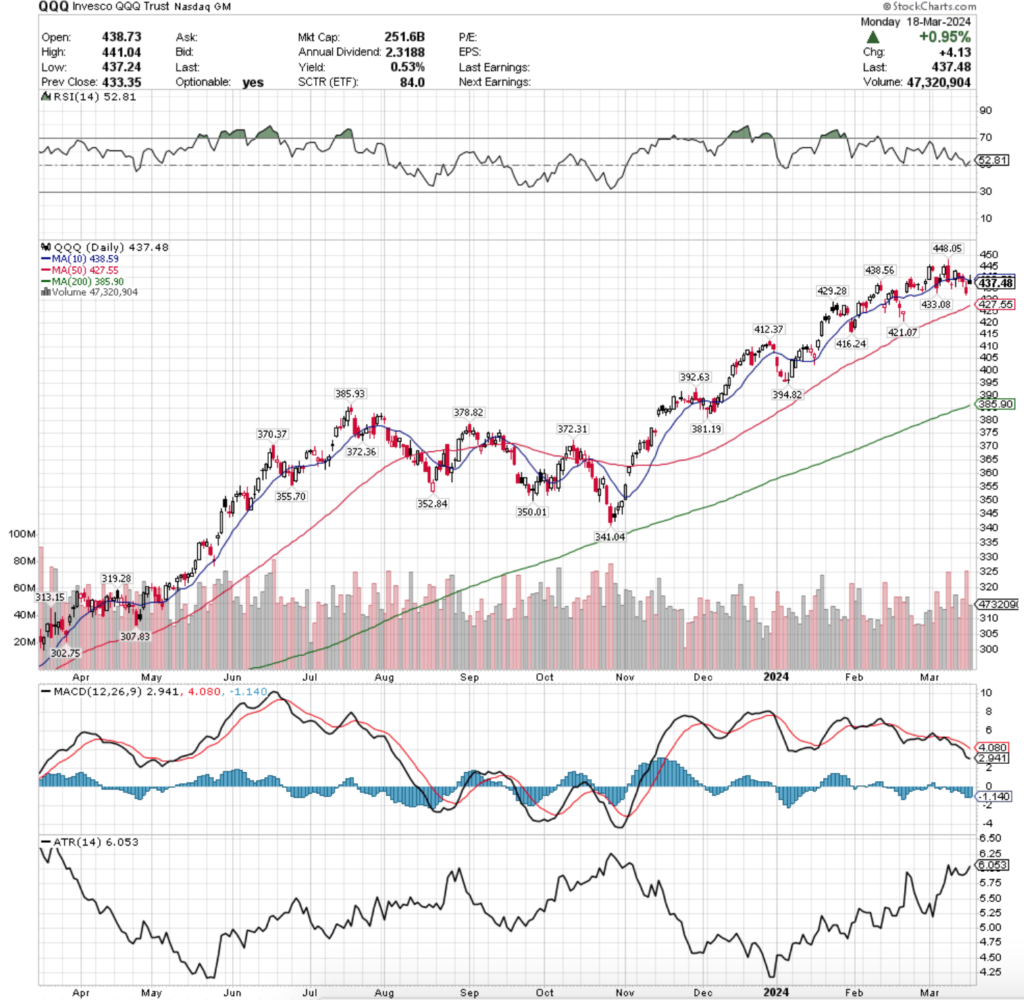
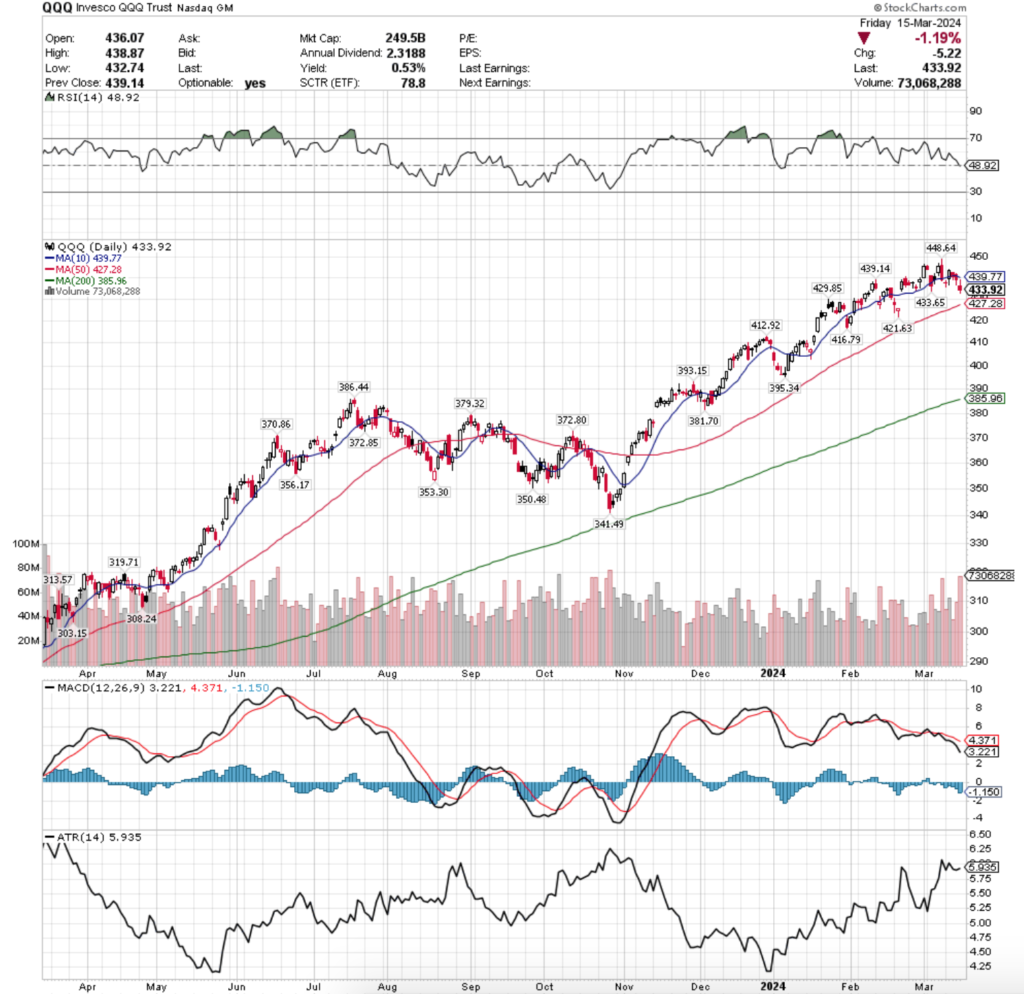
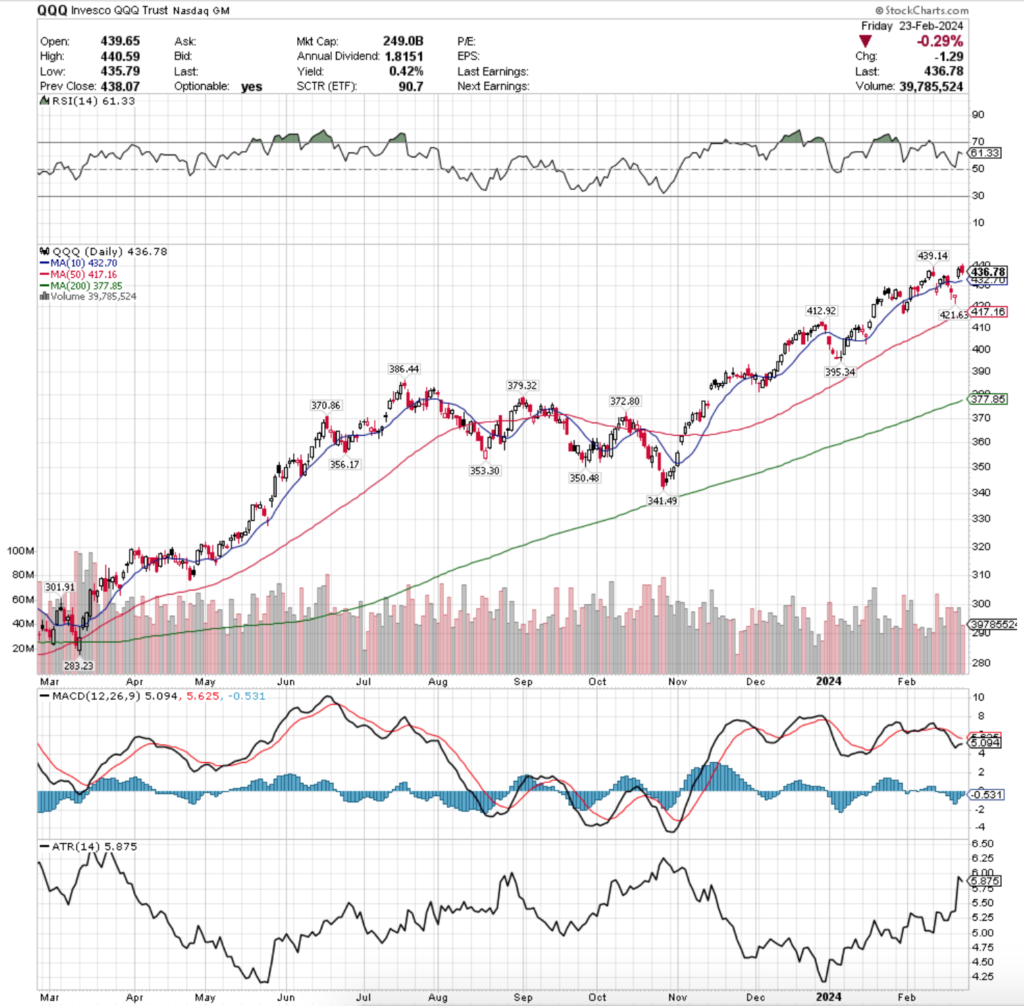
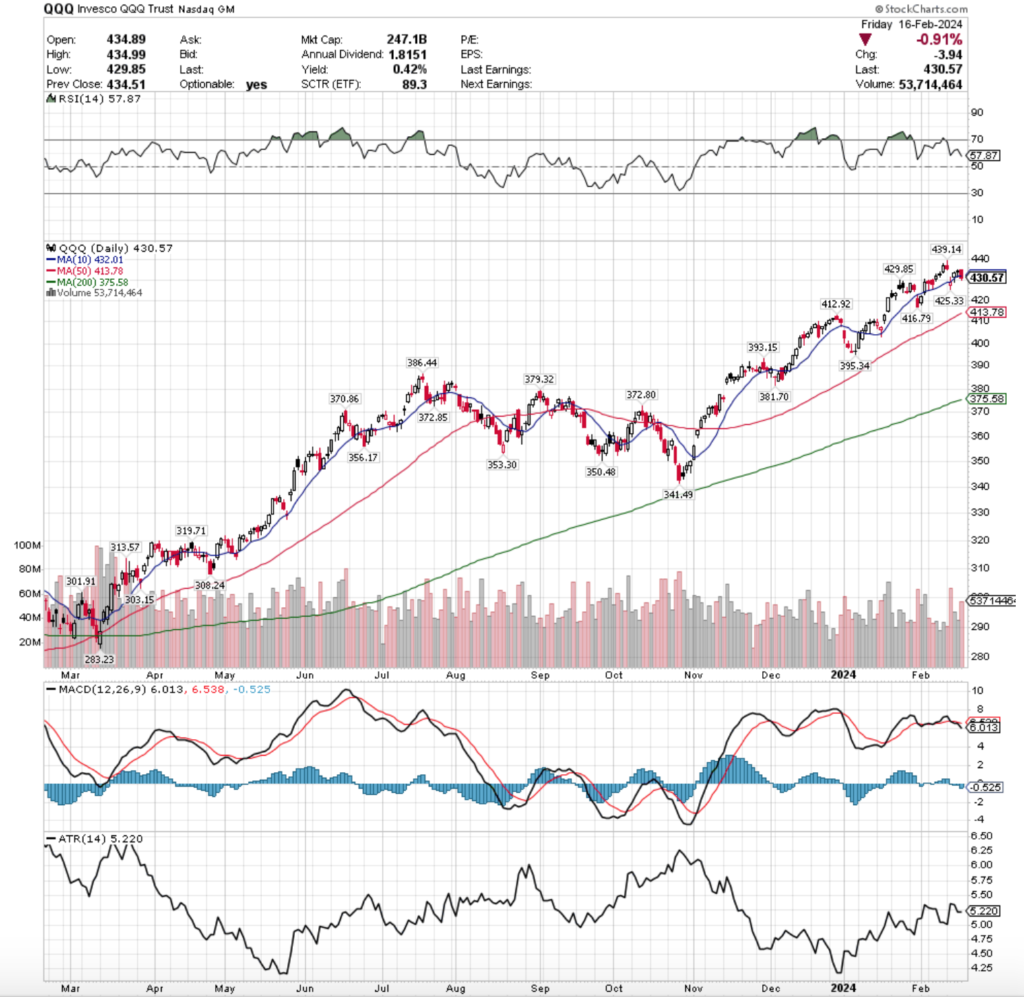
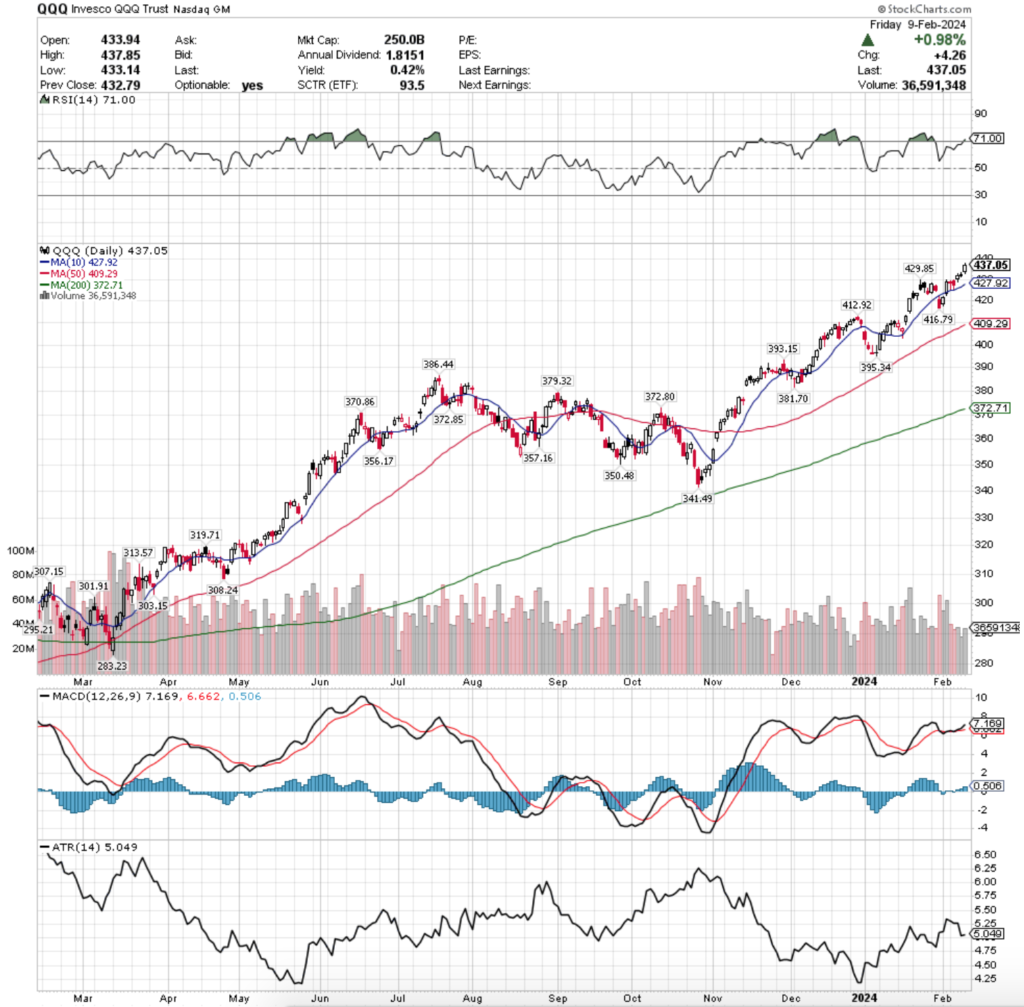
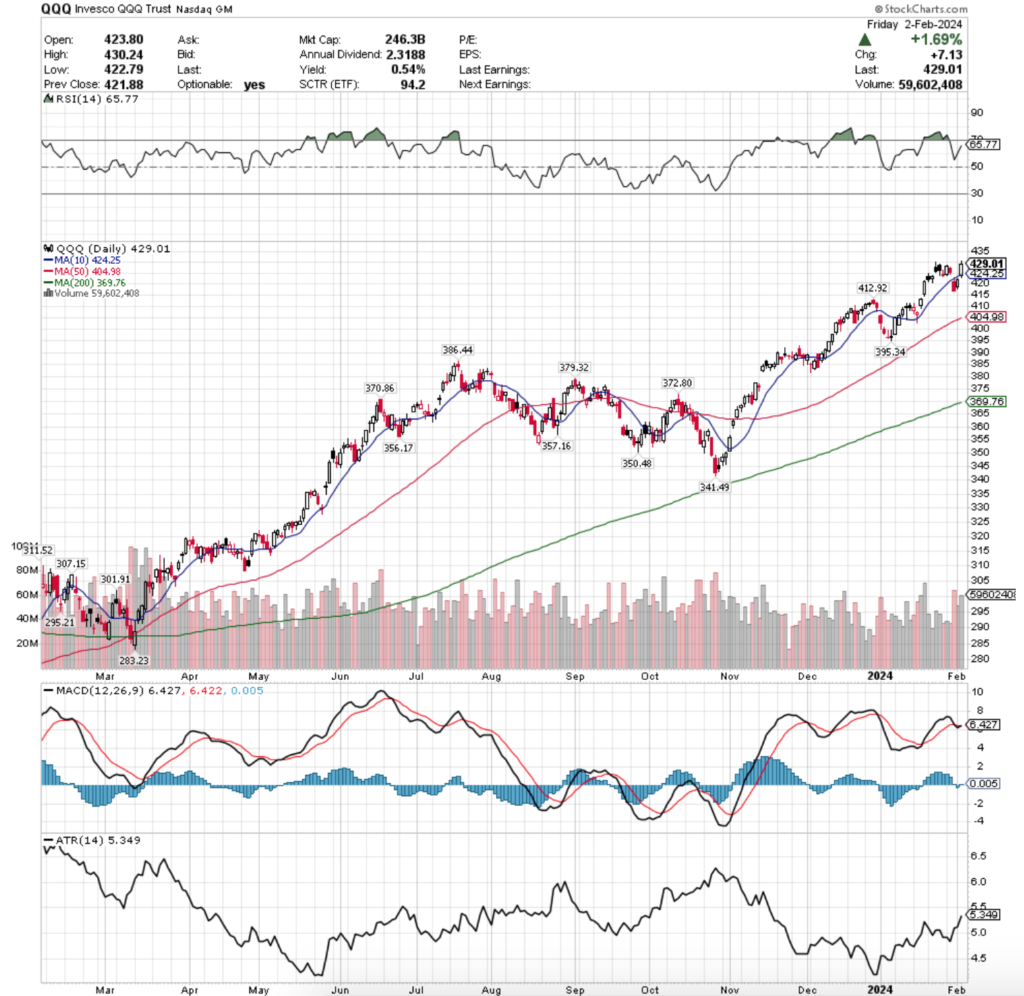
QQQ, the Invesco QQQ Trust ETF that tracks the NASDAQ 100 dipped -0.53% last week, as market participants shied away from the technology-heavy index in favor of the other major three.
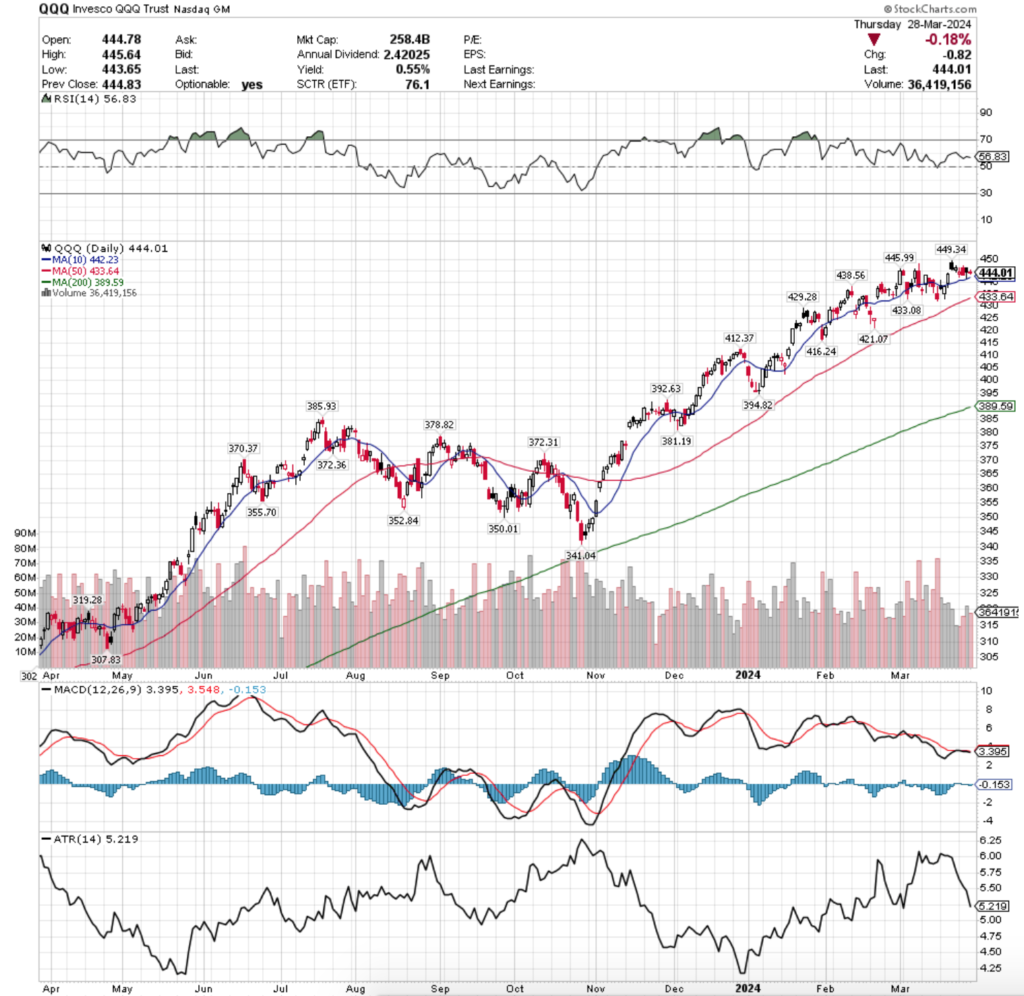
Their RSI is also relatively flat & sits closer to the neutral level of 50, currently at 56.83, while their MACD is bearish but at a muted level, also due to their recent consolidation.
Volumes were well below average last week compared to the year prior, coming in -28.89% less (35,025,325 vs. 49,253,412), as market participants didn’t know which way was up & displayed clear uncertainty about the near-term future.
Much like SPY, QQQ kicked Monday off with very weak volume on a declining session.
However, Monday’s spinning top signaled uncertainty with optimism, as despite being a declining day the candle is hollow, indicating that the close was higher than the open.
However, based on the size of the upper shadow in relation to the lower shadow it is clear that market participants were not eager to test much higher.
Tuesday saw a bit more volume, an opening gap up to the top of Monday’s range that tested slightly higher (upper shadow), but ultimately was rejected & prices declined to close beneath the open of Monday’s session.
Wednesday got a bit more interesting, as the session resulted in an advance on the highest volume of the week, but the candlestick for the day reflected a heavy dose of bearishness & uncertainty, while validating the strength of the 10 day moving average’s support.
Despite being an advancing session that formed a bullish harami pattern with Tuesday’s candle, it comes in the wake of Tuesday & Monday’s bearish engulfing pattern & neither the open nor the high of the day (which occurred just above the open) were able to break Tuesday’s high & the day’s close was ultimately lower than its open.
While the open-close price concentrated at the upper end of the candle & there were many lower prices beneath it that were rejected & it was the highest volume of the week, the 10 DMA’s support kept the consolidation range in tact, and the week’s only advancing session did not appear to reflect any meaningful strength that bulls are looking for.
Friday confirmed this, with a bearish decline of -0.18% on the second highest volume of the week, where the risk-off into the weekend sentiment was alive & well.
While Friday’s real body opened within Thursday’s body, the close resulted in a move below Thursday’s & the shadows of the doji did not show much of a test to the upside or downside, meaning that market participants viewed the day’s price level as being in equilibrium, even if only temporarily.
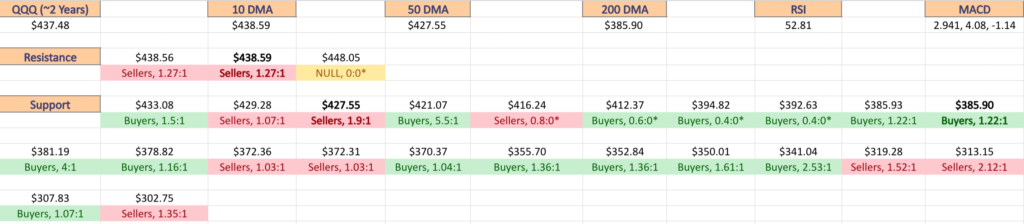
As has been the case for much of 2024, QQQ’s 10 DMA will be an area to keep an eye on this week, as the support level was able to hold up on Thursday but has not been as sturdy of support as SPY’s 10 DMA.
Due to the nature of QQQ’s consolidations during its ascent it has more near-by support levels than just the 10 & 50 DMAs, but if the price falls below either (or both) there will begin to be downwards pressure applied to QQQ’s price which will intensify the tests of support.
Their Average True Range has been declining since mid-March, but an uptick in it will likely avalanche into the previously mentioned downside test based on the market sentiment of the past week & Thursday’s close.
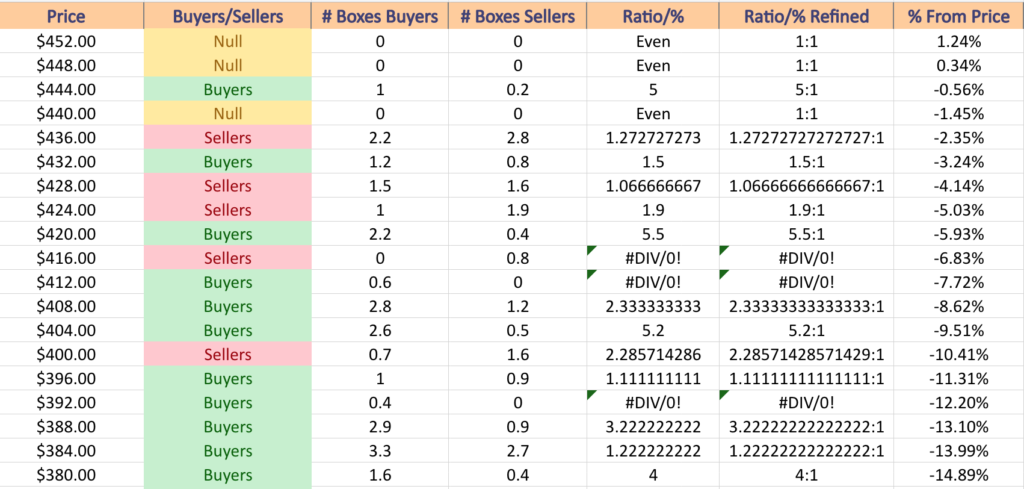
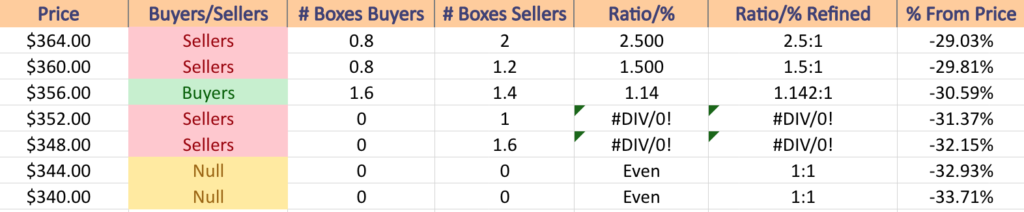
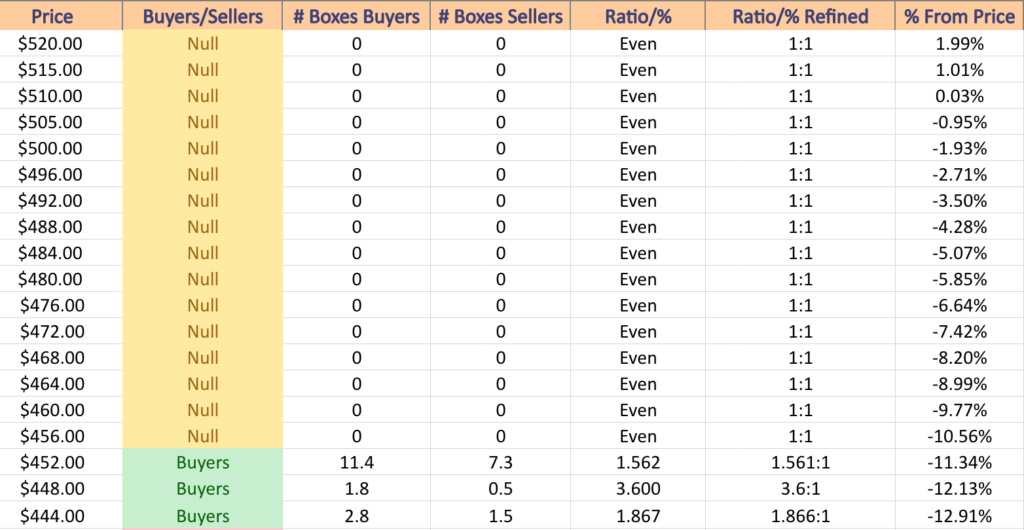
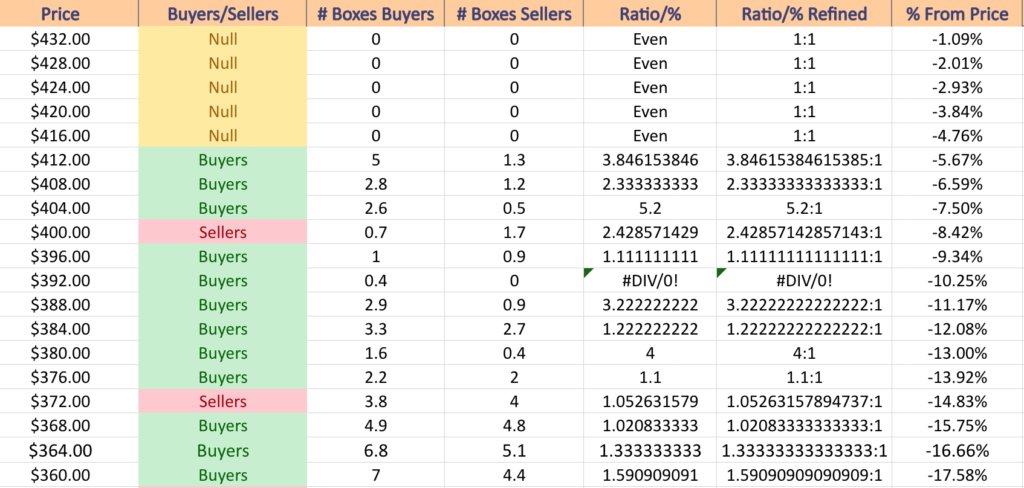
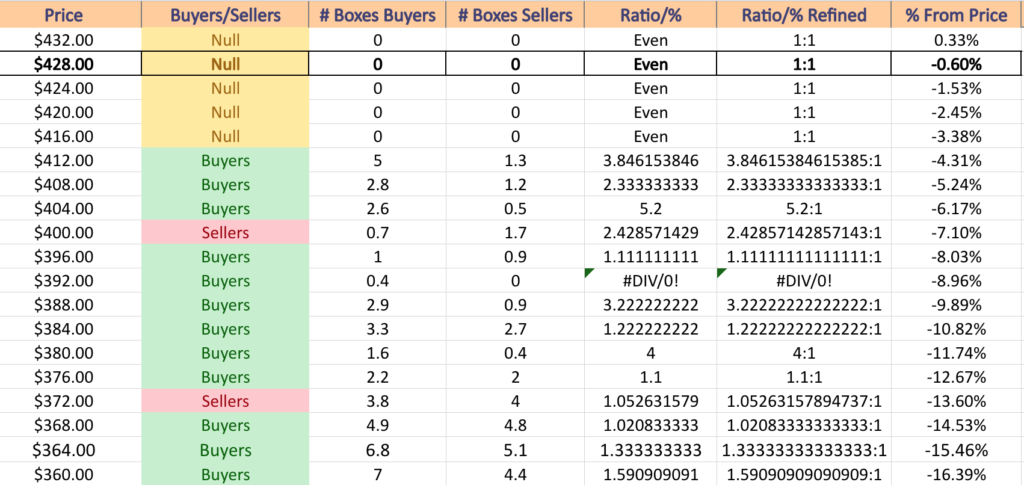
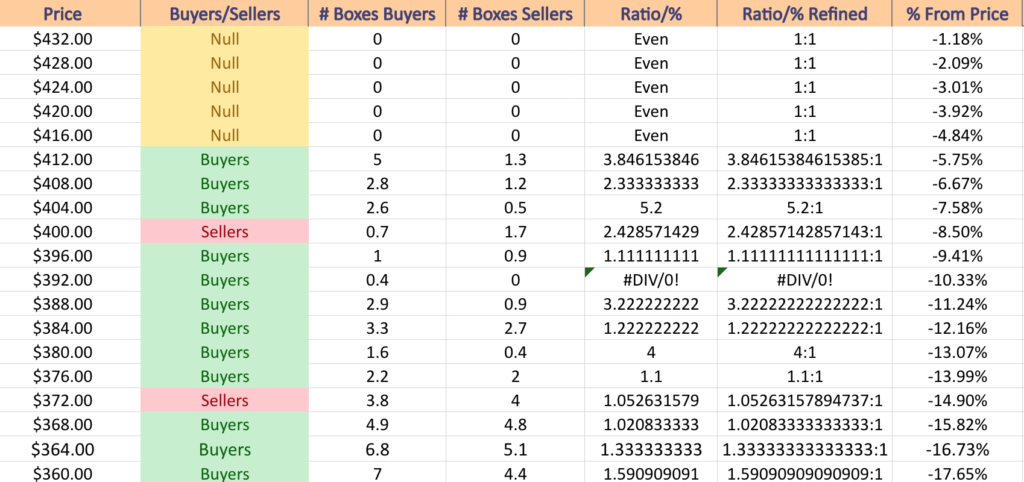
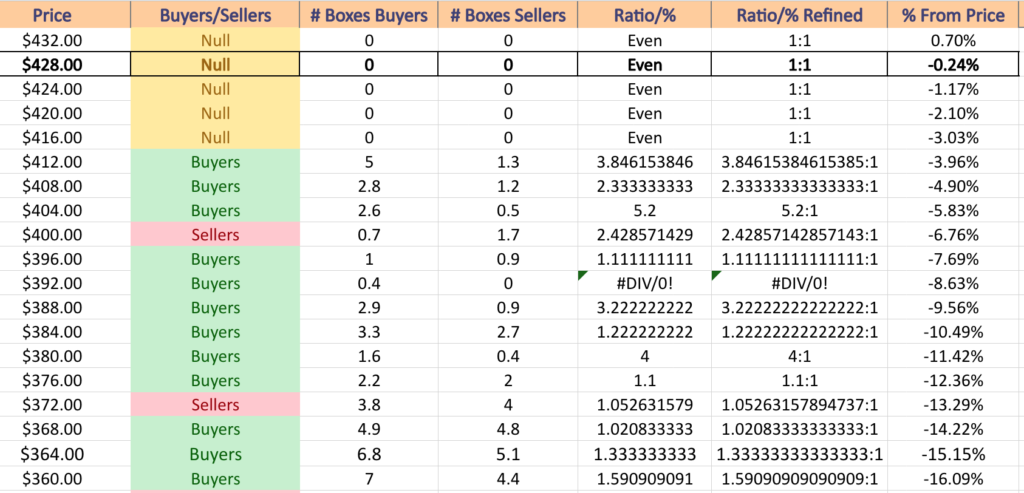
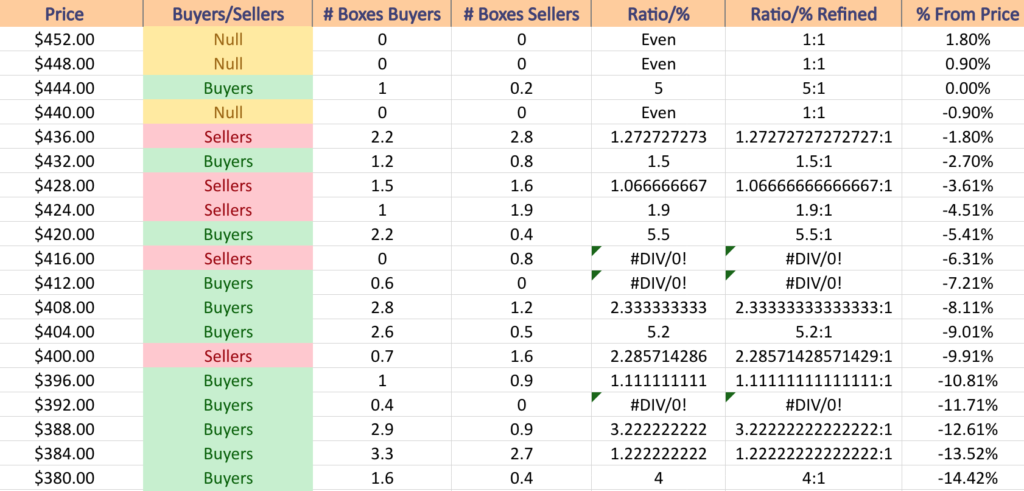
QQQ has support at the $442.23 (10 Day Moving Average, Volume Sentiment: NULL, 0:0*), $438.56 (Volume Sentiment: Sellers, 1.27:1), $433.64 (50 Day Moving Average, Volume Sentiment: Buyers, 1.5:1) & $433.08/share (Volume Sentiment: Buyers, 1.5:1) price levels, with resistance at the $445.99 (Volume Sentiment: Buyers, 5:1) & $449.34/share (All-Time High, Volume Sentiment: NULL, 0:0*) price levels.
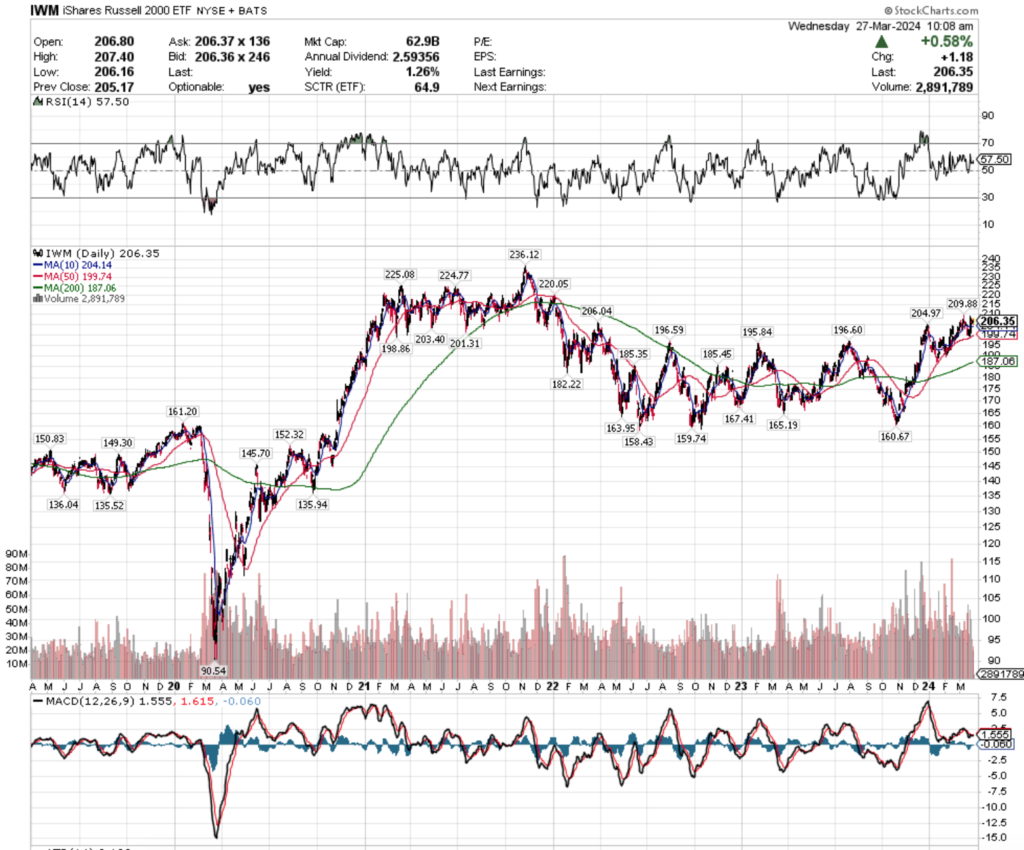
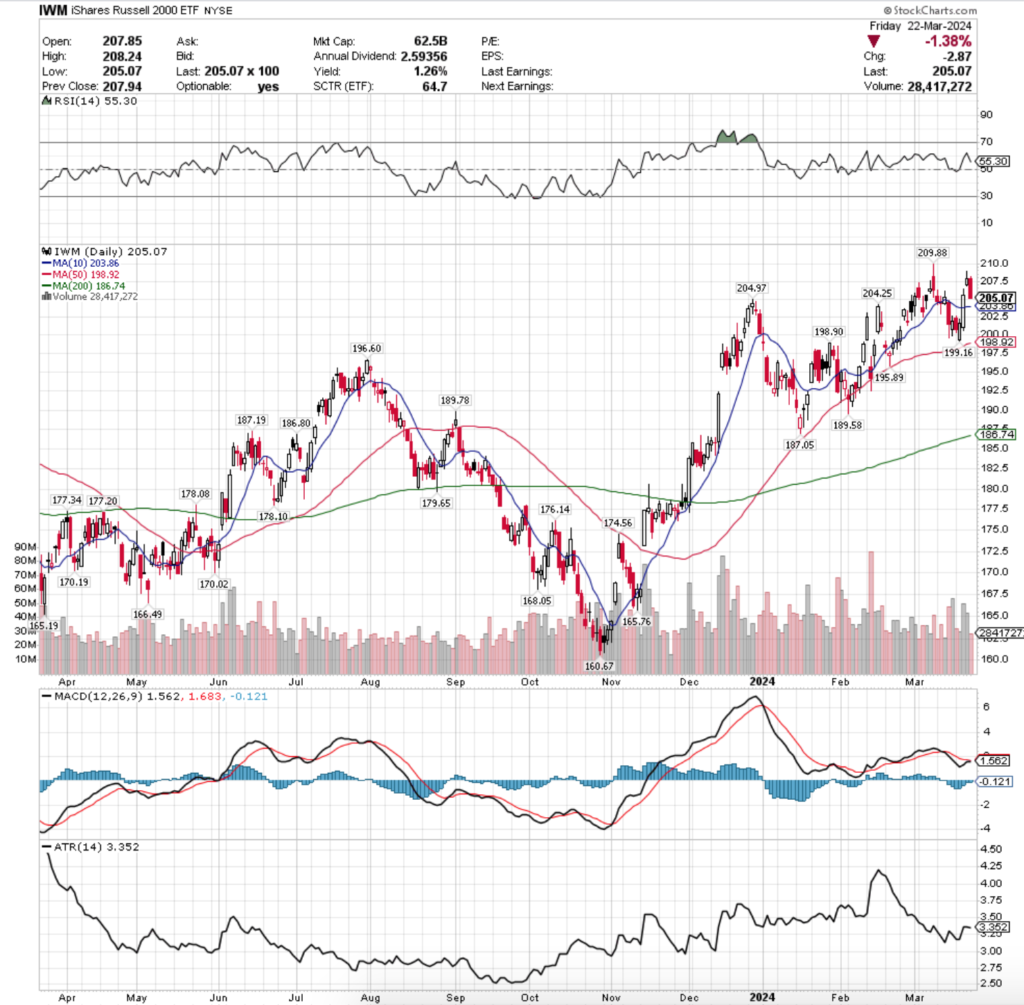
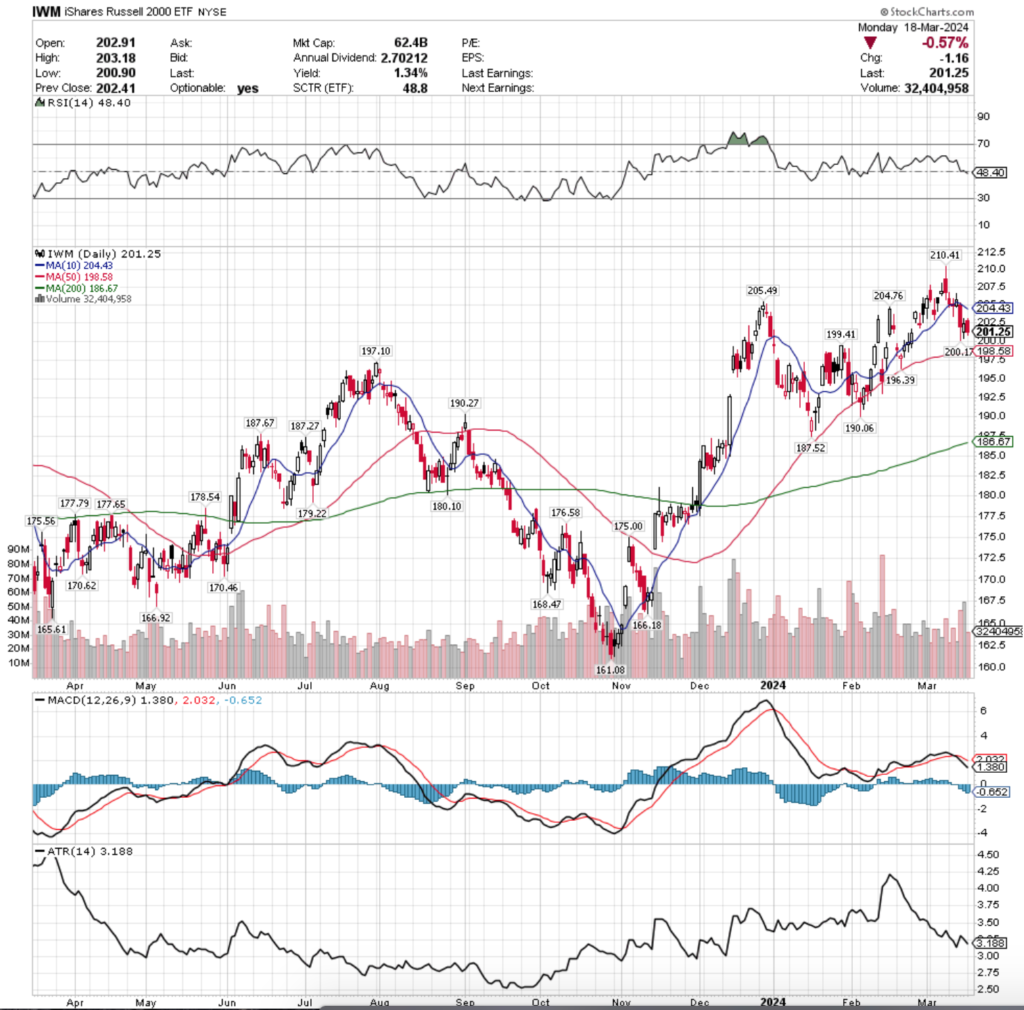
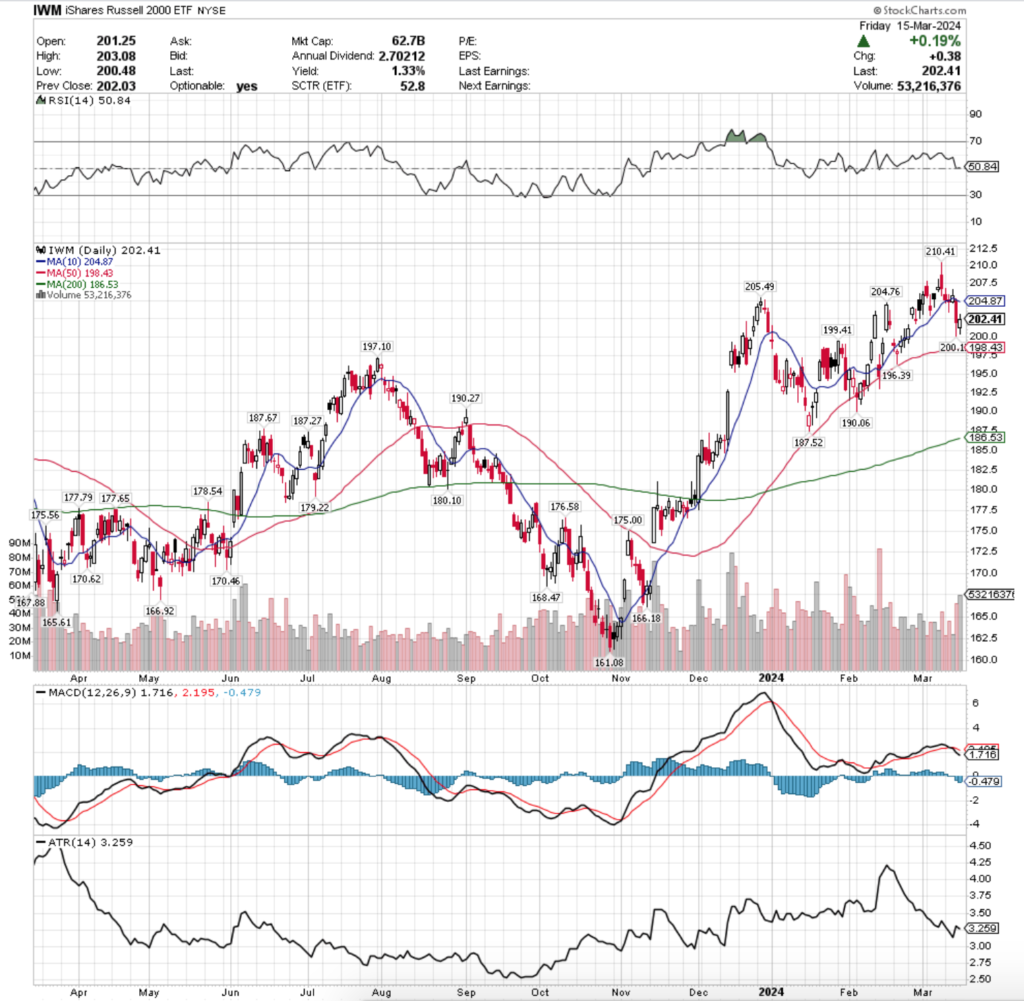
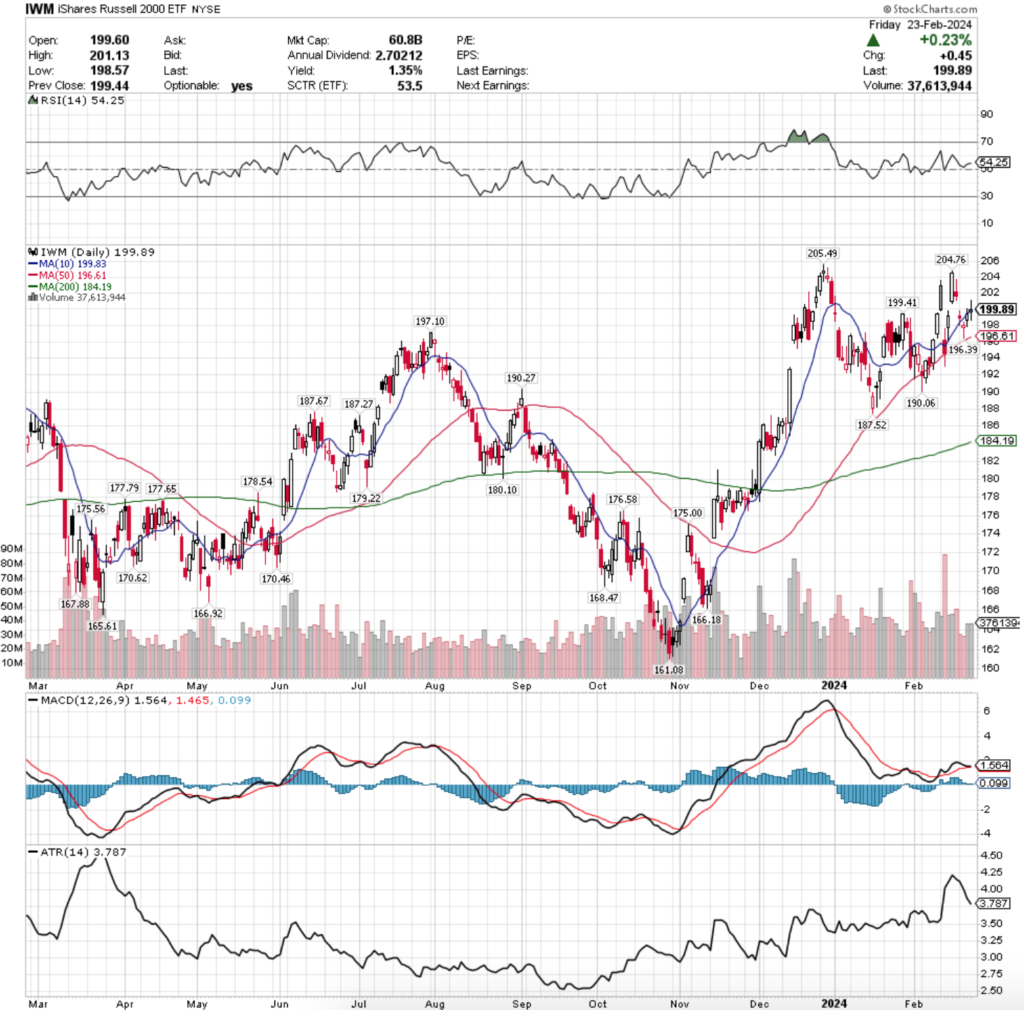
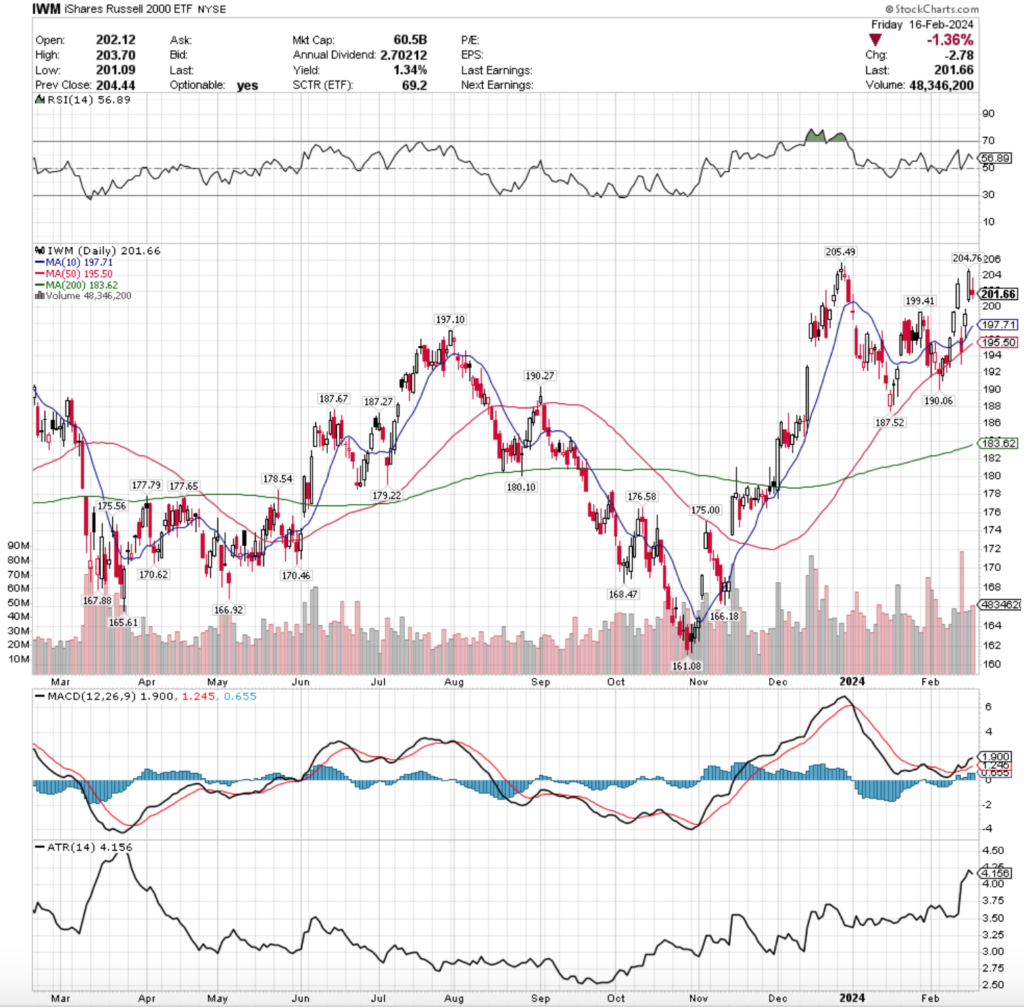
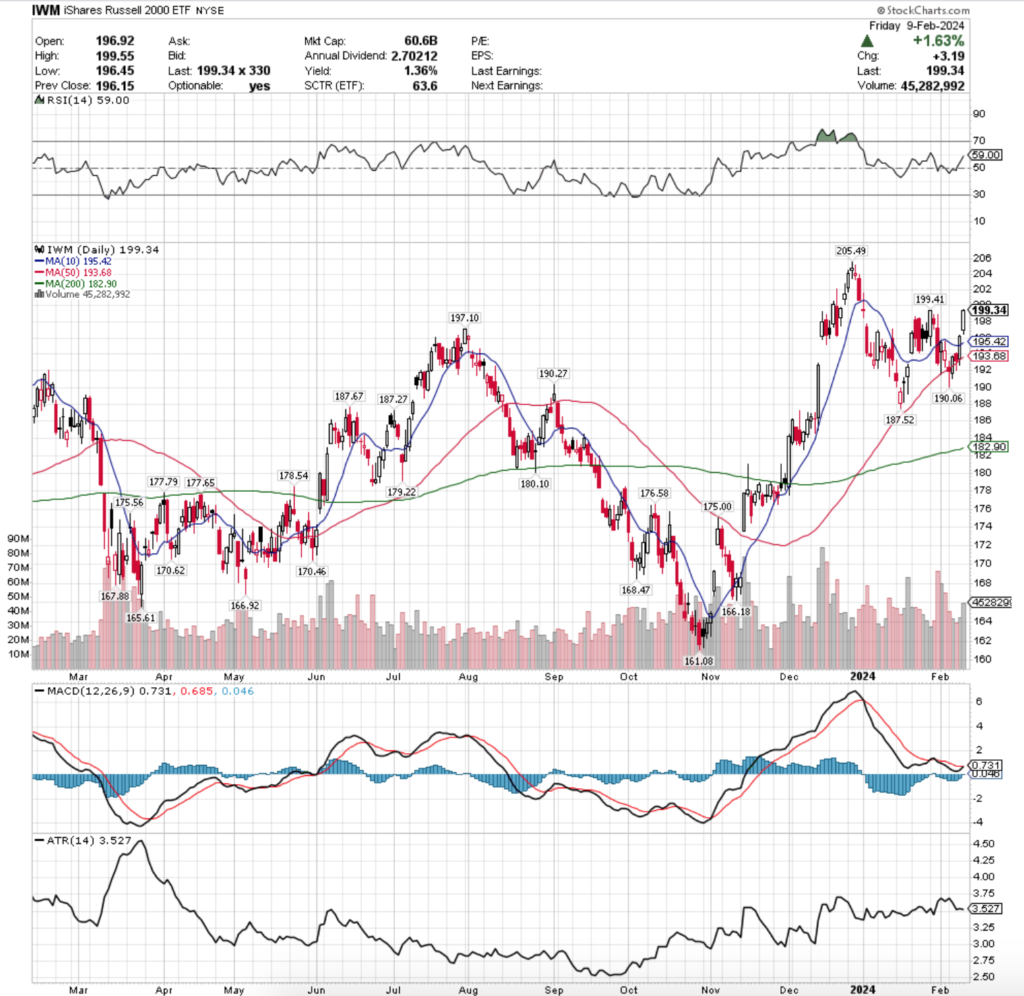
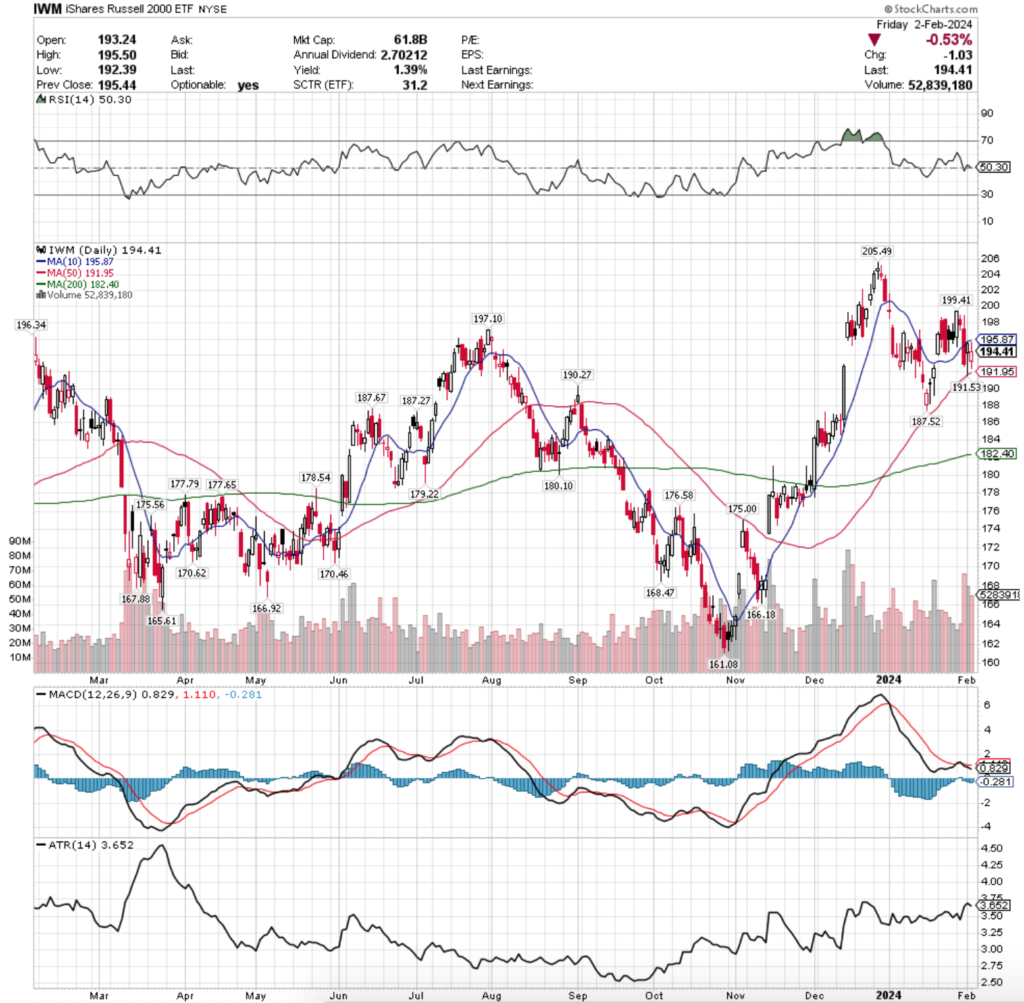
IWM, the iShares Russell 2000 ETF advanced +2.55% last week, faring the best of the big four indexes in terms of weekly performance, as small cap names were heavily favored.
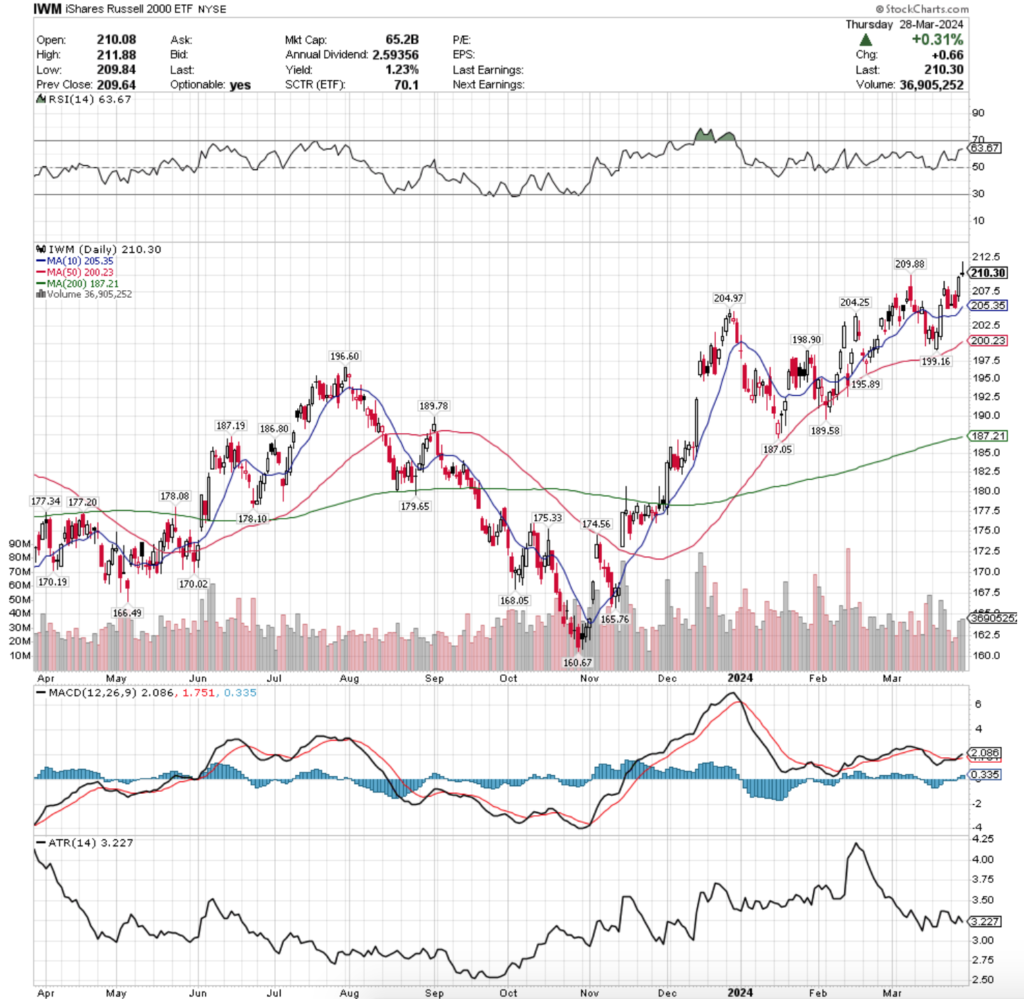
Their RSI is flattening out after making a run for overbought territory & currently sits at 63.67, while their MACD is bullish, but due to Thursday’s gap up & shooting star candle will be an area to watch in the coming days to see how sustainable the move actually is (currently it looks to be on thin ice).
Volumes were -15.23% lower than their annual average last week (29,055,200 vs. 34,276,900), which can be seen as a sign of bearishness given that three of the four sessions resulted in advancing prices.
Monday kicked off the week with a gravestone doji that kicked off an unconventional week of price movement on low volume, signaling quite a bit of uncertainty.
Tuesday was the week’s only declining session which resulted in a bearish engulfing pattern when combined with Monday’s session, where the day began on a gap up, tested a little bit higher, before being sold off & resulting in a decline for the day.
Wednesday came as a surprise, where higher volumes came into play & a wide-range session resulted in prices advancing after temporarily testing lower, but the session’s high of $209.71 was unable to reach the 52-week high that was established in the first half of March ($209.88).
Thursday wrapped the week up with even more confusion, as the day opened on a gap up, tested higher (reaching a fresh 52-week high), but bulls were not in control & the session resulted in a gravestone doji.
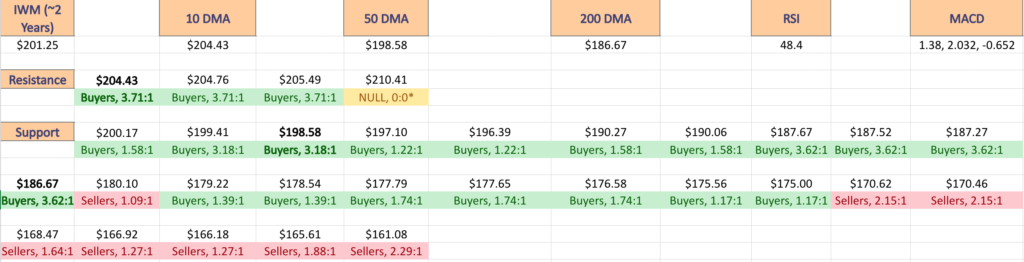
Their 10 day moving average will be an area market participants keep an eye on this coming week, as if its support gives out then there are 2 support touch-points in the $204-204.99/share range before the 50 DMA appears 2% lower than that zone.
Their Average True Range has been declining over the past few sessions & is approaching the level that it has been pivoting off of recently, which may lead to an increase in volatility in the coming week.
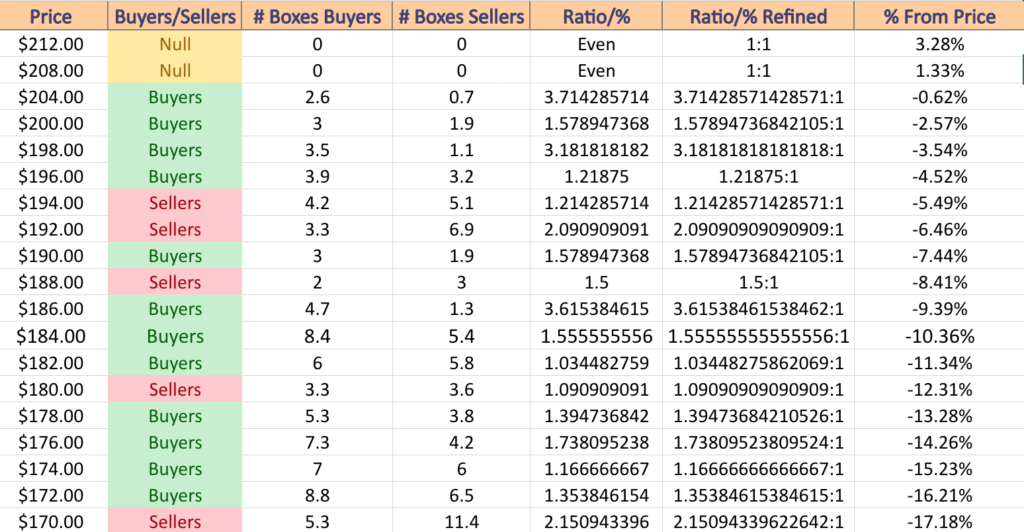
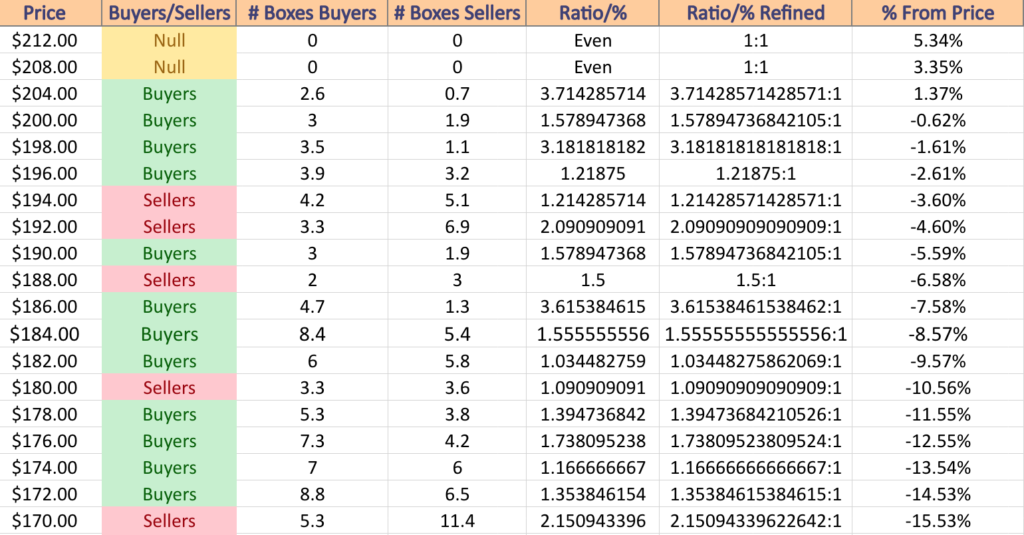
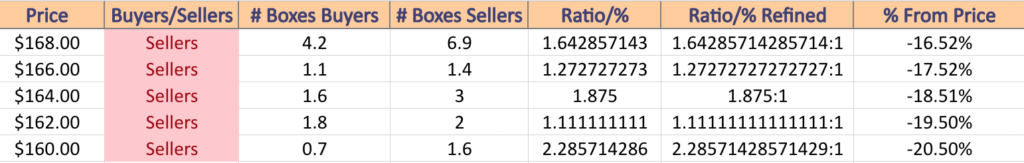
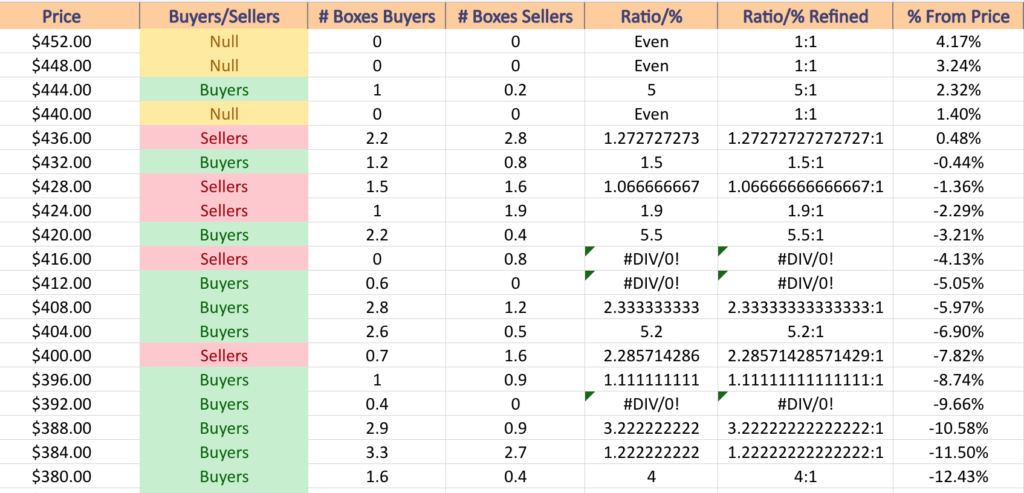
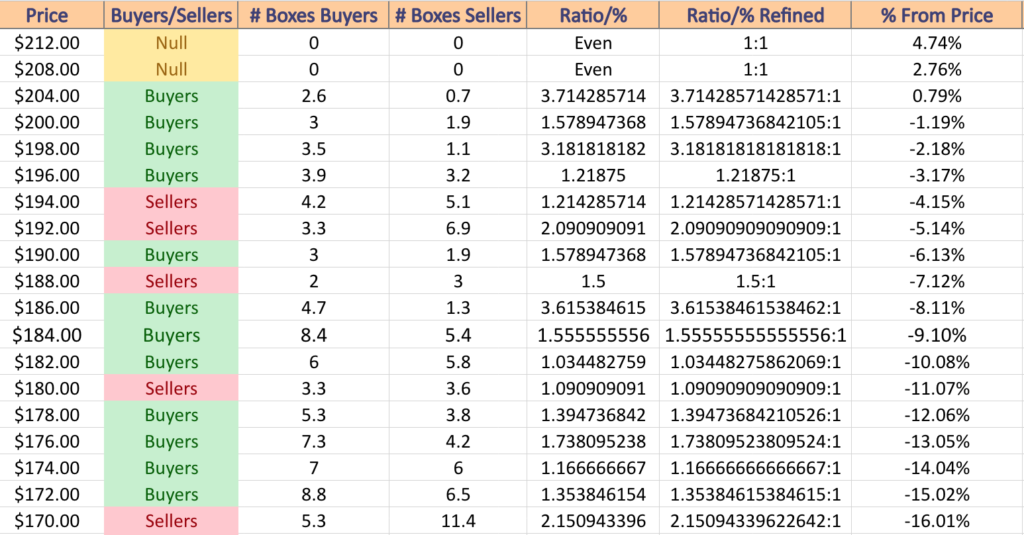
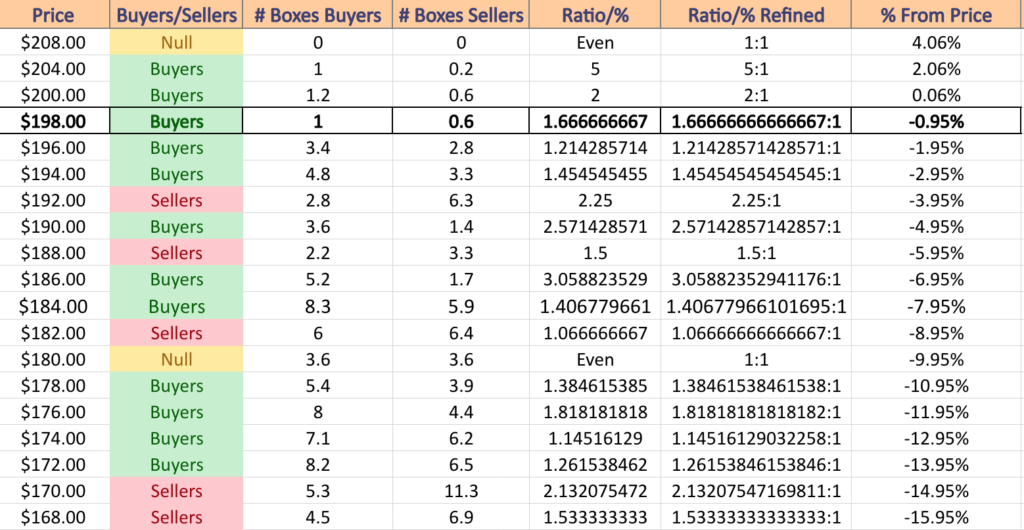
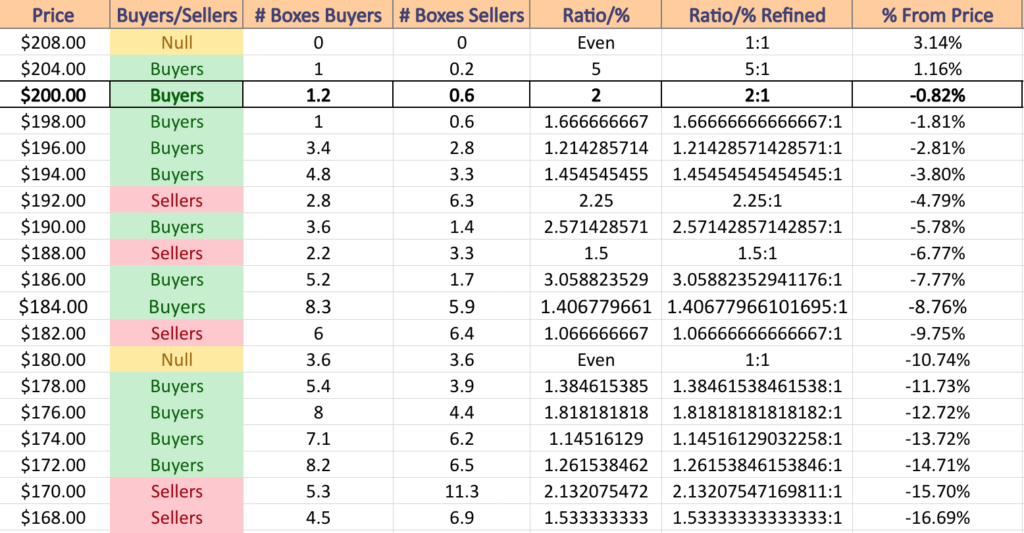
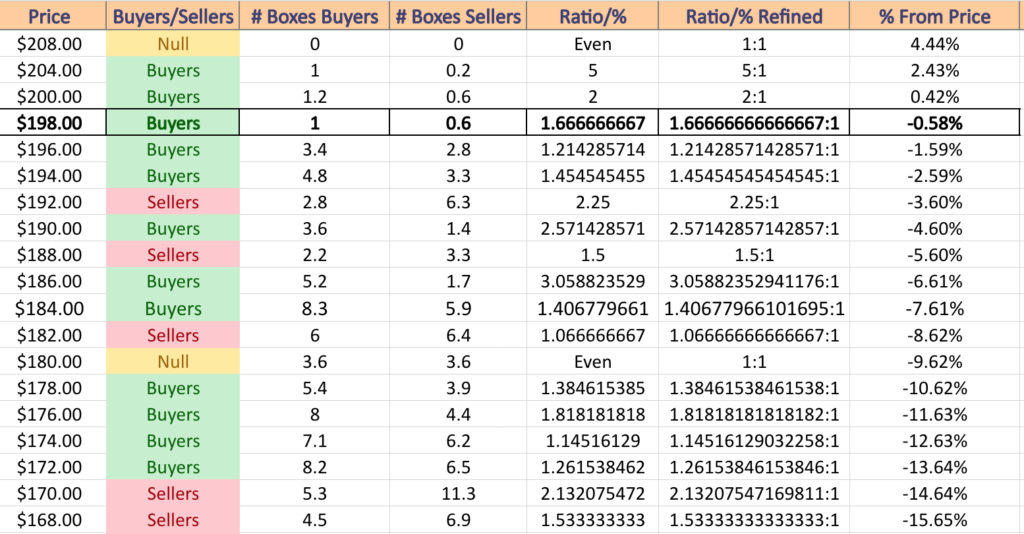
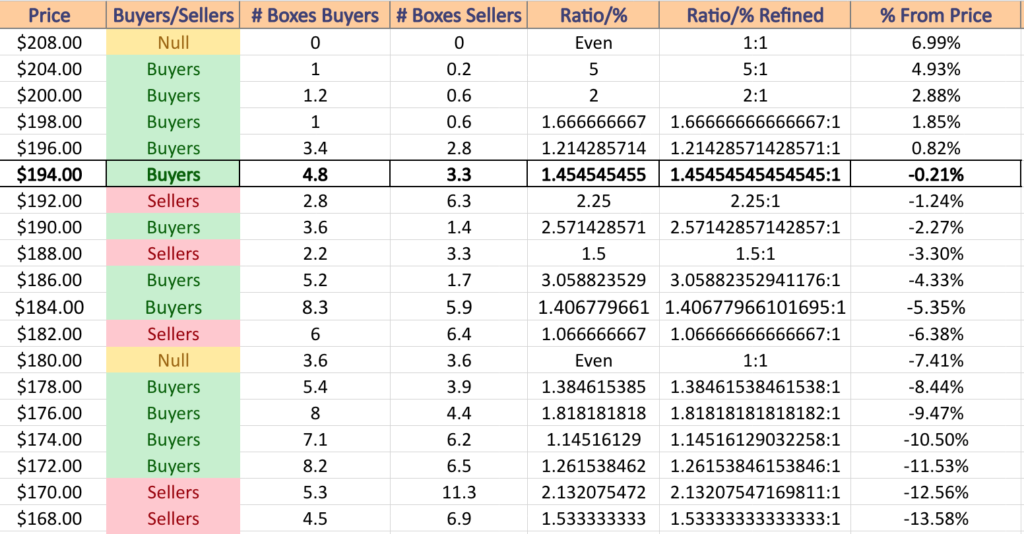
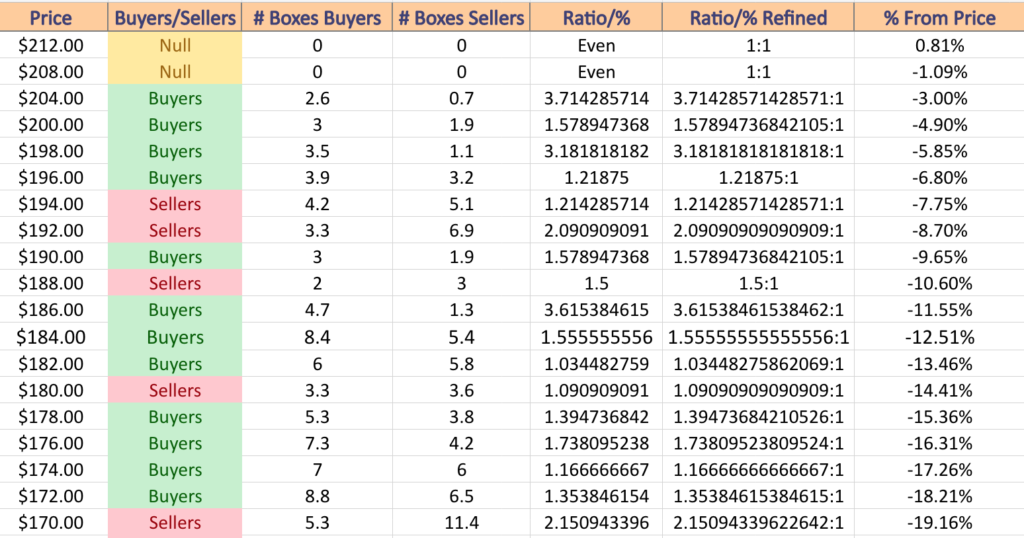
IWM has support at the $209.88 (Volume Sentiment: NULL, 0:0*), $205.35 (10 Day Moving Average, Volume Sentiment: Buyers, 3.71:1), $204.97 (Volume Sentiment: Buyers, 3.71:1) & $204.25/share (Volume Sentiment: Buyers, 3.71:1) price levels, with no current one-year resistance levels as they closed after reaching a new a 52-week high on Thursday.
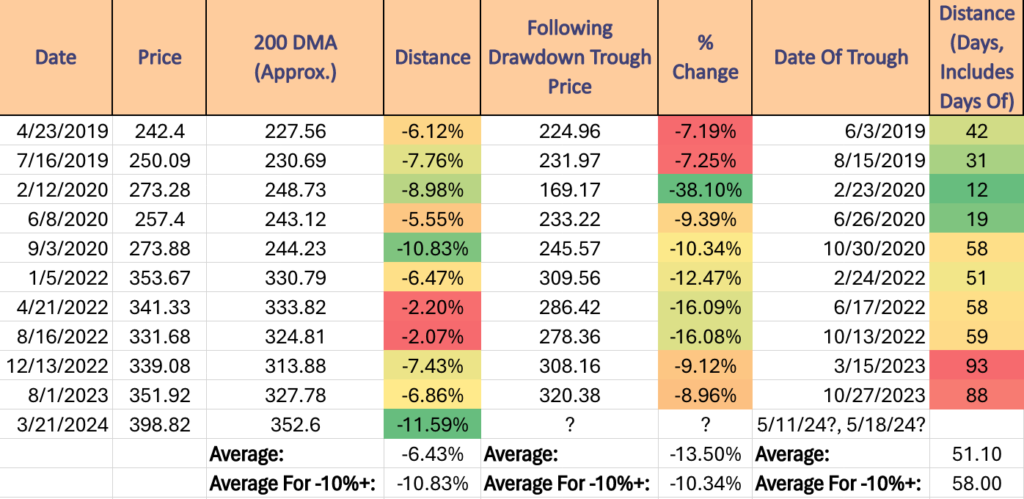
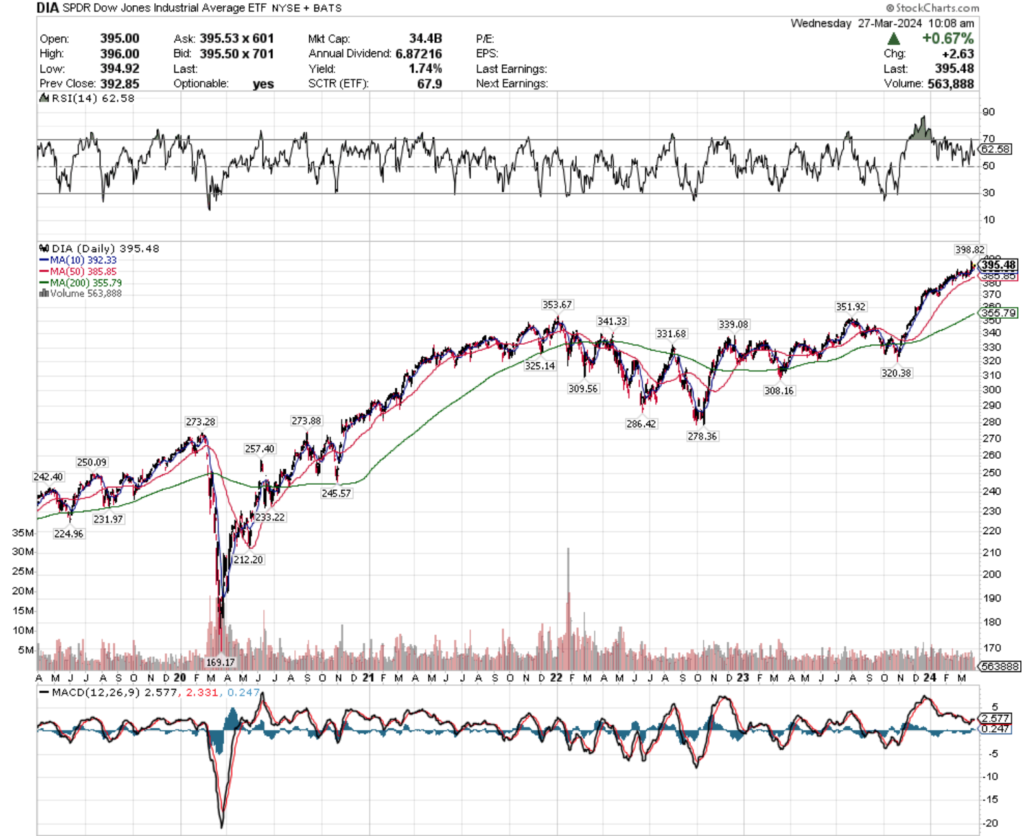
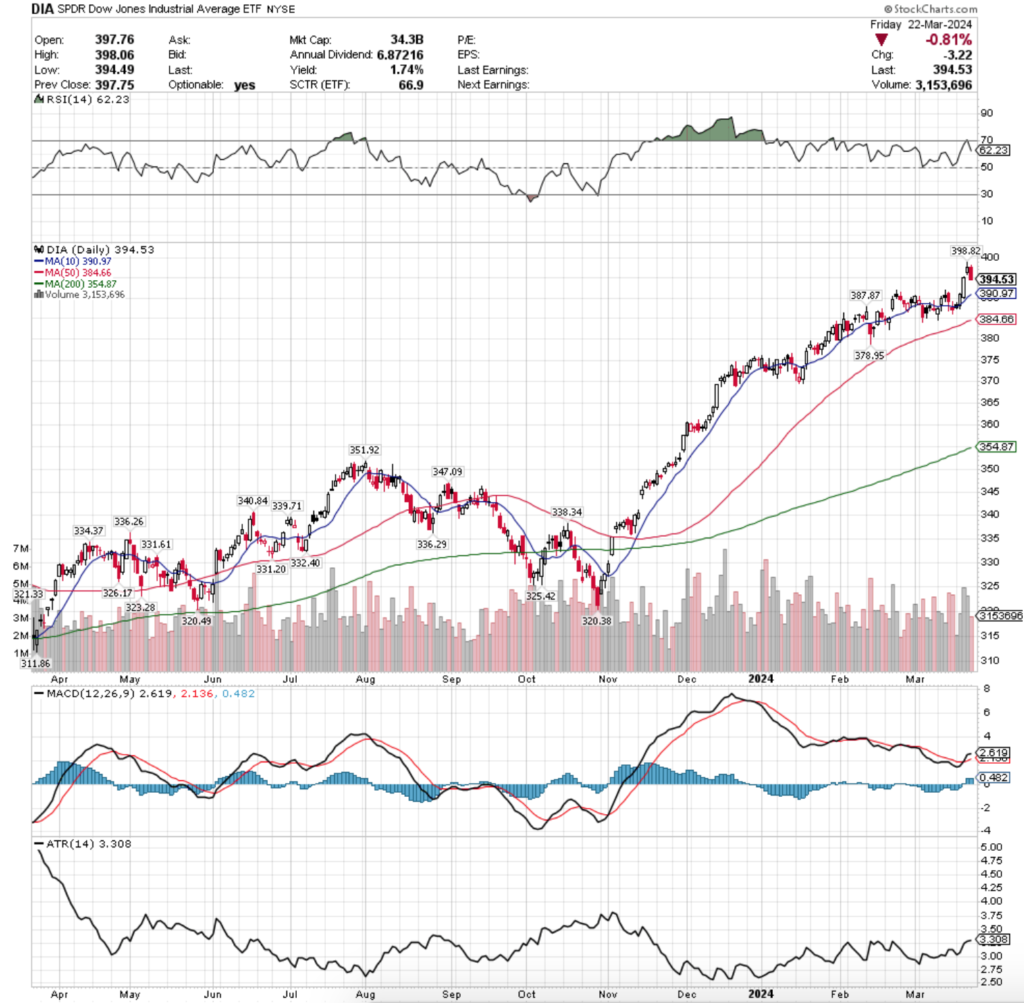
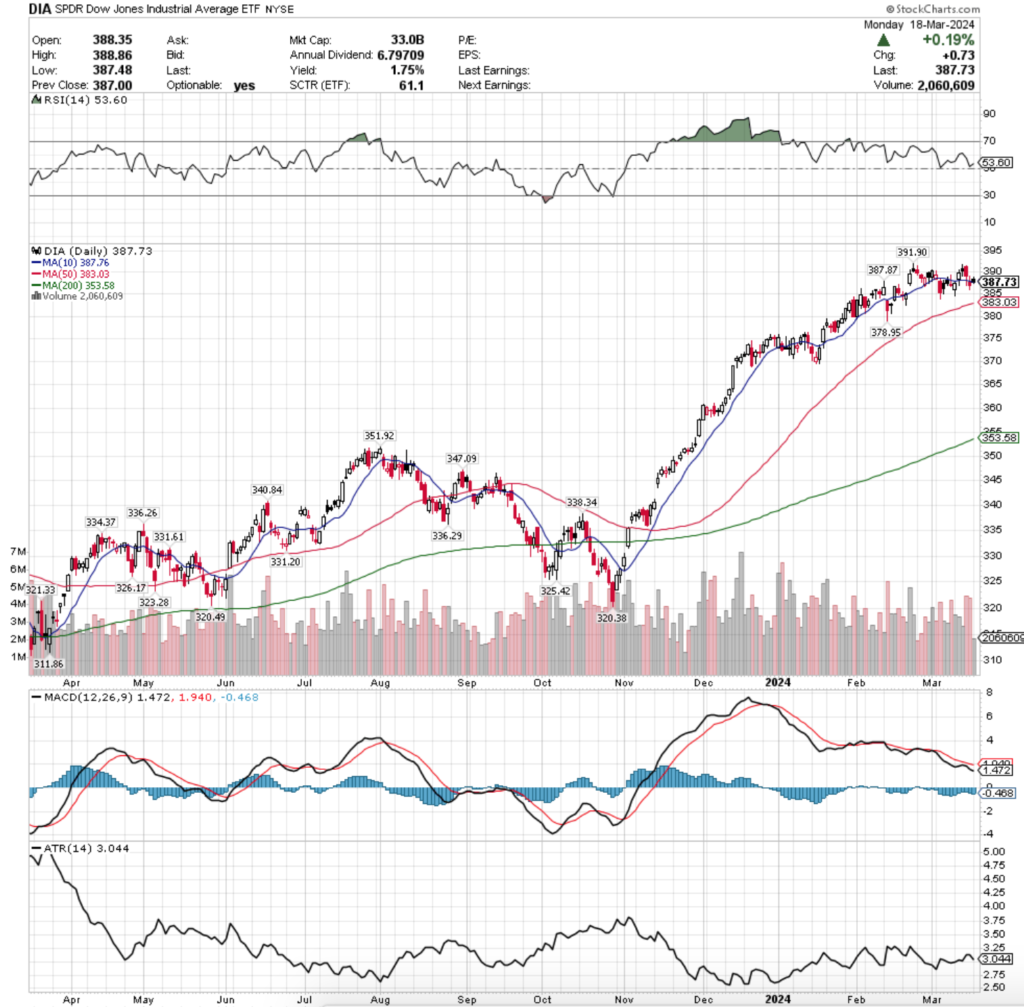
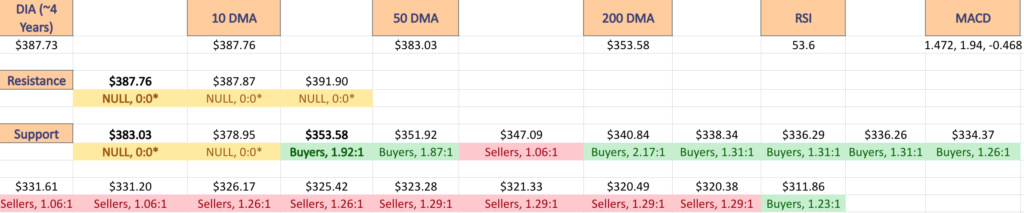
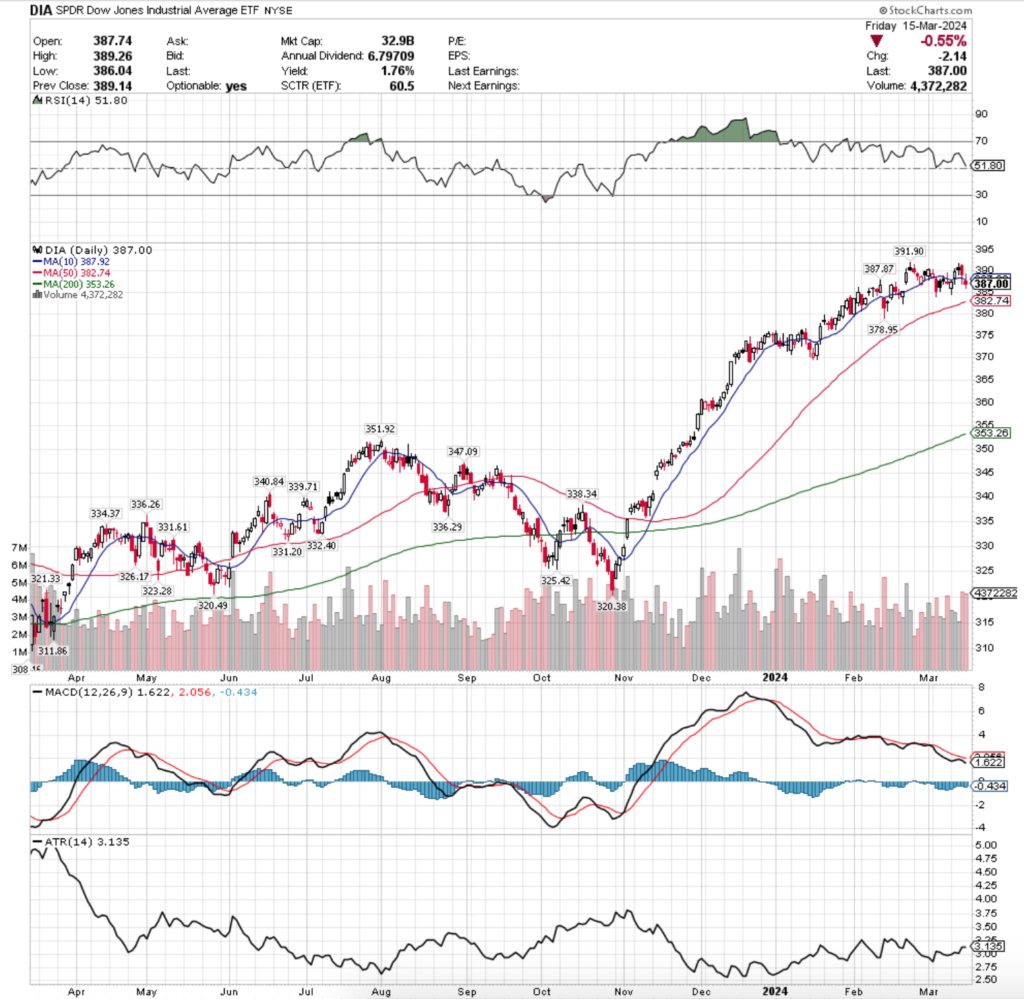
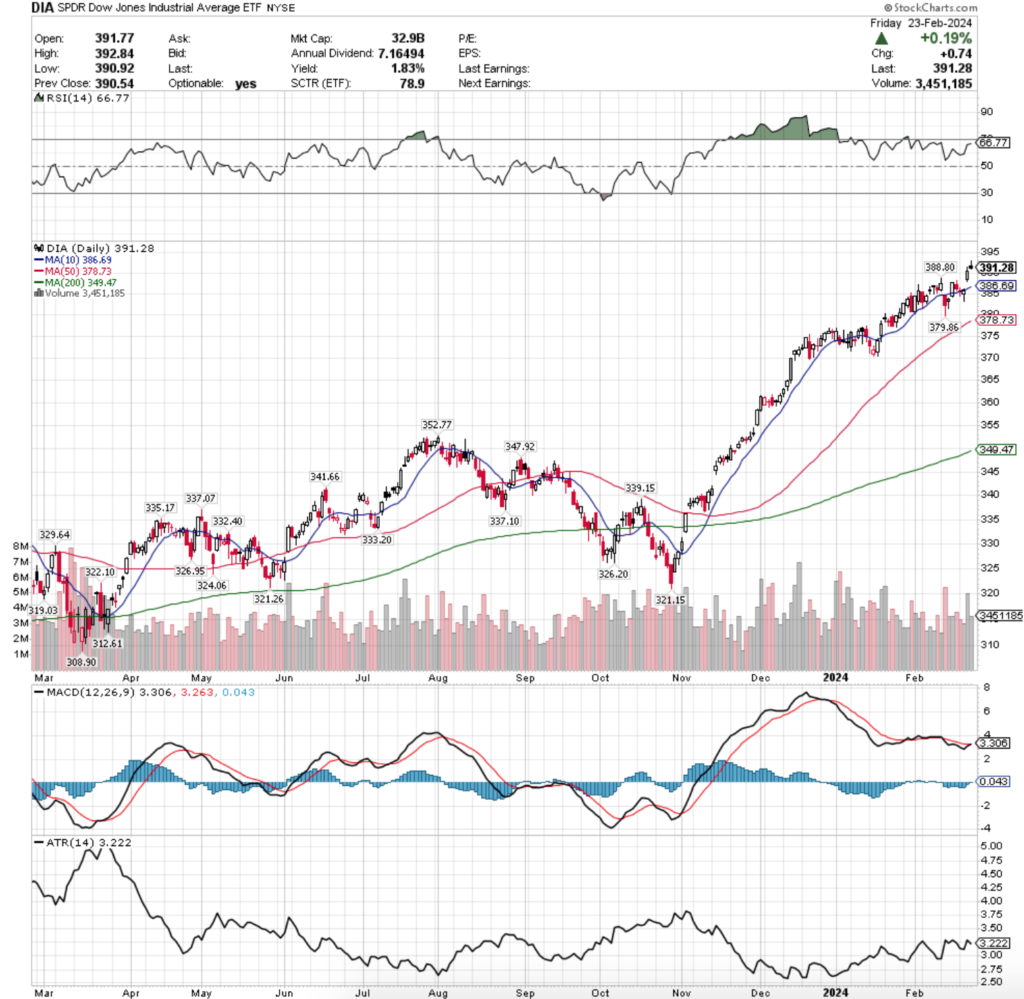
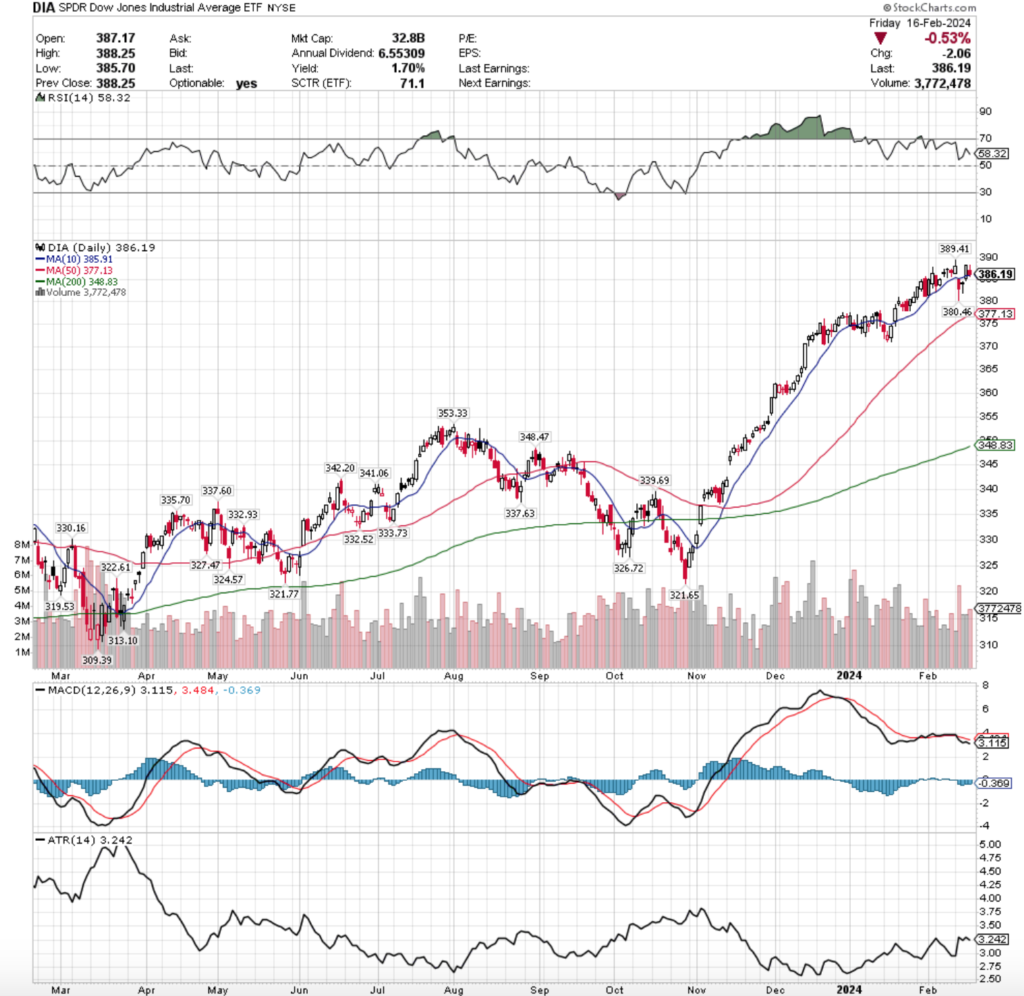
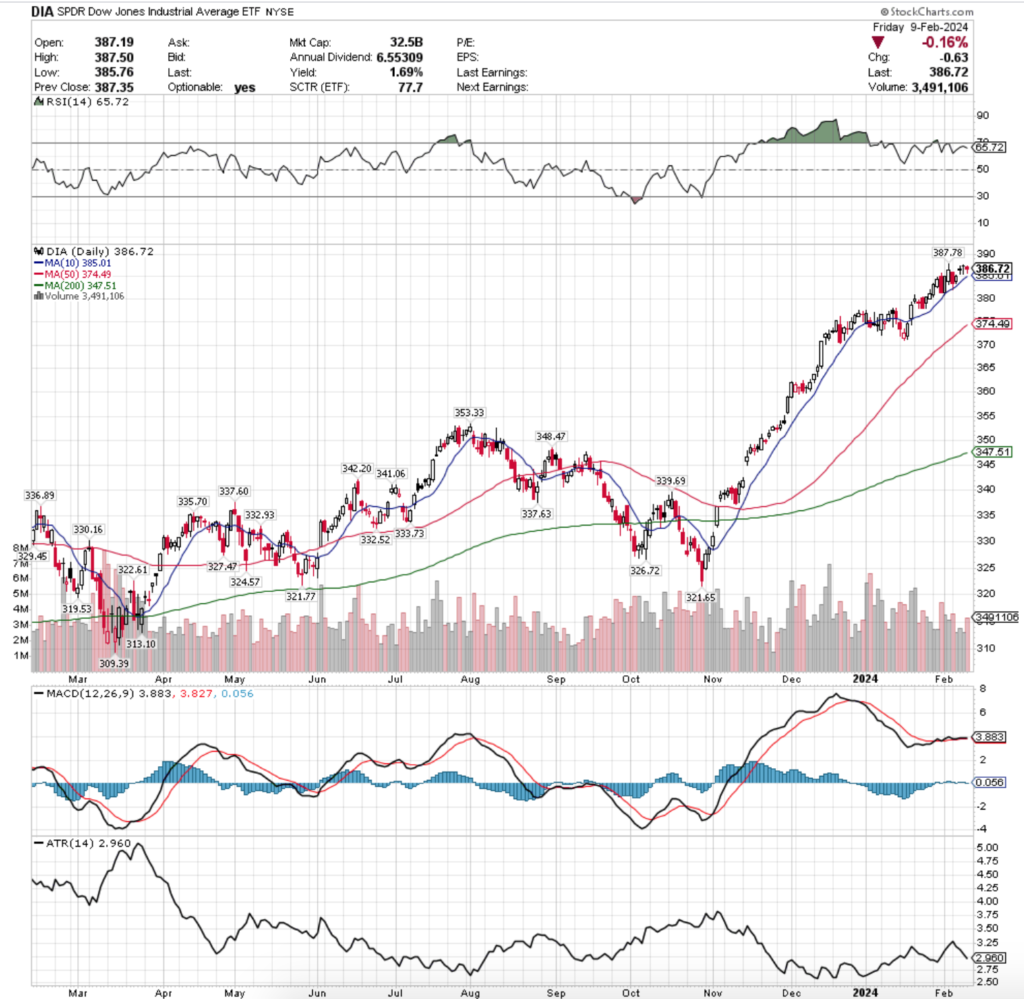
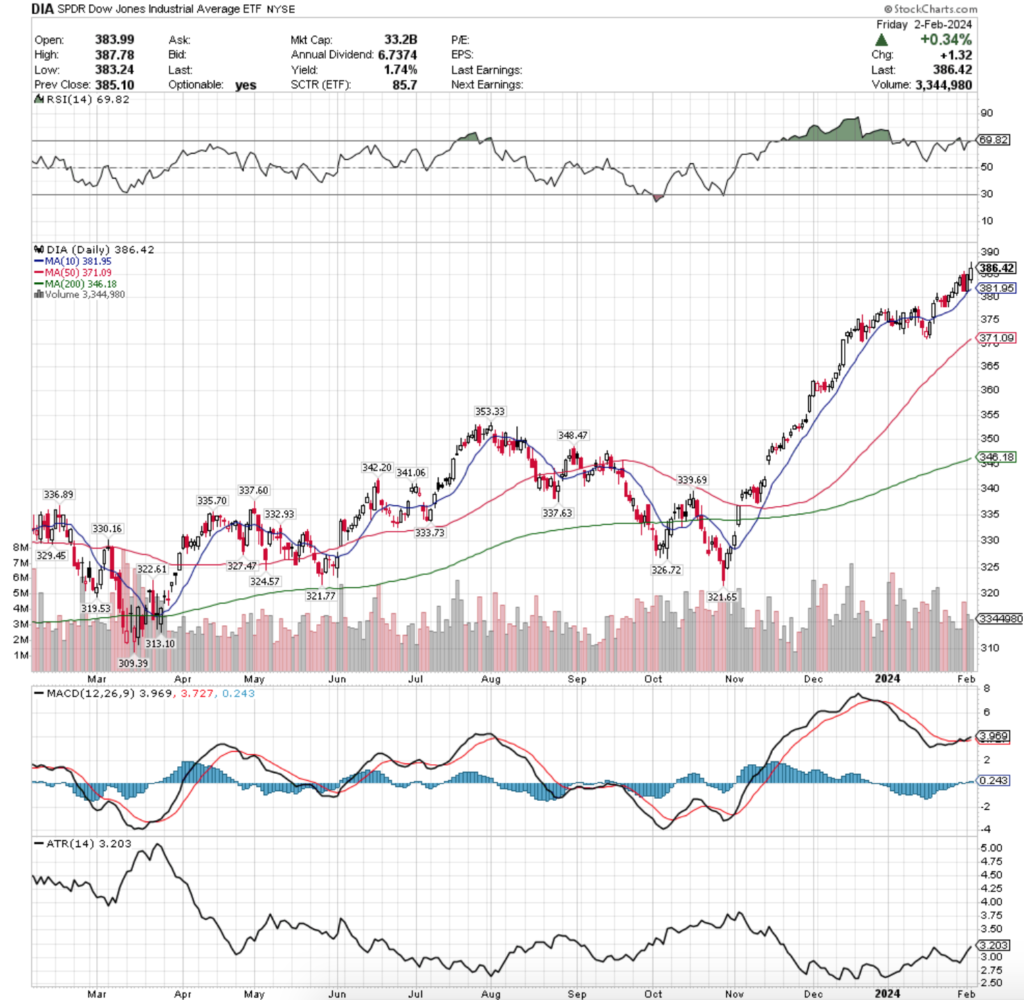
DIA, the SPDR Dow Jones Industrial Average ETF gained +0.82% last week, having the second strongest week of the big four indexes, behind only the small cap index Russell 2000 in weekly performance.
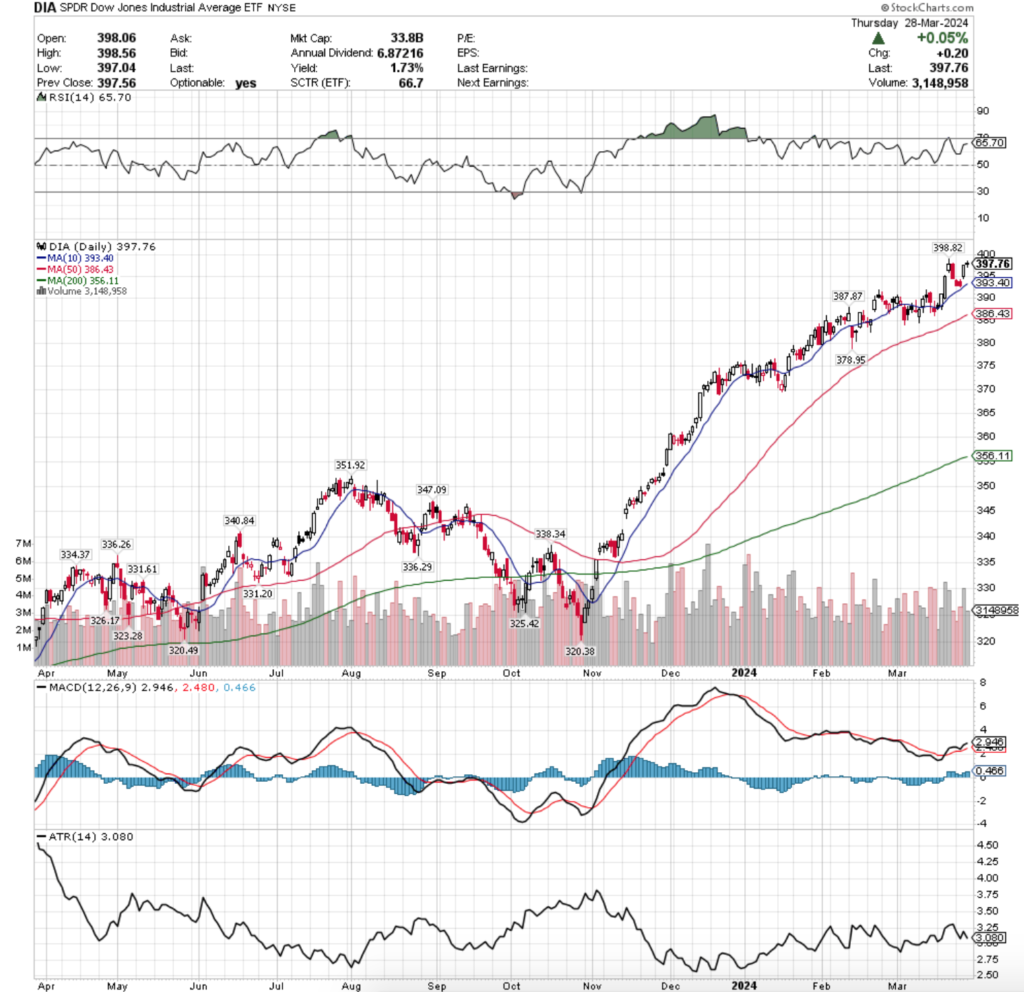
Their RSI has also recently plateaued, and currently sits at 65.7, while their MACD is still bullish.
Volumes were relatively in line with their average for the past year, coming in -0.79% below average for the week (3,378,175 vs. 3,405,069),
The week started off on a quiet, but downward note, as Monday’s session resulted in a gap down on muted volumes (lowest of the week).
Tuesday was also a declining day, but stayed in a similar range to Monday, but more market participants were involved in the session as the volume was higher than Monday’s.
It is worth noting that the 10 day moving average’s support was able to prop up prices for DIA on each of the two declining days.
Wednesday was the highest volume day of the week on a wide-range session that advanced higher, but Thursday’s close appears to have set the stage for an evening star pattern to form pending how DIA fares on Monday.
An evening star pattern is a bearish reversal pattern, which seems likely given the high price level DIA is trading at & all of the bullish volume late in the week before Thursday’s close on a doji that closed lower than it opened, signaling uncertainty, with a hint of bearishness.
In the event of the evening star pattern forming, it will be important to watch how the 10 & 50 DMAs function as support levels, as prices are just off of their 52-week high & there are limited other support levels near them.
Their Average True Range has been declining, but is near a reversal point from the past month, indicating that there may be an uptick in volatility in the coming weeks.
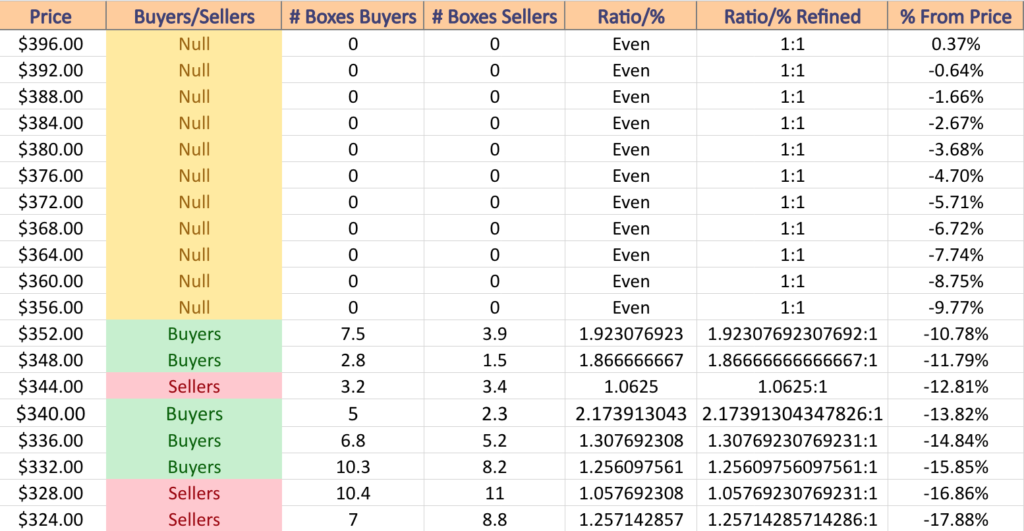
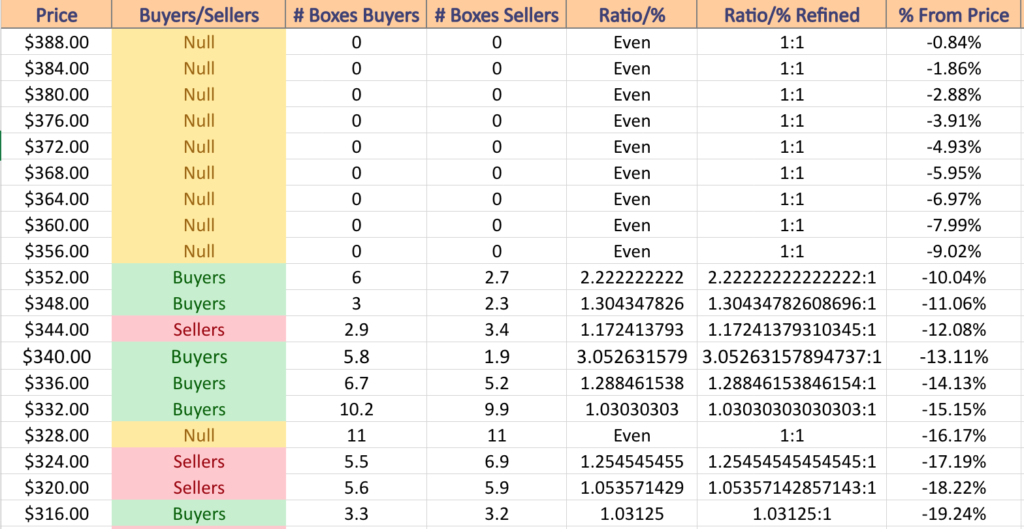
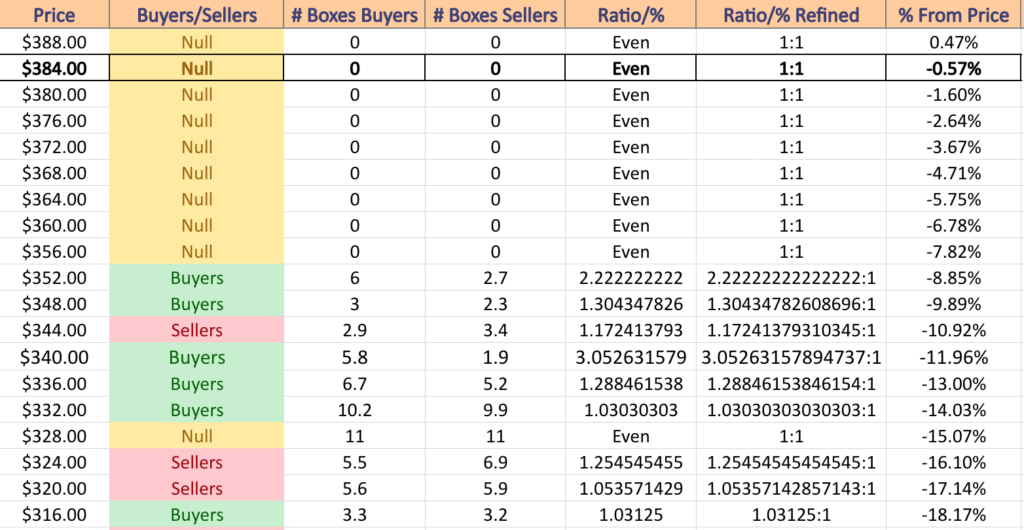
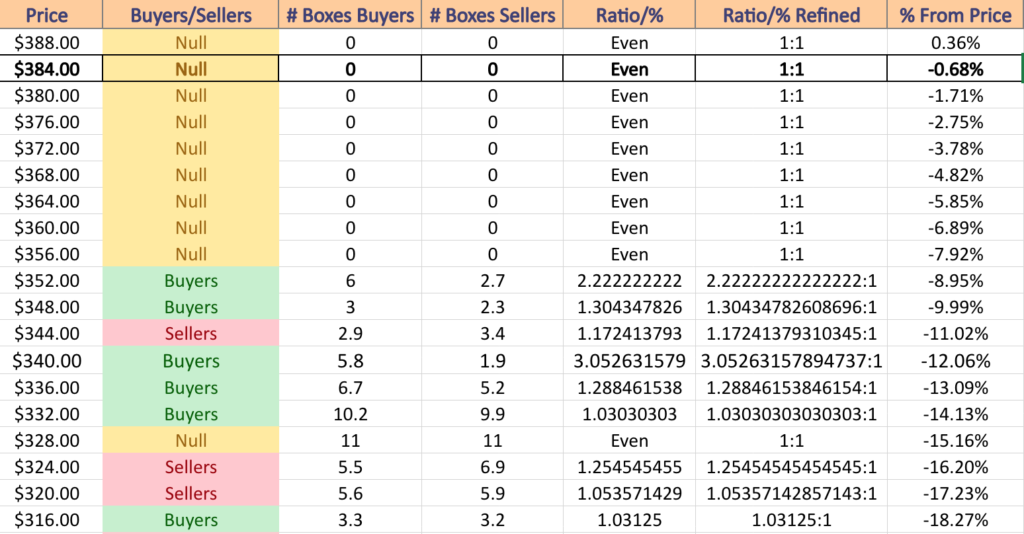
DIA has support at the $393.40 (10 Day Moving Average, Volume Sentiment: NULL, 0:0*), $387.87 (Volume Sentiment: NULL, 0:0*), $386.43 (50 Day Moving Average, Volume Sentiment: NULL, 0:0*) & $378.95/share (Volume Sentiment: NULL, 0:0*) price levels, with resistance at the $398.82/share (All-Time High, Volume Sentiment: NULL, 0:0*) price level.

The Week Ahead’s Events
Monday morning the week kicks off with S&P U.S. Manufacturing PMI (final) data at 9:45 am, followed by Construction Spending & ISM Manufacturing data at 10 am.
PVH is scheduled to report earnings after the closing bell on Monday.
Chicago Fed President Goolsbee speaks at 9:05 am on Tuesday, followed by Factory Orders & Job Openings data at 10 am, Cleveland Fed President Mester speaking at 12:05 pm & San Francisco Fed President Daly speaking at 1:30 pm.
Tuesday also has U.S. auto sales at a time that will be announced later.
Dave & Buster’s Entertainment is the headliner earnings report due Tuesday, with Paychex also reporting before the opening bell & Cal-Maine Foods scheduled to report after the session’s close.
ADP Employment data is released Wednesday at 8:15 am, followed by S&P U.S. Services PMI (Final) at 9:45 am, ISM Services data at 10 am & New York Fed President Williams moderating a discussion at 12 pm.
Acuity Brands is scheduled to report earnings before Wednesday’s session, with Levi Strauss, Resources Connection, Simulations Plus & Sportsman’s Warehouse all due to report earnings after the closing bell.
Thursday delivers Initial Jobless Claims & U.S. Trade Balance data at 8:30 am, followed by Philadelphia Fed President Harker speaking at 10 am, Chicago Feed President Gooslbee speaking at 12:45 pm & Cleveland Fed President Mester speaking at 2 pm.
Lamb Weston, Lindsay, Radius Recycling, RPM & Simply Good Foods are all due to report earnings before the opening bell on Thursday.
The week winds down Friday with U.S. Non-Farm Payrolls, U.S. Unemployment Rate, U.S. Hourly Wages & Hourly Wages Year-over-Year data at 8:30 am, followed by Consumer Credit data at 3pm.
Friday does not have any major earnings reports scheduled to be released.
See you back here next week!
*** I DO NOT OWN SHARES OR OPTIONS CONTRACT POSITIONS IN SPY, QQQ, IWM OR DIA AT THE TIME OF PUBLISHING THIS ARTICLE ***