Kroger Co. KR Stock Analysis

Kroger Co. stock trades under the ticker KR & has shown recent bullishness that traders & investors should research further into.

KR stock closed at $48.74/share on 7/7/2022.

Kroger Co. KR Stock’s Technical Performance Broken Down

Kroger Co. KR Stock's Technical Performance Over The Last Year

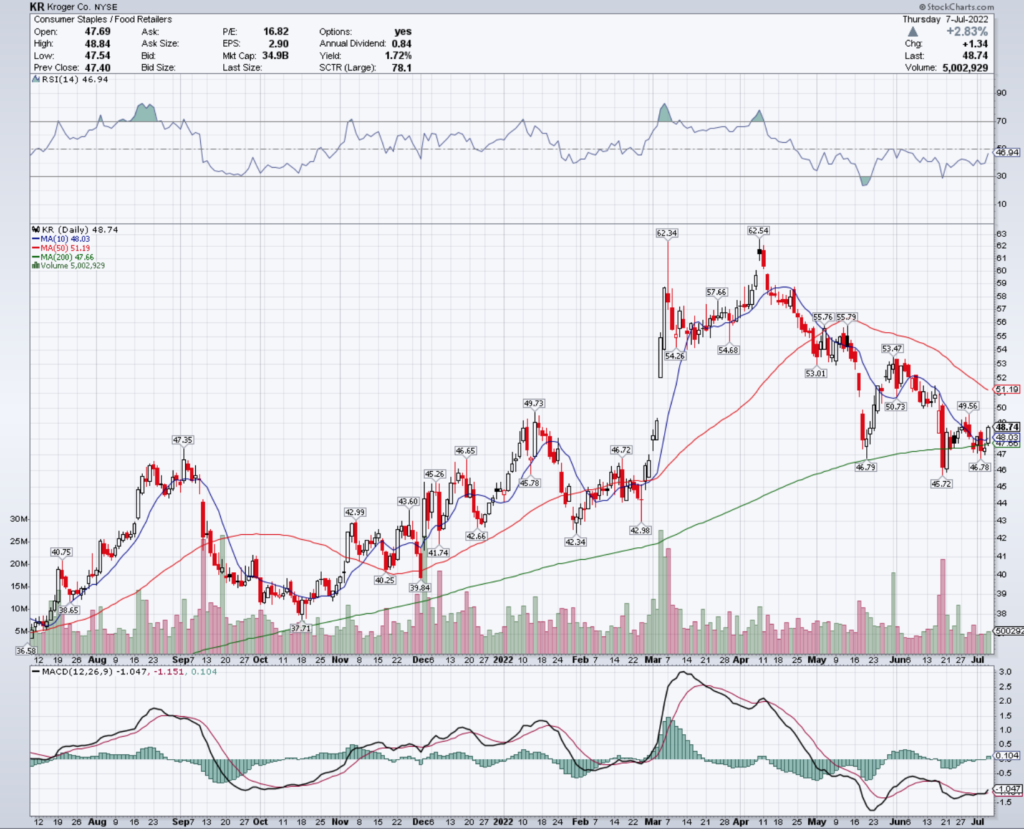
KR Stock Price: $48.74

10 Day Moving Average: $48.03

50 Day Moving Average: $51.19

200 Day Moving Average: $47.66

RSI: 46.94

MACD: -1.047

Yesterday, KR stock completed a bullish MACD crossover, closing above its 10 day moving average.

Their RSI is neutral, but their recent trading volume is light, showing a lack of confidence, but potential for more short-term gains.

They will need to break above the $49.56 & $50.73/share resistance levels as they continue to climb higher.

Kroger Co. KR Stock As A Long-Term Investment

Long-term oriented investors will like KR stock’s P/E (ttm) of 16.66, but may find their 3.66 P/B (mrq) to be a bit high.

They recently reported 8% Quarterly Revenue Growth Y-o-Y, with 374.3% Quarterly Earnings Growth Y-o-Y.

Their balance sheet needs to be further researched before an investment can be made, with $1.38B of Total Cash (mrq) & $20.75B of Total Debt (mrq).

KR stock pays a 1.77% dividend yield, which appears stable in the long-term, as their payout ratio is 28.03%.

82.74% of KR stock’s outstanding share float is owned by institutional investors.

Kroger Co. KR Stock As A Short-Term Trade Using Options

Short-term oriented traders can use options to hedge against volatility, while also profiting from movements in KR stock’s price.

I am looking at the contracts with the 7/15 expiration date.

The $48, $47 & $47.50 call options are all in-the-money, listed from most to least liquid strike price.

The $49, $50 & $51 puts are also in-the-money, listed from highest to lowest levels of open interest.

Tying It All Together

KR stock has many unique characteristics that traders & investors are sure to like.

Investors will like their dividend yield & recent growth, but may want to do more research into the structure of their balance sheet.

Traders will like their current technical set up, as well as the liquidity of their options.

Overall, it is worth taking a closer look to see how KR stock fits into your portfolio strategy.

*** I DO NOT OWN SHARES OF KR STOCK AT THE TIME OF PUBLISHING THIS ARTICLE ***

Reliance Steel & Aluminum RS Stock Analysis

Reliance Steel & Aluminum stock trades under the ticker RS & has recently shown bullish behavior that traders & investors should take a closer look into.

RS stock closed at $169.64/share on 7/6/2022.

Reliance Steel & Aluminum RS Stock’s Technical Performance Broken Down

Reliance Steel & Aluminum RS Stock's Technical Performance Over The Last Year

RS Stock Price: $169.64

10 Day Moving Average: $170.03

50 Day Moving Average: $185.05

200 Day Moving Average: $168.41

RSI: 41.03

MACD: -4.794

Yesterday, RS stock completed a bullish MACD crossover, settling right between their 10 & 200 day moving averages.

Their recent trading volume has been above average compared to the year prior, and their RSI is on the oversold side of neutral, signaling that there may be more momentum to come in the near-term.

They will need to break out above the $170.31 & $172.85 resistance levels as they continue to climb higher.

Reliance Steel & Aluminum RS Stock As A Long-Term Investment

Long-term oriented investors will like RS stock’s valuation metrics, with a 6.53 P/E (ttm) & a 1.62 P/B (mrq).

They recently reported Quarterly Revenue Growth Y-o-Y of 58%, with 96.1% Quarterly Earnings Growth Y-o-Y.

Their balance sheet will require a closer examination though, with $548M of Total Cash (mrq), and $1.86B of Total Debt (mrq).

RS stock pays a 1.73% dividend yield, which appears stable in the long-term with a 11.22% payout ratio.

85.41% of RS stock’s outstanding share float is owned by institutional investors.

Reliance Steel & Aluminum RS Stock As A Short-Term Trade Using Options

Short-term focused traders can use options to profit from price movements in RS stock, while hedging against broader market volatility.

I am looking at the contracts with the 7/15 expiration date.

The $145, $165 & $155 call options are all in-0the-money, listed in order of most to least liquid.

The $185, $170 & $180 puts are also all in-the-money, listed from highest to lowest levels of open interest.

Tying It All Together

RS stock has many unique attributes that traders & investors should find appealing.

Investors will like their valuation metrics & dividend yield, but may want to research their balance sheet further before making an investment.

Traders will like their current technical set up, but may wish their options were more liquid.

Overall, RS stock is worth taking a closer look into to see how it fits into your portfolio strategy.

*** I DO NOT OWN SHARES OF RS STOCK AT THE TIME OF PUBLISHING THIS ARTICLE ***

Suburban Propane Partners LP SPH Stock Analysis

Suburban Propane Partners LP stock trades under the ticker SPH & has shown recent bullishness that traders & investors should dig deeper into.

SPH closed at $15.50/share on 7/6/2022.

Suburban Propane Partners LP SPH Stock’s Technical Performance Broken Down

Suburban Propane Partners LP SPH Stock's Technical Performance Over The Last Year

SPH Stock Price: $15.50

10 Day Moving Average: $15.35

50 Day Moving Average: $16.40

200 Day Moving Average: $15.17

RSI: 45.23

MACD: -0.348

Yesterday, SPH stock completed a bullish MACD crossover, breaking out above its 10 day moving average.

Their RSI is neutral, and their recent trading volume is below average compared to the year prior, signaling that there may be additional momentum in the near-term.

They will need to break above the $15.93 & $16.02 price levels to continue climbing higher.

Suburban Propane Partners LP SPH Stock As A Long-Term Investment

Long-term oriented investors will find SPH stock’s valuation metrics appealing, with a 6.44 P/E (ttm) & a P/B (mrq) of 1.67.

They recently reported Quarterly Revenue Growth Y-o-Y of 9.5%, with 37.6% Quarterly Earnings Growth Y-o-Y.

Their balance sheet will require additional research before an investment can be made, with Total Cash (mrq) of $6.83M & $1.26B of Total Debt (mrq).

SPH stock pays an 8.64% dividend, which appears stable in the long-run with a 52.9% payout ratio.

20.41% of SPH stock’s outstanding share float is owned by institutional investors.

Suburban Propane Partners LP SPH Stock As A Short-Term Trade Using Options

Short-term oriented traders can use options to hedge against volatility, while profiting from SPH stock’s price movements.

I am looking at the contracts with the 8/19 expiration date.

The $15, $12.50 & $10 call options are all in-the-money, listed from highest to lowest levels of open interest.

The $17.50, $20 & $22.50 puts are also in-the-money, and are listed in order of most to least liquid.

Tying It All Together

SPH stock has many unique characteristics that traders & investors will find appealing.

Long-term oriented investors will like their dividend yield, as well as their valuation metrics, but will want to look deeper into the structure of their balance sheet.

Short-term focused traders will like their current technical performance, but may be disappointed at how liquid their options are.

Overall, it is worth taking a closer look into SPH stock to see how it fits into your portfolio strategy.

*** I DO NOT OWN SHARES OF SPH STOCK AT THE TIME OF PUBLISHING THIS ARTICLE ***

Carlisle Cos. Inc. CSL Stock Analysis

Carlisle Cos. Inc. stock trades under the ticker CSL & has shown recent bullish behavior that traders & investors should take a closer look into.

CSL stock closed at $246.43/share on 7/5/2022.

Carlisle Cos. Inc. CSL Stock’s Technical Performance Broken Down

Carlisle Cos. Inc. CSL Stock's Technical Performance Over The Past Year

CSL Stock Price: $246.43

10 Day Moving Average: $239.62

50 Day Moving Average: $249.82

200 Day Moving Average: $235.13

RSI: 50.86

MACD: -2.912

Yesterday, CSL stock completed a bullish MACD crossover, settling above its 10 day moving average.

With a neutral RSI & trading at about average volume recently, there may be more momentum to continue pushing higher in the near-term for CSL stock.

They will need to break above the $250.91/share resistance level as they continue to climb higher.

Carlisle Cos. Inc. CSL Stock As A Long-Term Investment

Long-term oriented investors will like CSL stock’s P/E (ttm) of 24.07, but may find their P/B (mrq) of 4.66 to be too high for their tastes.

They recently reported 59% Quarterly Revenue Growth Y-o-Y, with 270.9% Quarterly Earnings Growth Y-o-Y.

Their balance sheet will require a closer review before investing, with a reported $291.7M of Total Cash (mrq) & $2.93B of Total Debt (mrq).

CSL stock pays a 0.89% dividend yield, which appears stable in the long-term, as their payout ratio is 21.41%.

92.84% of CSL stock’s outstanding share float is owned by institutional investors.

Carlisle Cos. Inc. CSL Stock As A Short-Term Trade Using Options

Short-term oriented traders can use options to profit from CSL stock’s price movements, while protecting themselves from market volatility.

I am looking at the contracts with the 7/15 expiration date.

The $240 & $220 call options are both in-the-money, listed from most to least liquid.

The $260 & $250 puts are also in-the-money, listed from highest to lowest levels of open interest.

Tying It All Together

CSL stock has many interesting attributes that traders & investors are sure to find appealing.

Investors will like their dividend yield, as well as their P/E (ttm), but may want to review their balance sheet structure more closely before making an investment.

Traders will like their current technicals amidst a volatile market, but may be disappointed by the liquidity levels of their contracts.

All-in-all, it is worth taking a closer look to see how CSL stock fits into your portfolio strategy.

*** I DO NOT OWN SHARES OF CSL STOCK AT THE TIME OF PUBLISHING THIS ARTICLE ***

Marten Transport, Ltd. MRTN Stock Analysis

Marten Transport, Ltd. stock trades under the ticker MRTN & has recently shown bullish behavior that traders & investors should take a closer look into.

MRTN stock closed at $16.83/share on 7/5/2022.

Marten Transport, Ltd. MRTN Stock’s Technical Performance Broken Down

Marten Transport, Ltd. MRTN Stock's Technical Performance Over The Last Year

MRTN Stock Price: $16.83

10 Day Moving Average: $16.76

50 Day Moving Average: $17.36

200 Day Moving Average: $16.91

RSI: 46.36

MACD: -0.17

Yesterday, MRTN stock completed a bullish MACD crossover, settling just above its 10 day moving average.

Their RSI is still neutral, and their recent trading volumes have been below average for the year, signaling that there may be more momentum in the near-term, pending how broader indexes move.

They will need to break above the $17.03 resistance level to continue climbing higher.

Marten Transport, Ltd. MRTN Stock As A Long-Term Investment

Long-term focused investors will like MRTN stock’s P/E (ttm) of 14.91, but may find their P/B (mrq) to be a bit rich at 2.13.

They recently reported 28.8% Quarterly Revenue Growth Y-o-Y, with 52.9% Quarterly Earnings Growth Y-o-Y.

Their balance sheet reports $66.53M of Total Cash (mrq), with $538K of Total Debt (mrq), which investors will find appealing.

MRTN stock pays a 1.07% dividend, which appears stable in the long-term as their payout ratio is 15.93%.

70.73% of MRTN stock’s outstanding share float is owned by institutional investors.

Marten Transport, Ltd. MRTN Stock As A Short-Term Trade Using Options

Short-term focused traders can use options to profit from MRTN stock’s price movements, while hedging against market volatility.

There is limited liquidity in the July & August expiration dates, so I am looking at the contracts that expire on 9/16.

The $15 & $10 calls are both in-the-money, listed in order of most to least liquid.

The $20 & $17.50 puts are also both in the money, listed from highest to lowest open interest levels.

Tying It All Together

MRTN stock has many characteristics that traders & investors are sure to find appealing.

Investors will like their balance sheet & recent growth, but may be disappointed by their dividend yield.

Traders will like their current technical set up, but will be disappointed by how illiquid their options are.

Overall, it is worth researching how MRTN stock fits into your portfolio strategy.

*** I DO NOT OWN SHARES OF MRTN STOCK AT THE TIME OF PUBLISHING THIS ARTICLE ***

Occidental Petroleum Corp. OXY Stock Analysis

Occidental Petroleum Corp. stock trades under the ticker OXY & has shown recent bullish behavior that traders & investors should take a closer look into.

OXY stock closed at $59.11/share on 7/5/2022.

Occidental Petroleum Corp. OXY Stock’s Technical Performance Broken Down

Occidental Petroleum Corp. OXY Stock's Technical Performance Over The Last Year

OXY Stock Price: $59.11

10 Day Moving Average: $58.54

50 Day Moving Average: $61.97

200 Day Moving Average: $44.67

RSI: 45.93

MACD: -1.273

Yesterday, OXY stock completed a bullish MACD crossover, while settling just above its 10 day moving average.

Their RSI is still neutral & recent trading volumes have been above average compared to the year prior, signaling that there may be more momentum to come in the near-term.

They will need to break above the $60.44 & $63.87 resistance levels as they continue to climb higher.

Occidental Petroleum Corp. OXY Stock As A Long-Term Investment

Long-term oriented investors will like OXY stock’s P/E (ttm) of 9.14, but may think to dig deeper into their 3.74 P/B (mrq).

They recently reported 57.7% Quarterly Revenue Growth Y-o-Y.

Their balance sheet will require additional research before an investment is made, as their Total Cash (mrq) is $1.91B & their Total Debt (mrq) is $27.7B.

OXY stock pays a 0.26% dividend, which appears to be very stable in the long-term as their payout ratio is only 2.42%.

83.3% of OXY stock’s outstanding share float is owned by institutional investors.

Occidental Petroleum Corp. OXY Stock As A Short-Term Trade Using Options

Traders focused on the short-term can use options to hedge against market volatility, while profiting from movements in OXY stock’s price.

I am looking at the contracts with the 7/15 expiration date.

The $57.50, $59 & $56 calls are all in-the-money, listed in order of highest to lowest open interest.

The $62.50, $60 & $62 puts are also in-the-money, also listed in order of most to least liquid.

Tying It All Together

OXY stock has many characteristics that traders & investors should find appealing.

Investors will like their recent growth & their P/E (ttm), but may be disappointed by their balance sheet & low dividend.

Traders will like the liquidity of their options, as well as their relative technical strength compared to the rest of the market.

Overall, it is worth looking to see if OXY stock fits into your portfolio strategy.

*** I DO NOT OWN SHARES OF OXY STOCK AT THE TIME OF PUBLISHING THIS ARTICLE ***

SpartanNash Company SPTN Stock Analysis

SpartanNash Company stock trades under the ticker SPTN & has recently shown bullishness amidst broader market volatility that traders & investors should research further into.

SPTN stock closed at $30.63/share on 7/1/2022.

SpartanNash Company SPTN Stock’s Technical Performance Broken Down

SpartanNash Company SPTN Stock's Technical Performance Over The Last Year

SPTN Stock Price: $30.63

10 Day Moving Average: $30.07

50 Day Moving Average: $32.66

200 Day Moving Average: $27.73

RSI: 45.13

MACD: -0.796

On Friday, SPTN stock completed a bullish MACD crossover, trading on above average volume compared to the year prior.

Their RSI is still on the lower range of neutral, and their price broke above the 10 day moving average, signaling that there may be more near-term momentum to come.

They will need to break above the $30.87 & $31.10 resistance levels as they continue climbing higher.

SpartanNash Company SPTN Stock As A Long-Term Investment

Long-term oriented investors will like SPTN stock’s valuation metrics, with a 15.01 P/E (ttm) & a 1.39 P/B (mrq).

They recently reported 4% Quarterly Revenue Growth Y-o-Y, with -1.2% Quarterly Earnings Growth Y-o-Y.

Their balance sheet will require a more thorough review before investing, with $16.33M of Total Cash (mrq) & $749.61M of Total Debt (mrq).

SPTN stock pays a 2.64% dividend yield, which appears stable in the long-term with a 39.7% payout ratio.

89.4% of SPTN stock’s outstanding share float is owned by institutional investors.

SpartanNash Company SPTN Stock As A Short-Term Trade Using Options

Traders who are focused on short-term price movements can use SPTN stock’s options to hedge against volatility, while also profiting from their price movements.

I am looking at the contracts with the 7/15 expiration date.

The $30, $25 & $22.50 call options are all in-the-money, listed from highest to lowest levels of open interest.

The $35 & $40 puts are also in-the-money, listed in order of most to least liquid.

Tying It All Together

SPTN stock has many interesting characteristics that investors & traders should find appealing.

Investors will like their valuation metrics & dividend yield, but may want to look closer into how their balance sheet is structured.

Traders will like their current momentum, but may be disappointed by how liquid their options are.

Overall, it is worth researching how SPTN stock fits into your portfolio strategy.

*** I DO NOT OWN SHARES OF SPTN STOCK AT THE TIME OF PUBLISHING THIS ARTICLE ***

C.H. Robinson Worldwide, Inc. CHRW Stock

C.H. Robinson Worldwide, Inc. stock trades under the ticker CHRW & has shown recent bullishness that traders & investors should research further.

CHRW stock closed at $102.06/share on 7/1/2022.

C.H. Robinson Worldwide, Inc. CHRW Stock’s Technical Performance Broken Down

C.H. Robinson Worldwide, Inc. CHRW Stock's Technical Performance Over The Last Year

CHRW Stock Price: $102.06

10 Day Moving Average: $101.54

50 Day Moving Average: $104.62

200 Day Moving Average: $99.24

RSI: 47.62

MACD: -0.888

On Friday, CHRW stock completed a bullish MACD crossover, on below average volume compared to the year prior.

Their RSI is still on the lower side of neutral, and they will need to find support above their 10 day moving average to keep up their current momentum.

They will need to break above the $102.07 & $103.14 resistance levels to continue climbing higher in the near-term.

C.H. Robinson Worldwide, Inc. CHRW Stock As A Long-Term Investment

Long-term oriented investors will like CHRW stock’s 14.42 P/E (ttm), but will find their P/B (mrq) to be a bit high at 6.2.

They recently reported 41.9% Quarterly Revenue Growth Y-o-Y, with 56% Quarterly Earnings Growth Y-o-Y.

Their balance sheet will require a closer examination before making an investment, with $242.81M of Total Cash (mrq) reported & $2.48B of Total Debt (mrq).

CHRW stock pays a 2.08% dividend yield, which looks stable in the long-term, as their payout ratio is 29.94%.

96.45% of CHRW stock’s outstanding share float is owned by institutional investors.

C.H. Robinson Worldwide, Inc. CHRW Stock As A Short-Term Trade Using Options

Short-term oriented traders can use options to profit from price movements in CHRW stock, while protecting their portfolios from broader market volatility.

I am looking at the contracts with the 7/15 expiration date.

The $100, $97.50 & $90 calls are all in-the-money, listed from most to least liquid strike price.

The $105, $110 & $120 puts are also all in-the-money, and are ordered by highest to lowest levels of open interest.

Tying It All Together

CHRW stock is worth taking a closer look at for investors & traders alike.

Investors will like their dividend yield & recent growth, but may want to look closer into the structure of their balance sheet before investing.

Traders will like their current technical set up, but may be disappointed that the most liquid strike prices among their options are out-of-the-money.

Overall, it is worth researching how CHRW stock can fit into your portfolio strategy.

*** I DO NOT OWN SHARES OF CHRW STOCK AT THE TIME OF PUBLISHING THIS ARTICLE ***

Exelon Corp. EXC Stock Analysis

Exelon Corp. stock trades under the ticker EXC & has shown recent bullishness that traders & investors should research further into.

EXC stock closed at $44.34/share on 6/29/2022.

Exelon Corp. EXC Stock’s Technical Performance Broken Down

Exelon Corp. EXC Stock's Technical Performance Over The Last Year

EXC Stock Price: $44.34

10 Day Moving Average: $42.53

50 Day Moving Average: $46.56

200 Day Moving Average: $41.34

RSI: 46.66

MACD: -1.123

Yesterday, EXC stock completed a bullish MACD crossover, trading on below average volume compared to the year prior.

Their RSI is still on the lower side of neutral, signaling that there could be more momentum in the near-term.

They will need to break above the $44.41, $45.40 & $45.74/share resistance levels as they continue to climb higher.

Exelon Corp. EXC Stock As A Long-Term Investment

Long-term oriented investors will like EXC stock’s P/E (ttm) of 25.82 & their P/B (mrq) of 1.83.

They recently reported Quarterly Revenue Growth Y-o-Y of 15%.

Their balance sheet will require a more thorough examination, with $2.48B of Total Cash (mrq) & $39.45B of Total Debt (mrq).

EXC stock pays a 3.39% dividend yield, which may not be sustainable in the long-run, as their payout ratio is 87.4%.

84.4% of EXC stock’s outstanding share float is owned by institutional investors.

Exelon Corp. EXC Stock As A Short-Term Trade Using Options

Traders focused on the short-term can trade options to hedge against market volatility, while also profiting from price movements in either direction for EXC stock.

I am looking at the contracts with the 7/15 expiration date.

The $43, $44 & $42 call options are all in-the-money, listed in order of highest to lowest open interest.

The $45, $48 & $49 puts are also all in-the-money, also listed from highest to lowest liquidity levels per strike.

Tying It All Together

Exelon Corp. stock has many interesting characteristics that traders & investors are sure to like.

Investors will like their valuation metrics & dividend yield, but may want to research deeper into the structure of their balance sheet to see how sustainable their dividend is in the longer-term.

Traders will like their current momentum, but will be disappointed that their most liquid strike prices are all out-of-the-money.

Overall, it is worth taking a closer look into EXC stock to see how it fits into your portfolio strategy.

*** I DO NOT OWN SHARES OF EXC STOCK AT THE TIME OF PUBLISHING THIS ARTICLE ***

Fortis Inc. FTS Stock Analysis

Fortis Inc. stock trades under the ticker FTS & has recently shown bullish behavior that traders & investors should take a closer look into.

FTS stock closed at $47.67/share on 6/28/2022.

Fortis Inc. FTS Stock’s Technical Performance Broken Down

Fortis Inc. FTS Stock's Technical Performance Over The Last Year

FTS Stock Price: $47.67

10 Day Moving Average: $45.84

50 Day Moving Average: $48.55

200 Day Moving Average: $46.24

RSI: 50.86

MACD: -0.767

Yesterday, FTS stock completed a bullish MACD crossover, on their sixth straight day of gains.

With a neutral RSI & recent trading volumes being above average for the year, there looks to be more bullish momentum in the near-term.

They will need to break above the $47.70 & $49.48 price levels as they continue climbing.

Fortis Inc. FTS Stock As A Long-Term Investment

Long-term oriented investors will like FTS stock’s valuation metrics, with a 23.74 P/E (ttm) & a 1.65 P/B (mrq).

They recently reported 11.7% Quarterly Revenue Growth Y-o-Y, with -1.3% Quarterly Earnings Growth Y-o-Y.

Their balance sheet will require a more thorough review before investing, with $365M of Total Cash (mrq) & $26.25B of Total Debt (mrq).

FTS stock pays a 4.41% dividend yield, which may not be sustainable in the longer-run, with a 80.3% payout ratio.

54.55% of FTS stock’s outstanding share float is owned by institutional investors.

Fortis Inc. FTS Stock As A Short-Term Trade Using Options

Traders who are focused on the short-term can use options to profit from FTS stock’s price movements, while hedging against broader market volatility.

I am looking at the contracts with the 7/15 expiration date.

The $45 calls are in-the-money, with the only other strike prices with open interest being out-of-the-money ($50 & $55).

They currently have no in-the-money puts, as the only strikes with open interest are $40 & $45.

Tying It All Together

FTS stock has many interesting characteristics that traders & investors are sure to find appealing.

Investors will like their valuation metrics & dividend yield, but will want to review their balance sheet closer before making an investment.

Traders will like their recent momentum, but will be disappointed by how illiquid their options contracts are.

Overall, it is worth taking a closer look at FTS stock to see how it fits into your portfolio strategy.

*** I DO NOT OWN SHARES OF FTS STOCK AT THE TIME OF PUBLISHING THIS ARTICLE ***