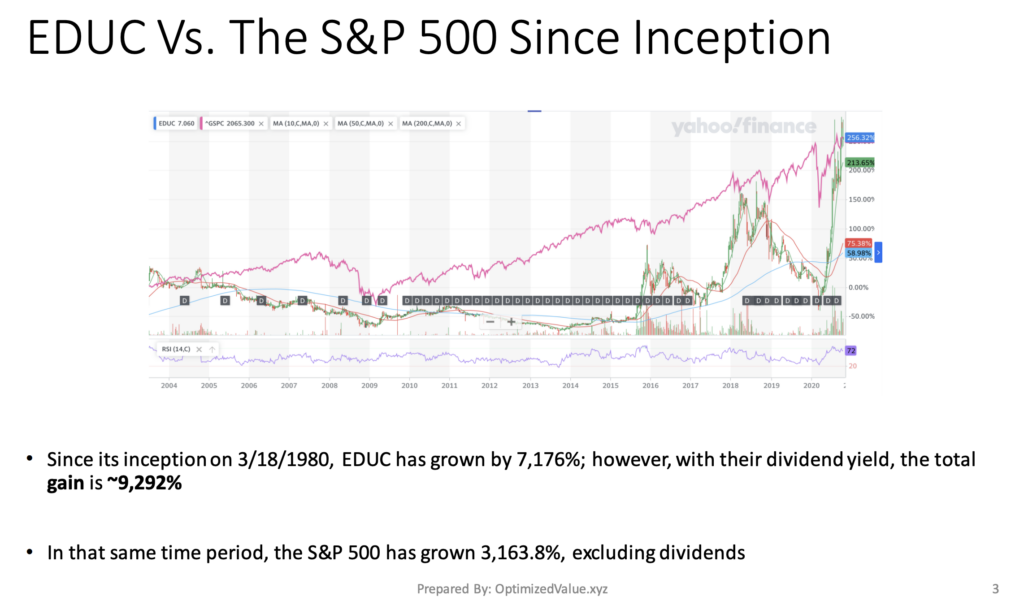
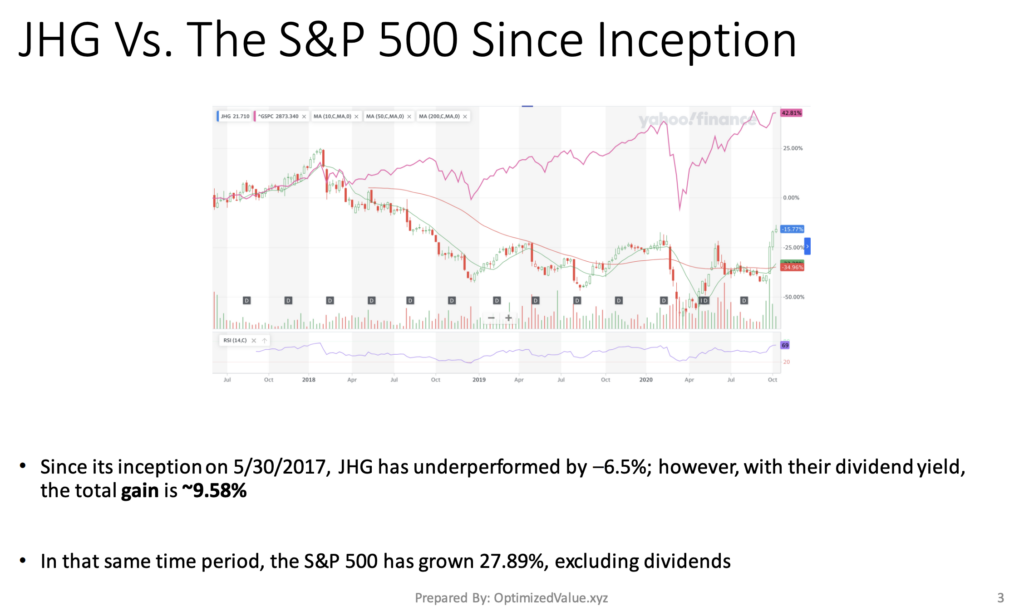
NVIDIA Corp. has been one of the stock market’s biggest darlings this year, climbing +275.53% since their 52-week low n October of 2022.
Their share price has been in a relatively consistent upward trajectory since October, with a only a few hiccups along the way.
NVDA is also a major holding in many ETFs that have been performing well this year, including SOXL (8.81%, per prospectus), USD (29.6%), SMH (17.3%) & many others.
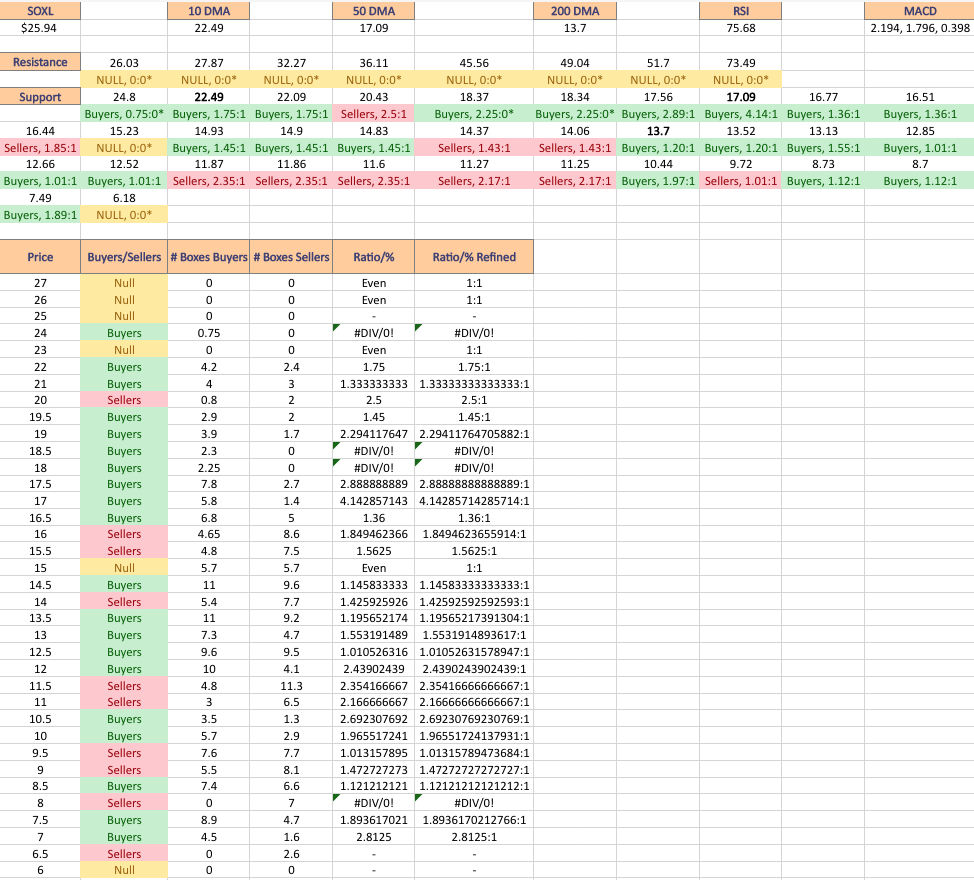
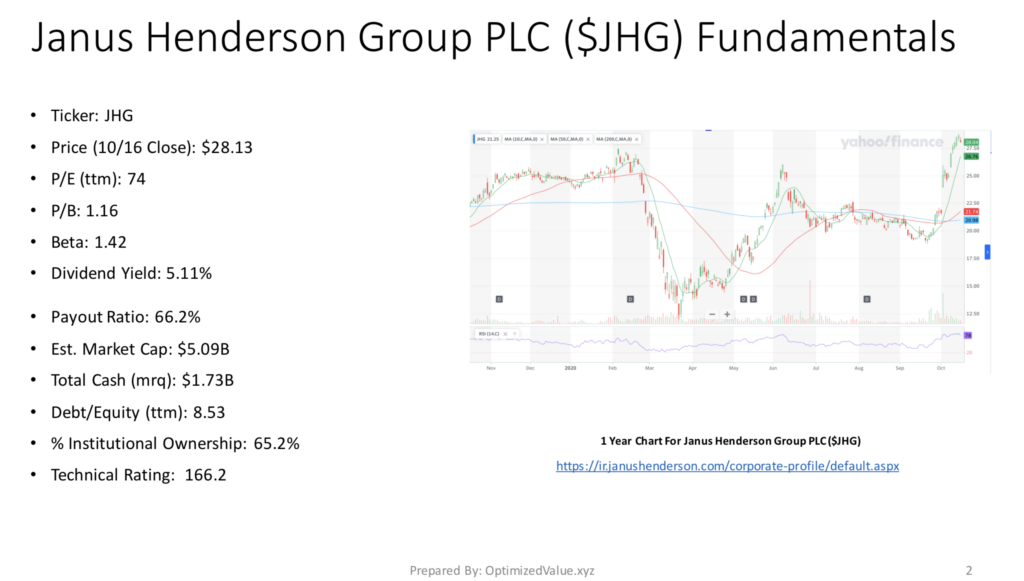
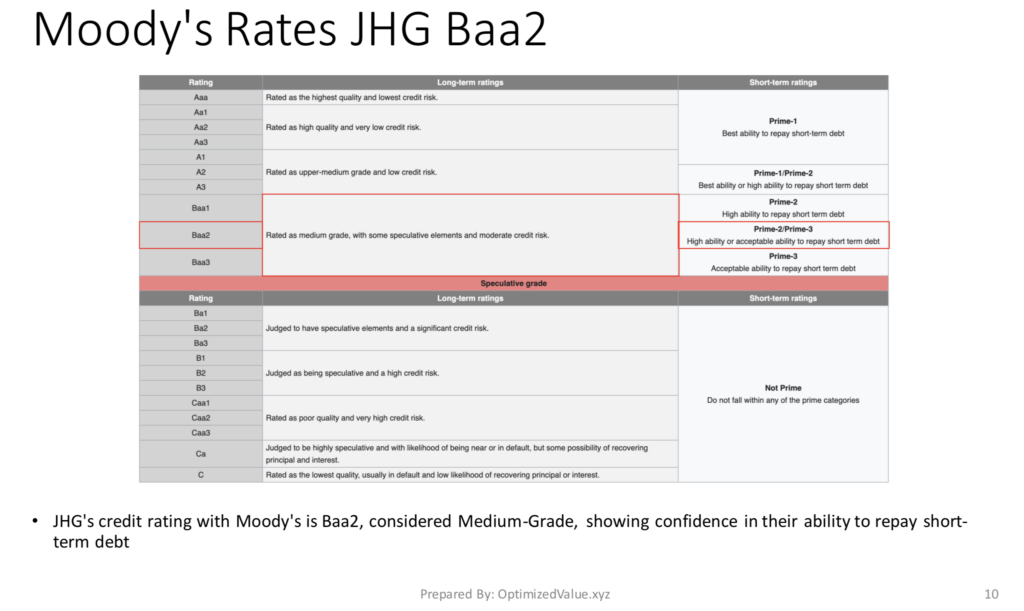
The Price:Volume analysis seeks to display the volume at specific share-price levels from over the past year & is intended to serve as a reference point for how investors viewed NVDA stock’s value at each level.
It also includes a list of moving averages, as well as support & resistance levels, which will be marked in bold.
NVIDIA Corp. NVDA Stock’s Price:Volume Sentiment Broken Down
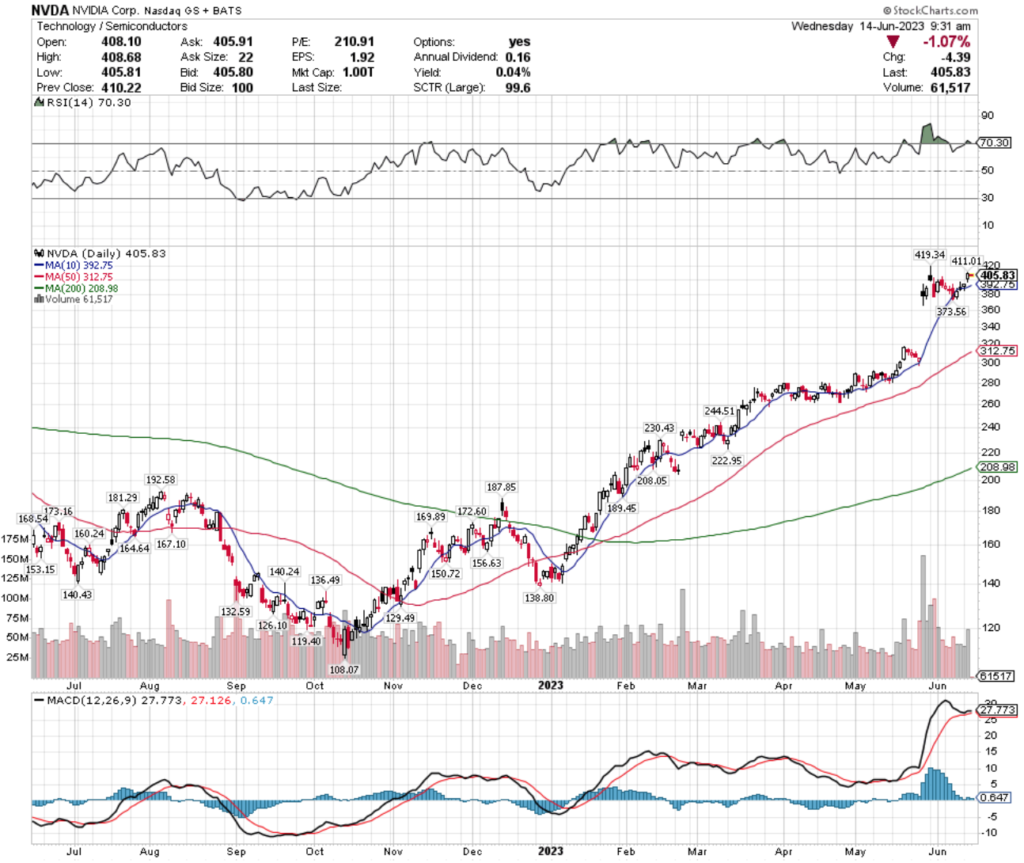
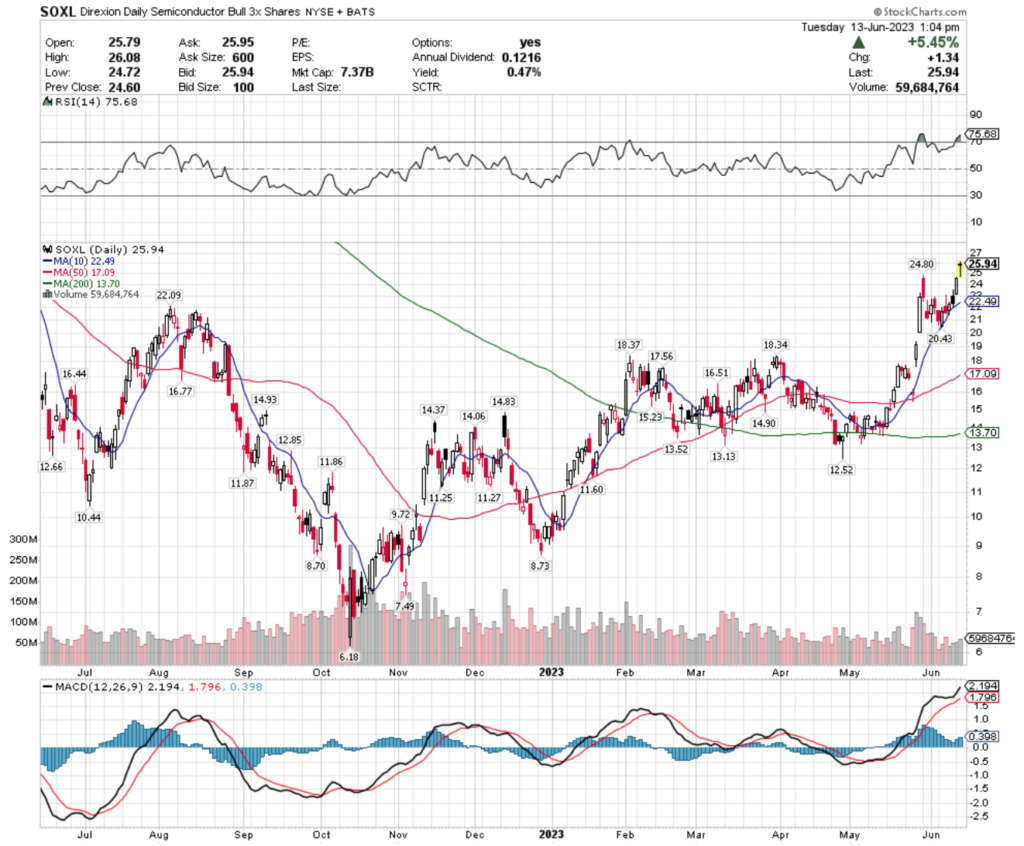
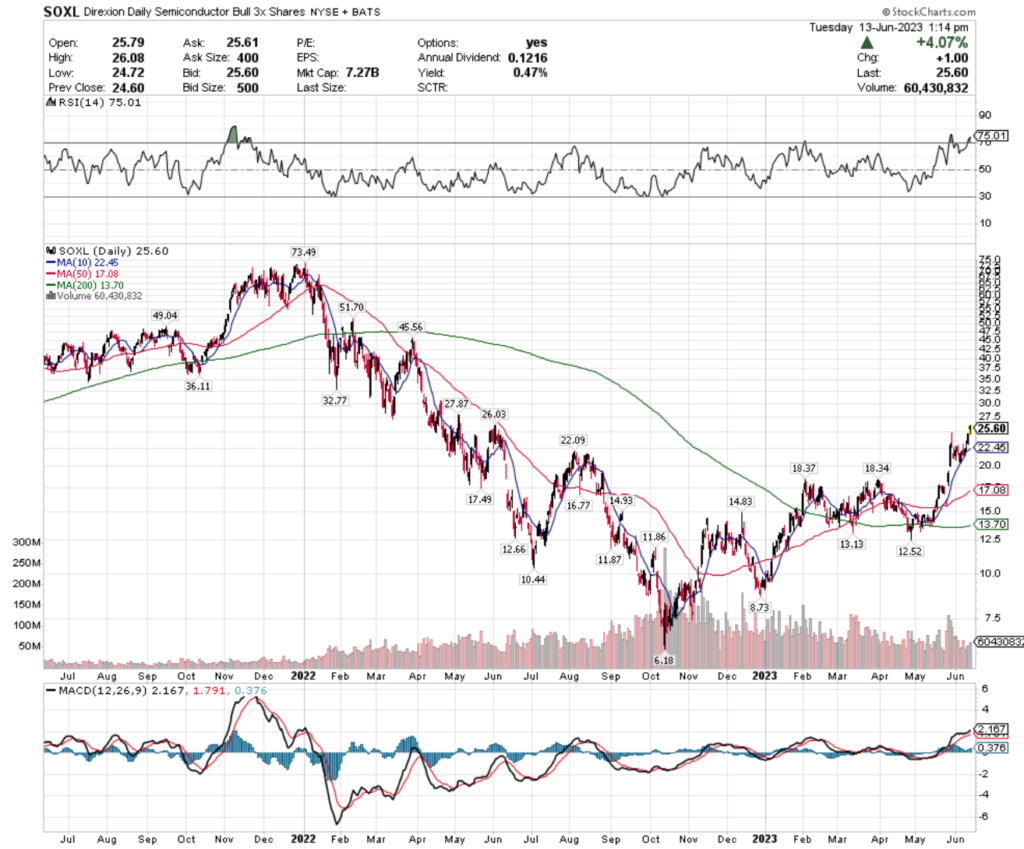
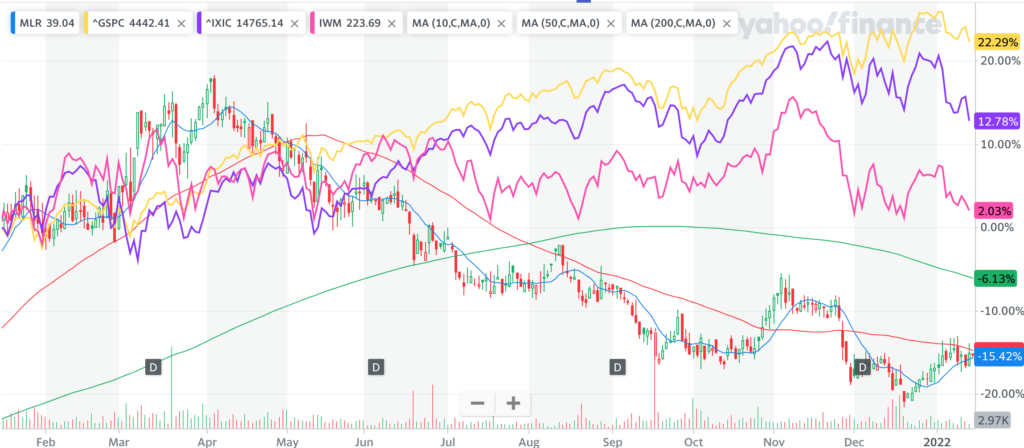
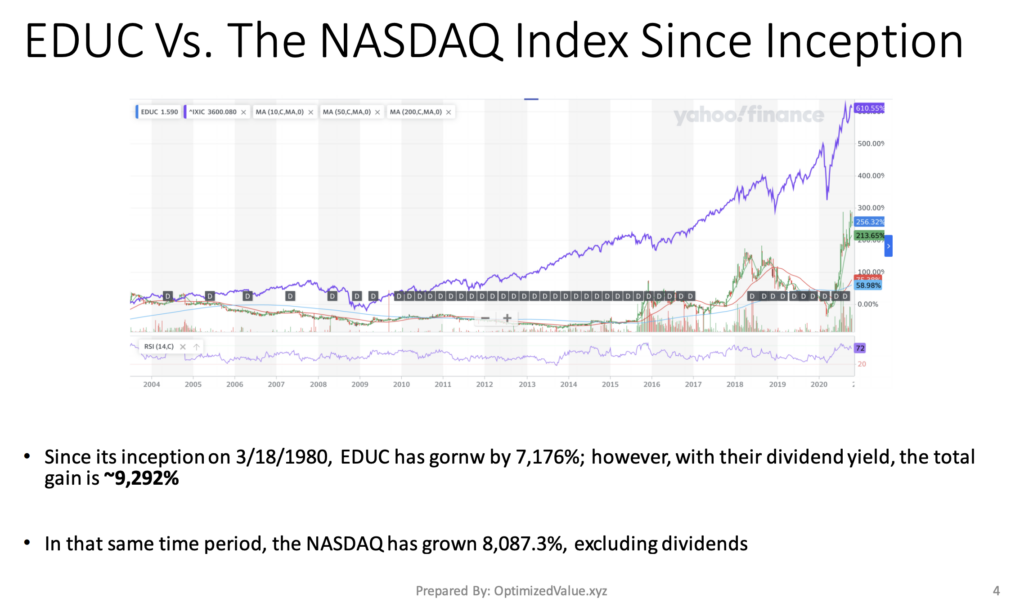
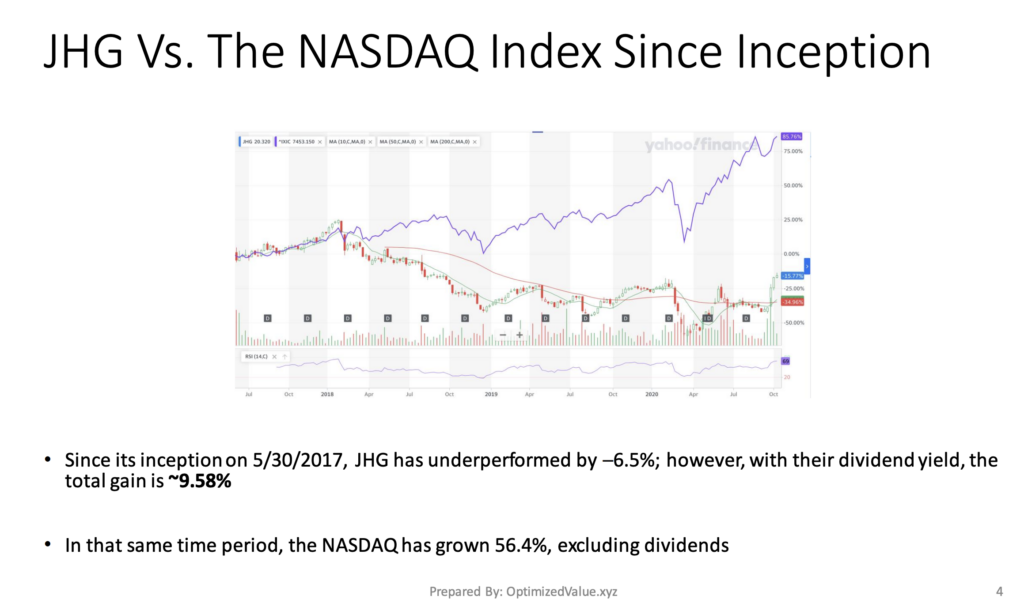
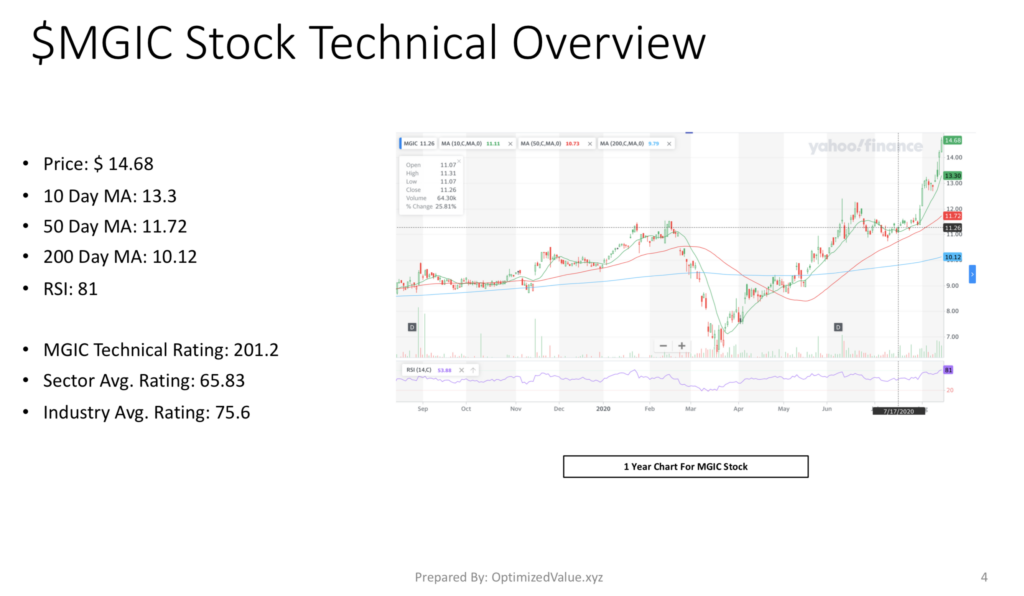
As the chart shows, NVDA has had an excellent year, which was pumped up even higher by a gap up at the end of May.
Their RSI is currently overbought at 70.3 & their MACD is still bullish, but has cooled off in the past week as their price consolidated around the gap up’s range.
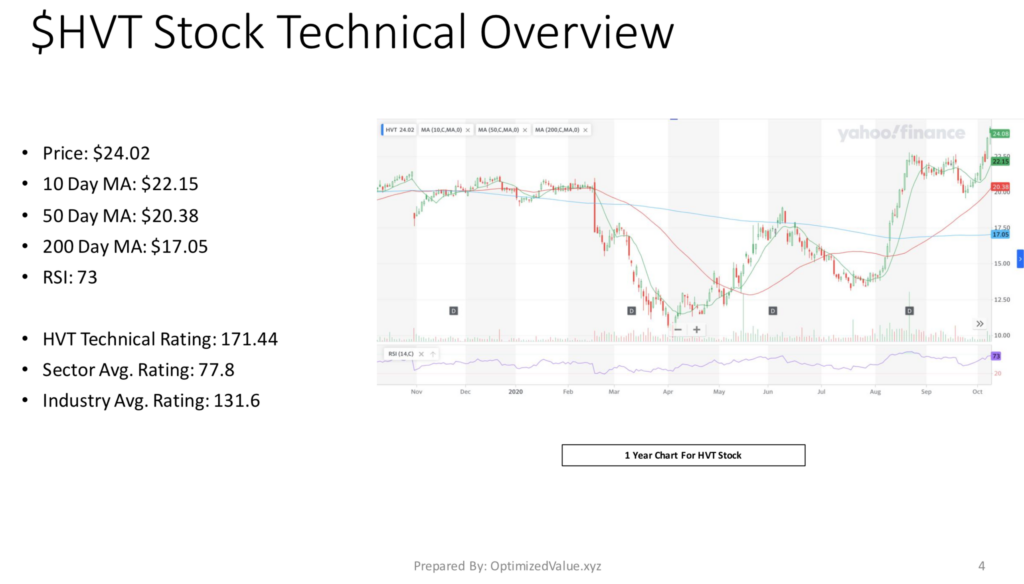
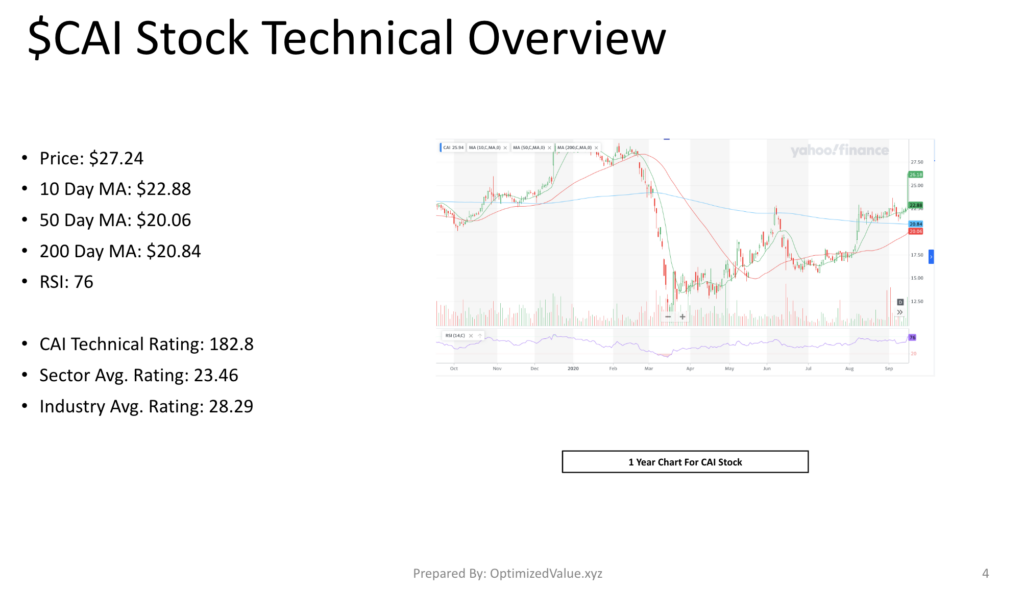
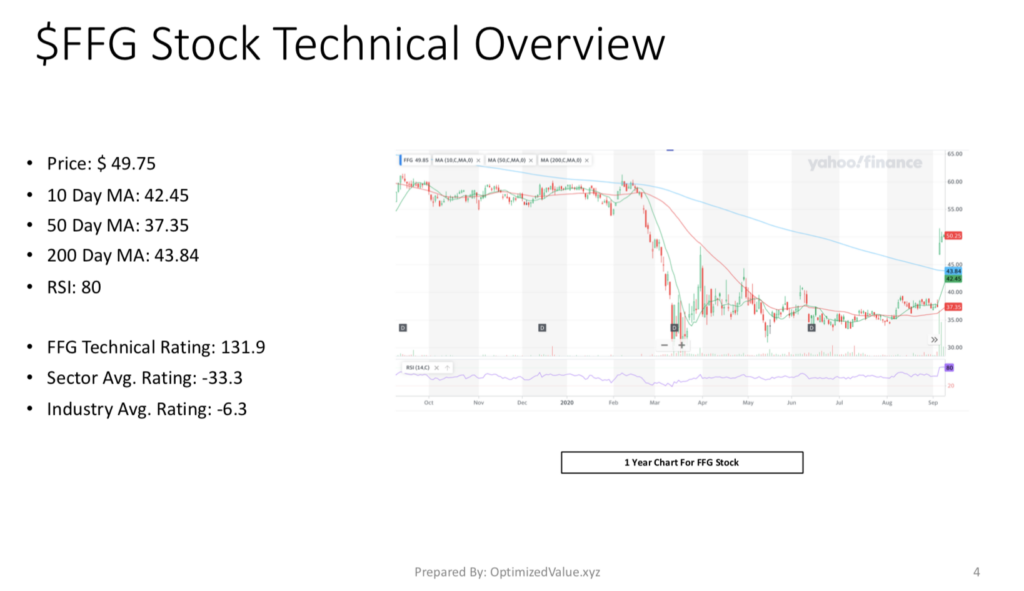
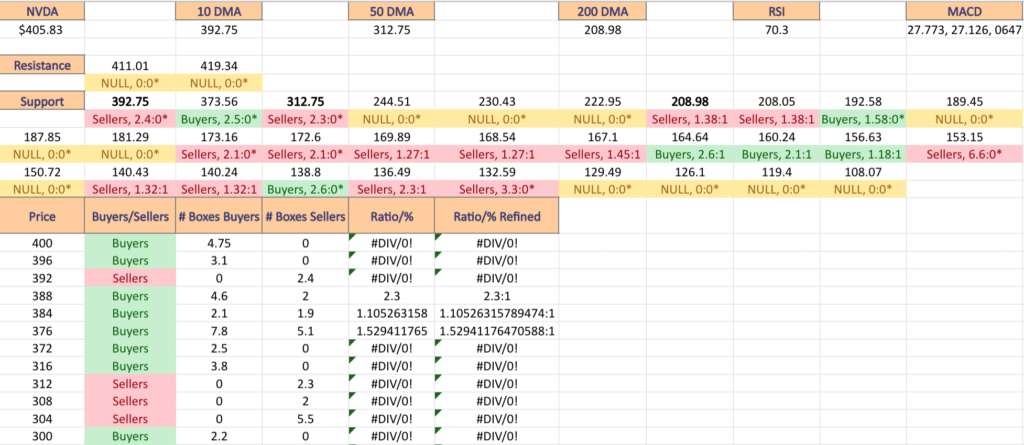
NVDA stock’s 10 Day Moving Average is $392.75, their 50 Day Moving Average is $312.75 & their 200 Day Moving Average is $208.98.
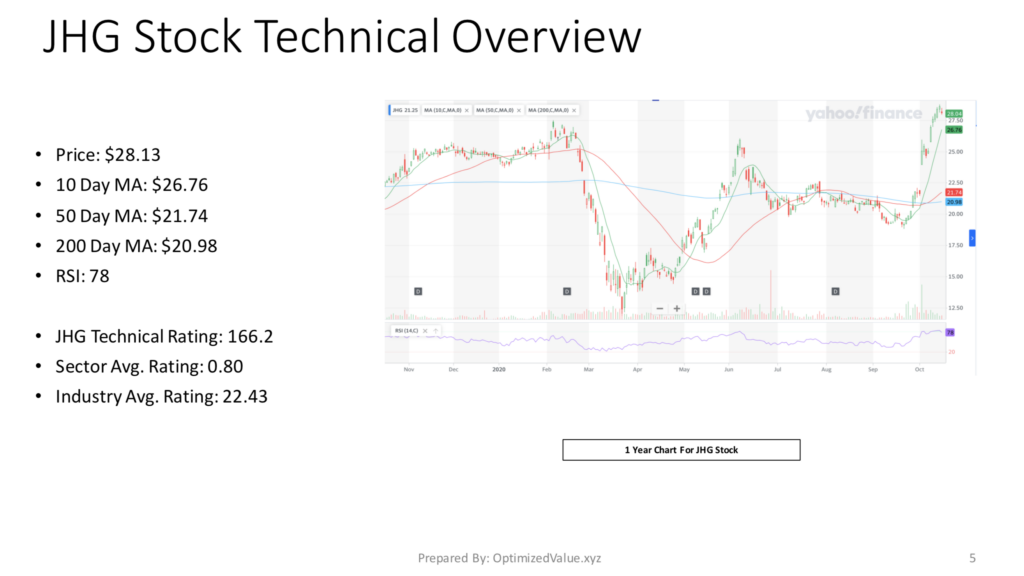
The bold prices on the image below denote the moving average levels just listed & the bold entries in the list form of the analysis under the images include other levels of support (there is no data for their limited resistance levels).
Each corresponding price level using a ratio of Buyers:Sellers (or Sellers:Buyers), NULL values denote that there was not enough data, so the ratio would’ve been 0:0.
Ratios with a 0 for the denominator/constant are denoted with an *, but reported as is as we are accounting for volume/sentiment.
Also, as there is such a wide spread between price levels, many of the resistance levels are marked NULL, as there was limited volume data for them & they were not included in the long list.
NVDA Stock’s Volume By Price Level
$400 – Buyers – 4.75:0*
$396 – Buyers – 3.1:0*
$392 – Sellers – 2.4:0*
$388 – Buyers – 2.3:1
$384 – Buyers – 1.11:1
$376 – Buyers – 1.53:1
$372 – Buyers – 2.5:0*
$316 – Buyers – 3.8:0*
$312 – Sellers – 2.3:0*
$308 – Sellers – 2:0*
$304 – Sellers – 5.5:0*
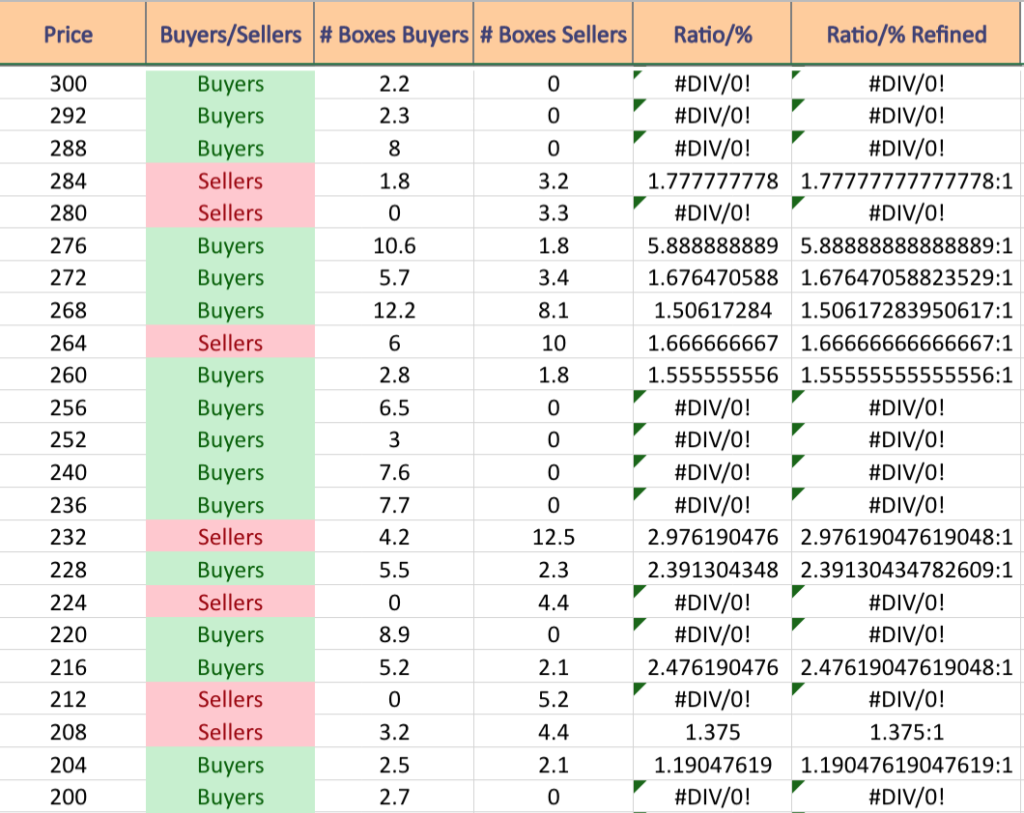
$300 – Buyers – 2.2:0*
$292 – Buyers – 2.3:0*
$288 – Buyers – 8:0*
$284 – Sellers – 1.78:1
$280 – Sellers – 3.3:0*
$276 – Buyers -5.89:1
$272 – Buyers – 1.67:1
$268 – Buyers – 1.51:1
$264 – Sellers – 1.67:1
$260 – Buyers – 1.56:1
$256 – Buyers – 6.5:0*
$252 – Buyers – 3:0*
$240 – Buyers – 7.6:0*
$236 – Buyers – 7.7:0*
$232 – Sellers – 2.98:1
$228 – Buyers – 2.39:1
$224 – Sellers – 4.4:0*
$220 – Buyers – 8.9:0*
$216 – Buyers – 2.48:1
$212 – Sellers – 5.2:0*
$208 – Sellers – 1.38:1
$204 – Buyers – 1.19:1
$200 – Buyers – 2.7:0*
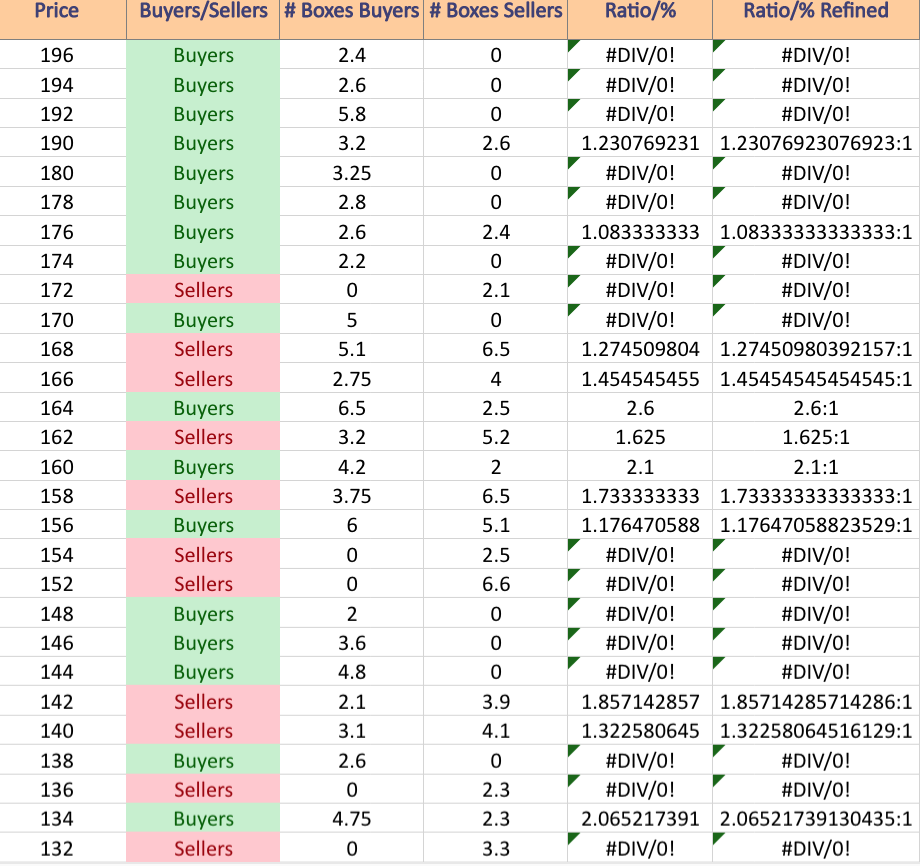
$196 – Buyers 2.4:0*
$194 – Buyers – 2.6:0*
$192 – Buyers – 5.8:0*
$190 – Buyers – 1.23:1
$180 – Buyers – 3.25:0*
$178 – Buyers – 2.8:0*
$176 – Buyers – 1.08:1
$174 – Buyers – 2.2:0*
$172 – Sellers – 2.1:0*
$170 – Buyers – 5:0*
$168 – Sellers- 1.27:1
$166 – Sellers – 1.45:1
$164 – Buyers – 2.6:1
$162 – Sellers – 1.63:1
$160 – Buyers – 2.1:1
$158 – Sellers – 1.73:1
$156 – Buyers – 1.18:1
$154 – Sellers – 2.5:0*
$152 – Sellers – 6.6:0*
$148 – Buyers – 2:0*
$146 – Buyers – 3.6:0*
$144 – Buyers – 4.8:0*
$142 – Sellers – 1.86:1
$140 – Sellers – 1.32:1
$138 – Buyers – 2.6:0*
$136 – Sellers 2.3:0*
$134 – Buyers – 2.07:1
$132 – Sellers – 3.3:0*
Tying It All Together
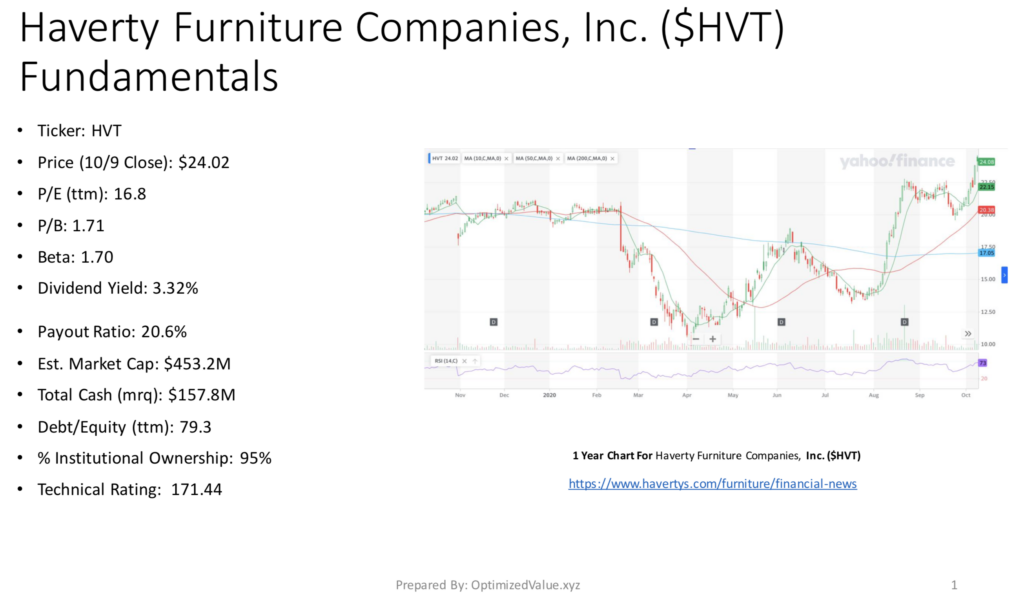
The list & image above paint the picture as to how investors & traders have behaved at various price levels that NVDA has been at over the past one-to-two years.
It is not meant to serve as investment/trading advice, and is simply a way to visualize what investor/trader sentiment has been like at each of the price levels mentioned, as well as what it was at levels of support & resistance that are denoted in the image & list.
As always, do your own due diligence before making investing/trading decisions.
For more on the methodology on how the data was collected & put together, please refer to our original Price:Volume analysis.
*** I DO NOT OWN SHARES OR OPTIONS CONTRACT POSITIONS IN NVDA AT THE TIME OF PUBLISHING THIS ARTICLE ***