Cummins Inc. stock trades under the ticker CMI & has shown recent bullishness that traders & investors should research further into for when market volatility has passed.
CMI stock closed at $215.98/share on 5/23/2023.
Cummins Inc. CMI Stock’s Technical Performance Broken Down
Cummins Inc. CMI Stock’s Technical Performance Over The Past Year
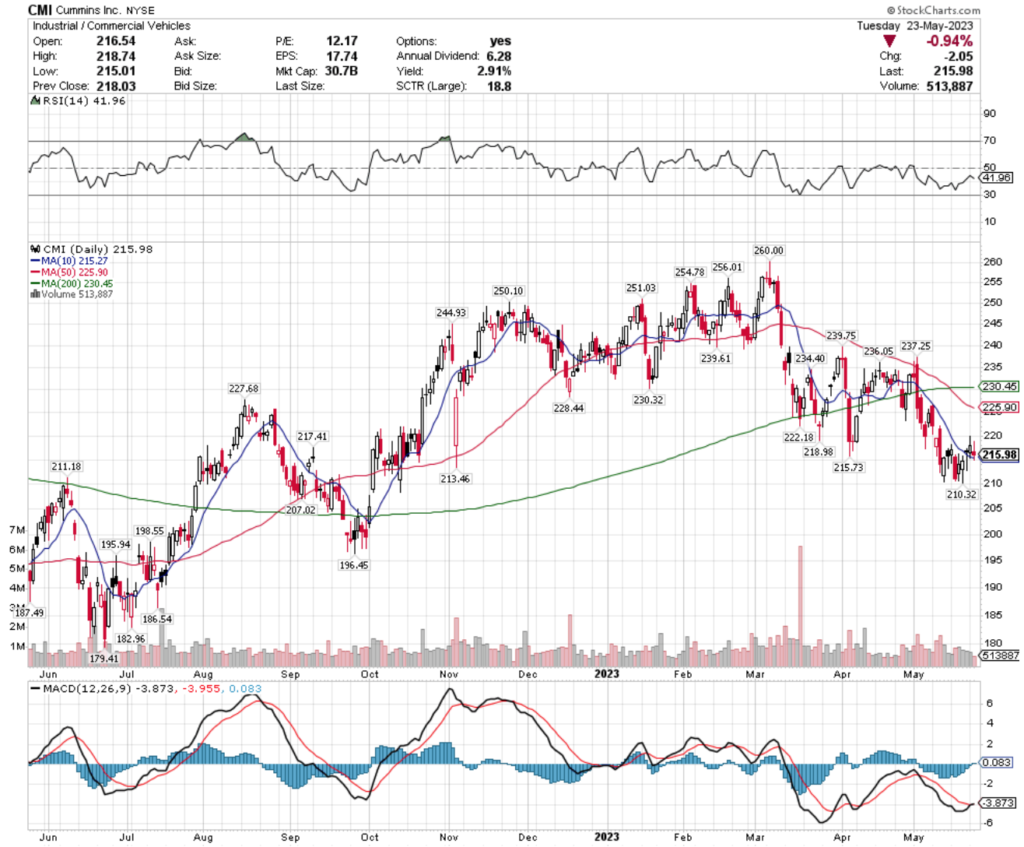
CMI Stock Price: $215.98
10 Day Moving Average: $215.27
50 Day Moving Average: $225.90
200 Day Moving Average: $230.45
RSI: 41.96
MACD: -3.873, -3.955, 0.083
Yesterday, CMI stock completed a bullish MACD crossover, despite losing -0.94% on the day’s session.
Their RSI is on the oversold end of neutral at 41.96, with recent trading volumes being below average compared to the year prior, signaling uncertainty among investors.
Investors should be watching to see how CMI behaves around its support levels to establish where they may want to enter a position once broader market volatility has subsided.
CMI stock has support at the $215.73, $215.27 (10 day moving average), $213.46 & $211.18/share price level, with resistance overhead at the $217.41, $218.98, $222.18 & $225.90/share (50 day moving average) price levels.
Cummins Inc. CMI Stock As A Long-Term Investment
Long-term oriented investors will like CMI stock’s 12.61 P/E (ttm), but may find their 3.29 P/B (mrq) to be a bit too rich.
They recently reported +32.4% Quarterly Revenue Growth Y-o-Y, with +89% Quarterly Earnings Growth Y-o-Y.
Their balance sheet may warrant a more thorough review, with $2.44B of Total Cash (mrq) & $8.37B of Total Debt (mrq).
CMI pays a 2.83% dividend, which appears to be sustainable in the long-run, as their payout ratio is 34.7%.
LyondellBasell Industries NV stock trades under the ticker LYB & has shown recent bullishness that traders & investors should research further into for when market volatility has subsided.
LYB stock closed at $90.68/share on 5/22/2023.
LyondellBasell Industries NV LYB Stock’s Technical Performance Broken Down
LyondellBasell Industries NV LYB Stock’s Technical Performance Over The Past Year
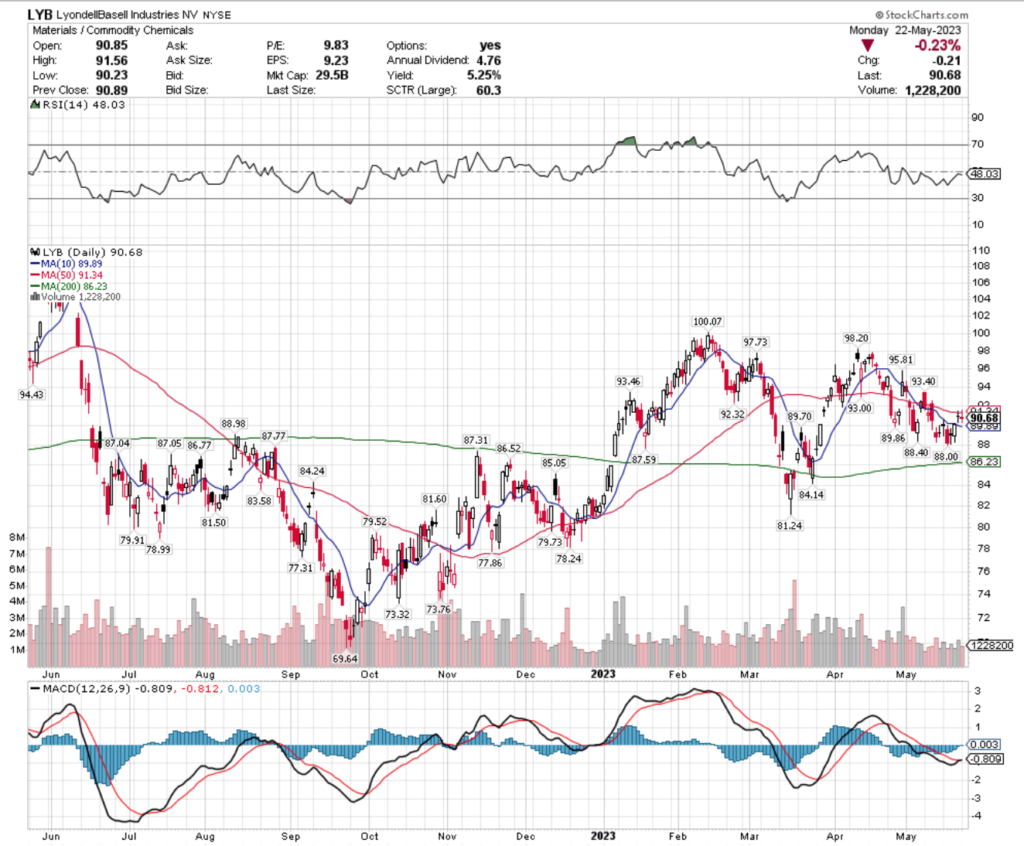
LYB Stock Price: $90.68
10 Day Moving Average: $89.89
50 Day Moving Average: $91.34
200 Day Moving Average: $86.23
RSI: 48.03
MACD: -0.809, -0.812, 0.003
Yesterday, LYB stock completed a bullish MACD crossover, despite losing -0.23% on the day’s session.
Their RSI is neutral at 48 & recent trading volumes have been below average compared with the year prior, which when combined with the spinning top candlesticks from 6 of the last 8 sessions, highlights uncertainty in LYB stock’s share value by investors.
As a result, market participants would be wise to watch how they behave at their key support levels in the near-term in order to target an entry for when market volatility has cooled down.
LYB stock has support at the $89.89 (10 day moving average), $89.86, $89.70 & $88.98/share price levels, with resistance at the $91.34 (50 day moving average), $92.32, $93 & $93.32/share price levels.
LyondellBasell Industries NV LYB Stock As A Long-Term Investment
Long-term oriented investors will like LYB stock’s valuation metrics, with a 10.09 P/E (ttm) & a 2.39 P/B (mrq).
They recently reported -22.10% Quarterly Revenue Growth Y-o-Y, with -64.2% Quarterly Earnings Growth Y-o-Y, which should be researched further into before investing.
Their balance sheet will also require a more thorough examination as well, with $1.82B of Total Cash (mrq) & $13.1B of Total Debt (mrq).
LYB stock pays a 5.24% dividend, which appears to be sustainable in the long-run, as their payout ratio is 51.35%.
72.06% of LYB stock’s outstanding share float is owned by institutional investors.
LyondellBasell Industries NV LYB Stock As A Short-Term Trade Using Options
Traders with shorter time horizons can trade options to profit from LYB stock’s price movements, while protecting their portfolios from volatility.
I am looking at the contracts with the 6/16 expiration date.
The $90, $85 & $80 call options are all in-the-money, listed from highest to lowest level of open interest.
The $95, $100 & $105 puts are also in-the-money, with the former being more liquid than the latter strikes.
Tying It All Together
LYB stock has many interesting attributes that traders & investors will find appealing.
Investors will like their dividend, as well as their valuation metrics, but may want to dig deeper into their recent growth woes, as well as their balance sheet.
Traders will like their recent technical performance, as well as their liquid options.
All-in-all, it is worth taking a closer look into how LYB stock fits into your portfolio strategy.
*** I DO NOT OWN SHARES OR OPTIONS CONTRACT POSITIONS IN LYB STOCK AT THE TIME OF PUBLISHING THIS ARTICLE ***
John Bean Technologies Corp. stock trades under the ticker JBT & has shown recent bullishness that traders & investors should research further into for when market volatility has calmed down.
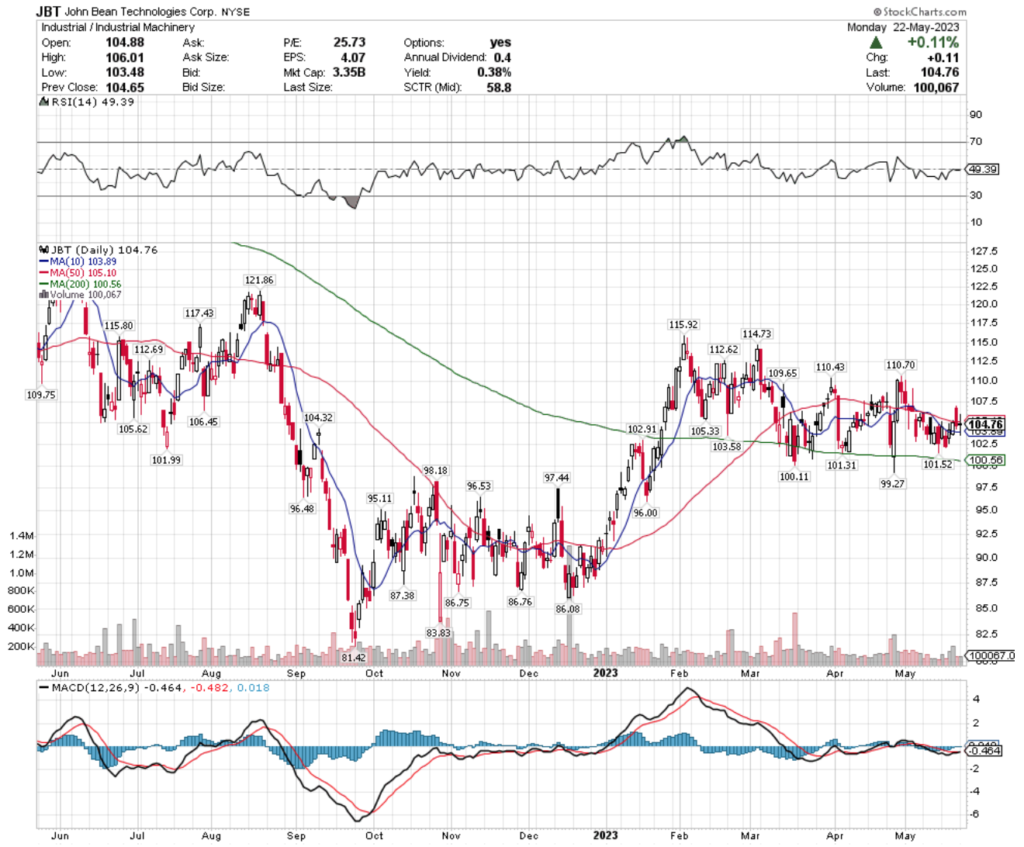
JBT stock closed at $104.76/share on 5/22/2023.
John Bean Technologies Corp. JBT Stock’s Technical Performance Broken Down
John Bean Technologies Corp. JBT Stock’s Technical Performance Over The Past Year
Yesterday, JBT stock completed a bullish MACD crossover, gaining+0.11% on the day’s session.
Their RSI is neutral at 49 & recent trading volumes have been below average compared to the year prior, indicating that investors are uncertain about where they value JBT’s shares currently.
Investors would be wise to watch how they behave at support levels in the coming weeks, in order to figure out what price level to enter at once market volatility has subsided a bit.
JBT stock has support at the $104.32, $103.89 (10 day moving average), $103.58 & $101.99/share price levels, with resistance at the $105.10 (50 day moving average), $105.33, $105.62 & $106.45/share price levels.
John Bean Technologies Corp. JBT Stock As A Long-Term Investment
Long-term oriented investors will like JBT stock’s 25.18 P/E (ttm), but may find their 3.78 P/B (mrq) to be a bit too rich.
Their balance sheet will require a more thorough review, with $45.7M of Total Cash (mrq) & $957.3M of Total Debt (mrq).
JBT stock pays a modest 0.38% dividend, which appears to be sustainable in the long-run, as their payout ratio is 9.83%.
99.34% of JBT stock’s outstanding share float is owned by institutional investors.
John Bean Technologies Corp. JBT Stock As A Short-Term Trade Using Options
Traders who has shorter time horizons can trade options to profit from JBT stock’s price movements, while protecting their portfolios from volatility.
Their options are pretty illiquid, with no in-the-money strike prices for calls in the coming expiration dates, but there are contracts at the $115 calls dated for 6/16, as well as $115, $110, $120 & $125 strikes for the 7/21 expiration date (in order of highest to lowest level of open interest)
The $110 puts with the 7/21 expiration date are in-the-money.
Tying It All Together
JBT stock has many interesting characteristics that traders & investors will find appealing.
Investors will like their P/E (ttm) & sustainable, yet modest dividend.
Traders will like their recent technical performance, but will be disappointed by how illiquid their options are.
Overall, it is worth taking a closer look to see how JBT stock fits into your portfolio strategy.
*** I DO NOT OWN SHARES OR OPTIONS CONTRACT POSITIONS IN JBT STOCK AT THE TIME OF PUBLISHING THIS ARTICLE ***
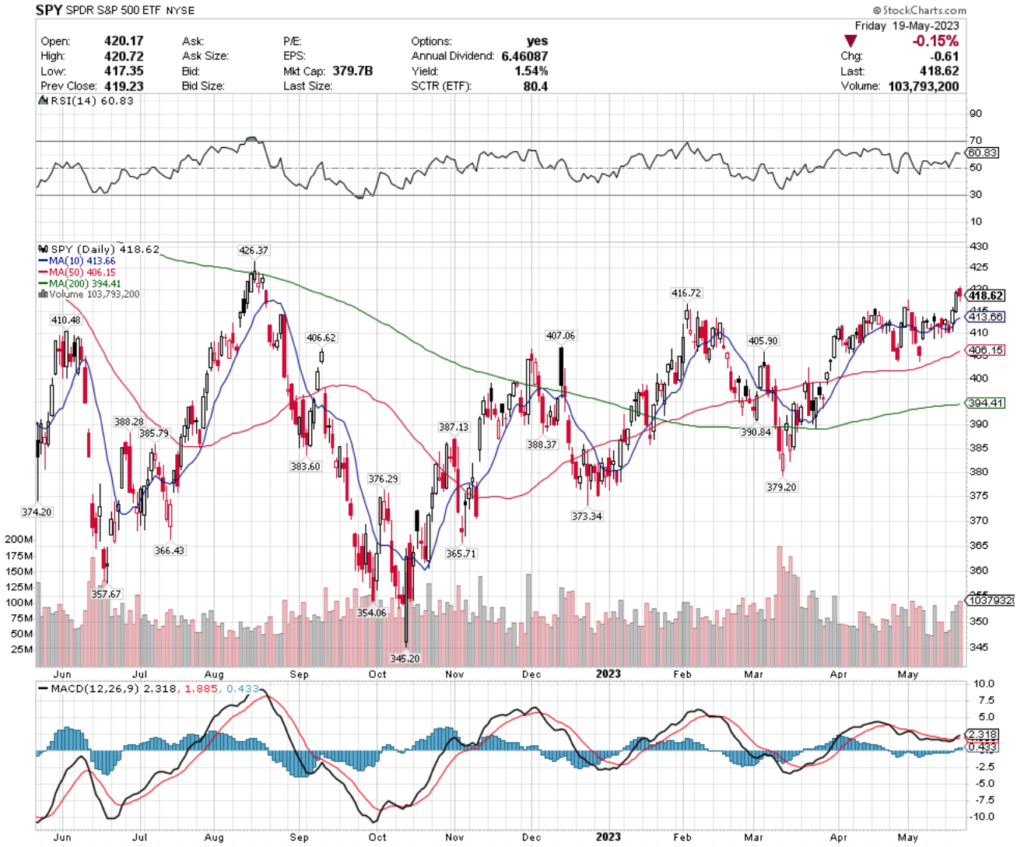
SPY, the SPDR S&P 500 ETF gained +1.71% over the past week, as investors tried to sort through the results of earnings calls, changes in companies’ guidance, the fallout of the bank failure issues, future inflation curbing measures from the Fed & the U.S. Debt Ceiling debacle.
SPY ETF – SPDR S&P 500 ETF’s Technical Performance Over The Past Year
After starting the week off in the same consolidation range as last week, Wednesday & Thursday’s sessions showed signs of optimism from investors, with Friday’s session bringing SPY back to reality a bit after two strong days.
Their RSI is on the overbought end of neutral at 60.83, with last week’s volumes starting off below average compared to the year prior, before increasing Wednesday through Friday.
Their MACD is currently bullish, but Monday’s session will provide more technical insights into which direction they are likely to go in for the next week, as Monday’s session has to the potential to create a Dark Cloud Cover pattern, which would be a bearish signal to kick off the week.
SPY has support at the $416.72 (Volume Sentiment: Sellers, 1.33:1), $413.66 (Volume Sentiment: Buyers, 3:1), $410.48 (Volume Sentiment: Sellers, 1.57:1) & $407.06/share (Volume Sentiment: Sellers, 1.9:1) price levels, with resistance at the $426.37 (Volume Sentiment: Sellers, 1.24:1), $438.53 (Volume Sentiment: Sellers, 1.32:1), $442.12 (Volume Sentiment: Sellers, 1.35:1) & $449.09/share (Volume Sentiment: Buyers, 1.89:1) price levels.
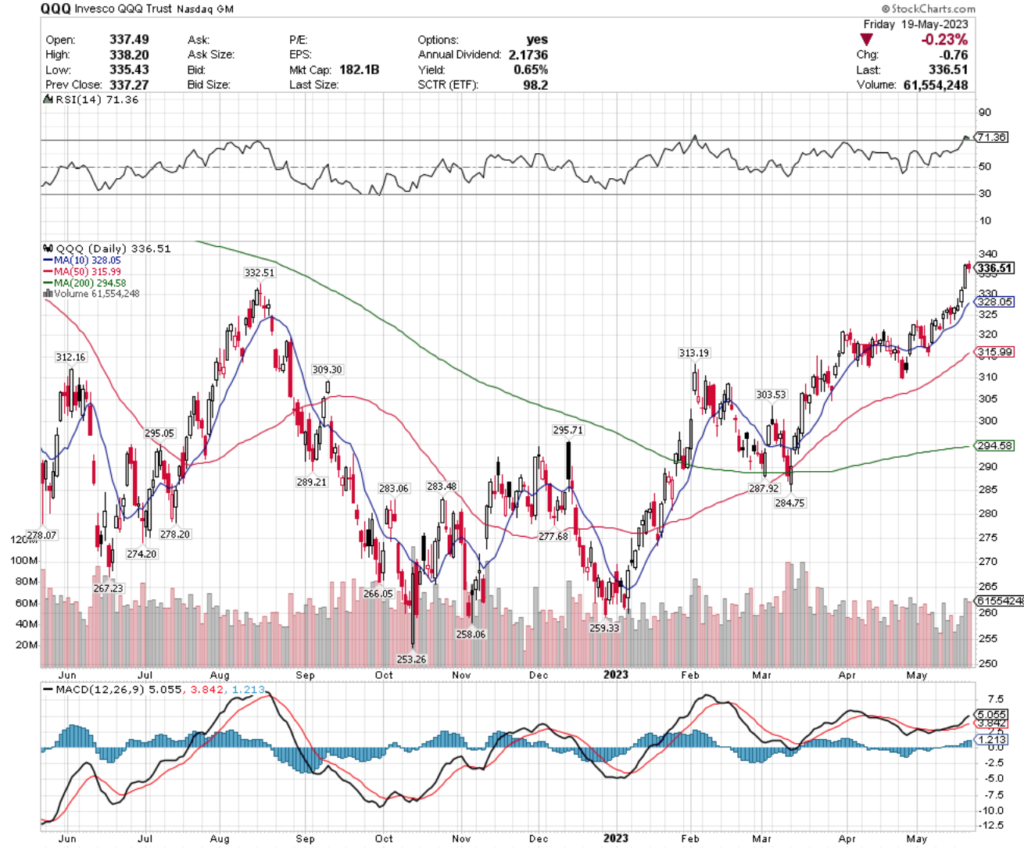
QQQ, the Invesco QQQ Trust ETF jumped +3.53% over the past week, as investors showed favor to the tech-heavy NASDAQ index vs. the S&P 500 & Russell 2000.
QQQ ETF – Invesco QQQ Trust ETF’s Technical Performance Over The Past Year
Their day-by-day results were quite similar to SPY’s, although Monday & Tuesday were both days of slight gains that remained in last week’s consolidation range, before Wednesday & Thursday’s major bullish sessions & Friday’s spinning top candlestick.
QQQ’s RSI is overbought at 71.36 & their past week’s volume followed a similar pattern to SPY’s.
Their MACD is also currently bullish, but beginning to show signals of rolling over bearishly in the coming days.
QQQ has support at the $332.51 (Volume Sentiment: Sellers, 3.2:1) , $328.05 (10 day moving average; Volume Sentiment: Sellers, 1.8:1), $315.99 (50 day moving average; Volume Sentiment: Sellers, 3.64:1) & $312.16/share (Volume Sentiment: Sellers, 3.64:1) price levels, with resistance at the $346.78 (Volume Sentiment: Buyers, 1.31:1), $368.99 (Volume Sentiment: Buyers, 0.75:0*), $375.07 (Volume Sentiment: Sellers, 1:0*) & $378.49/share (Volume Sentiment: Buyers, 1.33:1) price levels.
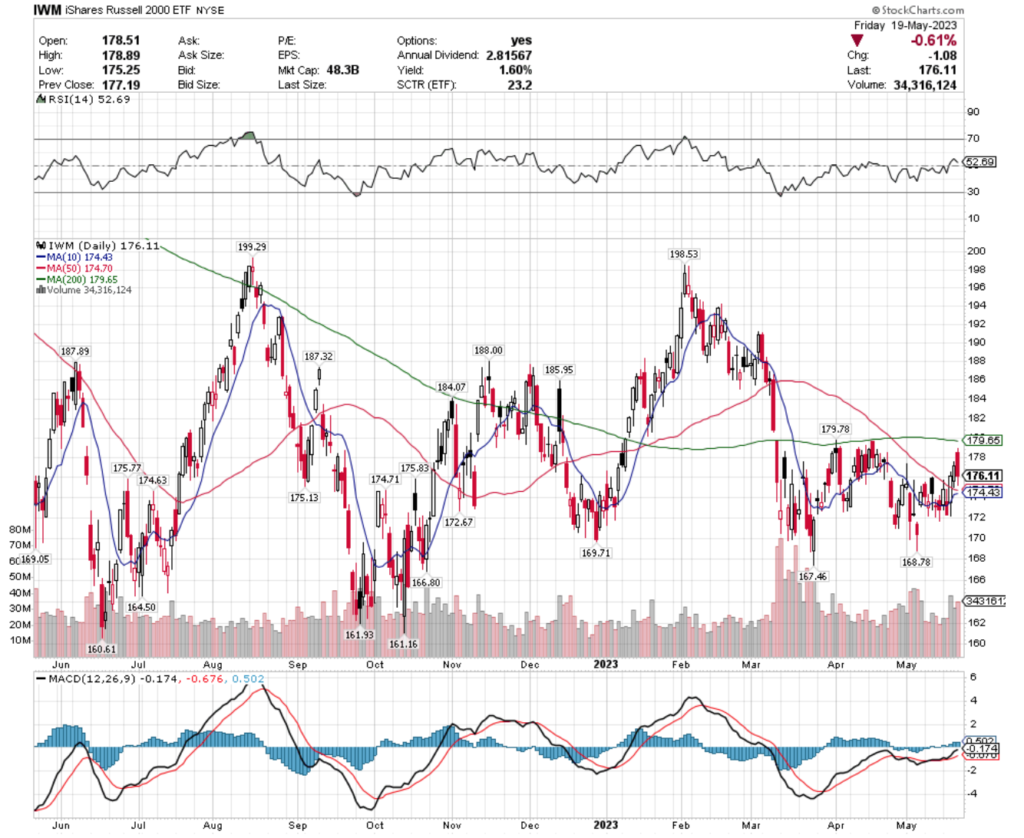
IWM, the iShares Russell 2000 ETF gained +1.96% over the past week, as investors showed more favor to smaller cap stocks than the S&P 500 index, but still were not able to perform as strongly as the NASDAQ names.
IWM ETF – iShares Russell 2000 ETF’s Technical Performance Over The Past Year
They too kicked off the first two days of the week in the same range as last week, before Wednesday & Thursday produced big gains, which were brought back to reality during Friday’s session.
Their RSI is neutral at 52.69, with volumes becoming above average compared to the year prior from Wednesday through Friday of this past week.
Their MACD is also bullish, but beginning to signal that it may roll over bearishly in the coming sessions.
IWM has support at the $175.83 (Volume Sentiment: Buyers, 1.45:1) , $175.77 (Volume Sentiment: Buyers, 1.45:1), $174.71 (Volume Sentiment: Buyers, 1.45:1) & $174.70/share (50 day moving average; Volume Sentiment: Buyers, 1.45:1 ) price levels, with resistance at the $179.65 (200 day moving average; Volume Sentiment: Buyers, 1.84:1), $179.78 (Volume Sentiment: Buyers, 1.84:1), $184.07 (Volume Sentiment: Buyers, 1.75:1) & $185.95/share (Volume Sentiment: Buyers, 1.75:1) price levels.
Let’s dive into some of the best & worst performing sectors, industries & geo-locations based on our technical analysis ratings of their relevant ETFs!
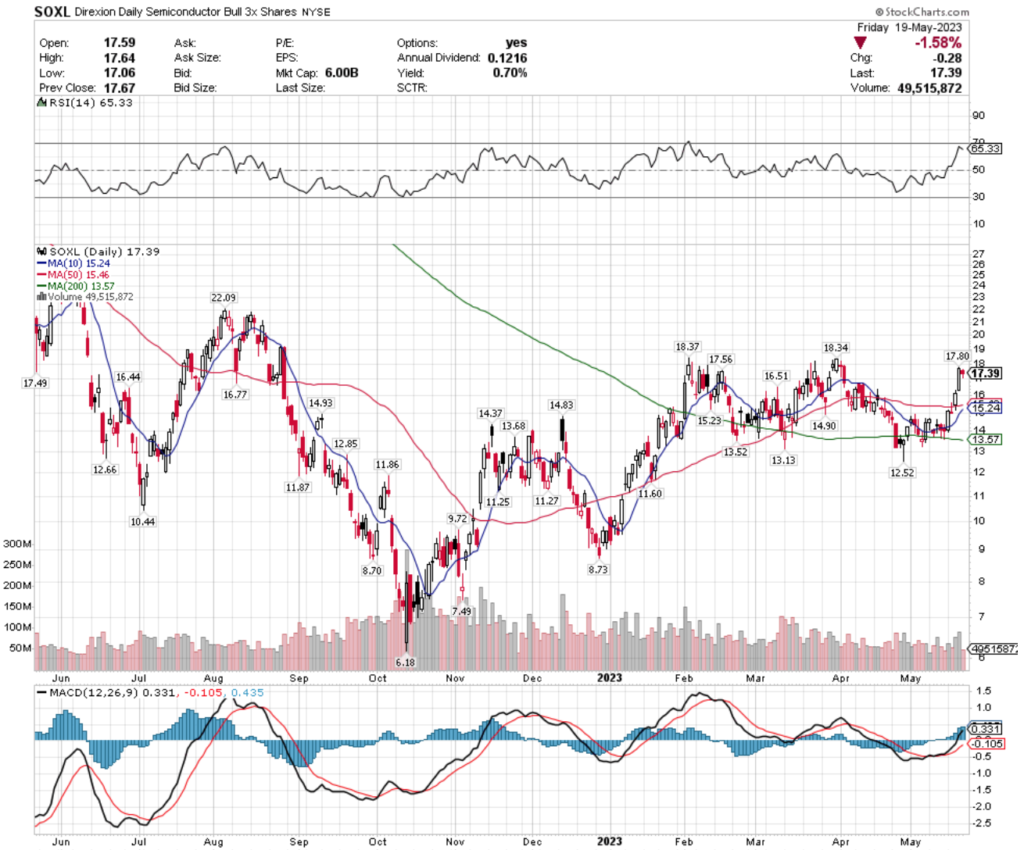
Semiconductors (SOXL), Argentina (ARGT), Germany (EWG) & Telecommunication Services (FCOM) Are All Bullishly Leading The Market
SOXL ETF – Direxion Daily Semiconductor Bull 3x Shares ETF’s Technical Performance Over The Past Year
They had a very strong week last week, climbing +23.33% during the course of the past five trading sessions.
Their RSI is nearing overbought at 65.33 & recent trading volumes have been below average compared to the year prior, signaling that investors & traders still are feeling uncertain as to where they value SOXL’s shares.
Their MACD is bullish, with their 10 day moving average poised to cross bullishly through their 50 day moving average in the next trading session.
Given their technicals & broader market volatility, it would be wisest to watch their behavior around their support levels, while using a defensive options strategy as insurance, as their 0.7% distribution yield for long-term holders does not provide much cushion against losses.
SOXL has support at the $16.77, $16.51, $16.44 & $15.46/share (50 day moving average) price levels, with resistance at the $17.49, $17.56, $17.80 & $18.34/share price levels.
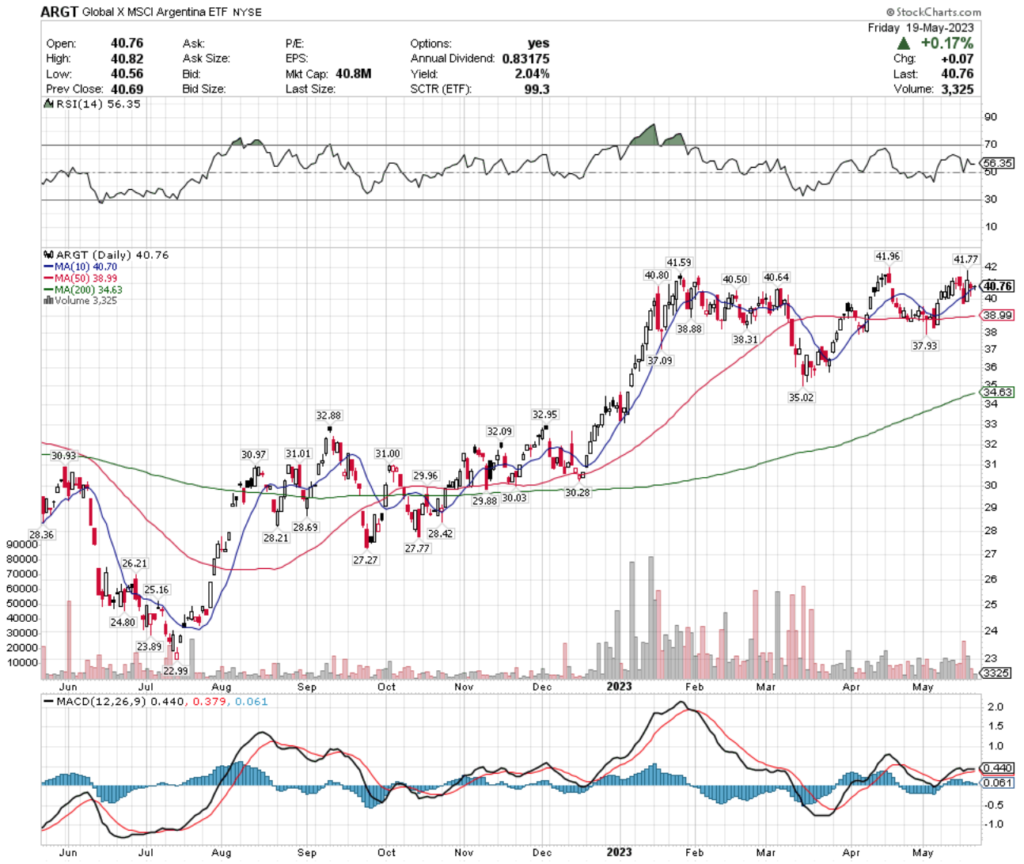
ARGT, the Global X MSCI Argentina ETF has gained +41.58% over the past year, posting a +75.01% gain since their 52-week low in July of 2022 (ex-distributions).
ARGT ETF – Global X MSCI Argentina ETF’s Technical Performance Over The Past Year
Their last two sessions have had hanging man/spinning top candlesticks, which is signaling a bearish near-term outlook for ARGT.
Their MACD is signaling a bearish crossover is imminent & their RSI is bearishly moving back towards the neutral point of 50.
Trading volumes for the first three sessions of the week looked above/about average compared to the year prior, but the last two sessions produced limited volume, signaling caution among investors on ARGT.
While they provide a 2.04% distribution yield for long-term holders, a defensive options strategy such as buying puts or selling calls would be wiser than entering a long position now, while waiting to see how their price behaves around their support levels in the near-term.
ARGT has support at the $40.70 (10 day moving average), $40.64, $40.50 & $38.99/share (50 day moving average) price levels, with resistance at the $40.80, $41.59, $41.77 & $41.96/share price levels.
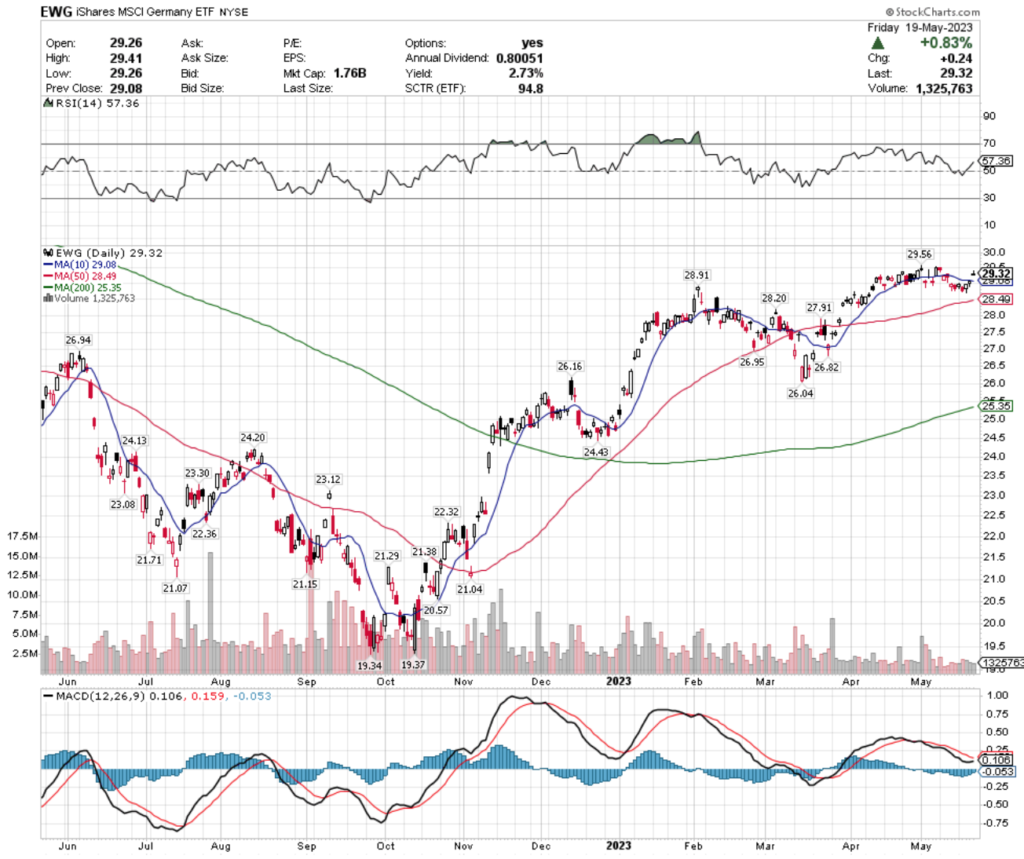
EWG, the iShares MSCI Germany ETF has improved +15.8% over the past year, climbing +51.52% since their 52-week low in September of 2022 (ex-distributions).
EWG ETF – iShares MSCI Germany ETF’s Technical Performance Over The Past Year
Their MACD is currently bearish, but moving towards a bullish crossover in the coming sessions, but a shooting star candlestick from Friday’s session shows that there may be a consolidation coming in the near-term.
Their RSI is on the overbought end of neutral at 57.36, and recent trading volumes have been below average, confirming that uncertainty that investors are feeling regarding their share price.
EWG offers a 2.73% distribution yield for long-term holders which will provide some cushion against losses, but trading options around their current price levels will provide a better form of insurance while waiting to see how they behave at key support levels in the near-term.
EWG has support at the $29.08 (10 day moving average), $28.91, $28.49 (50 day moving average) & $28.20/share price levels, with resistance at the $29.56, $29.86, $30.26 & $30.84/share price levels.
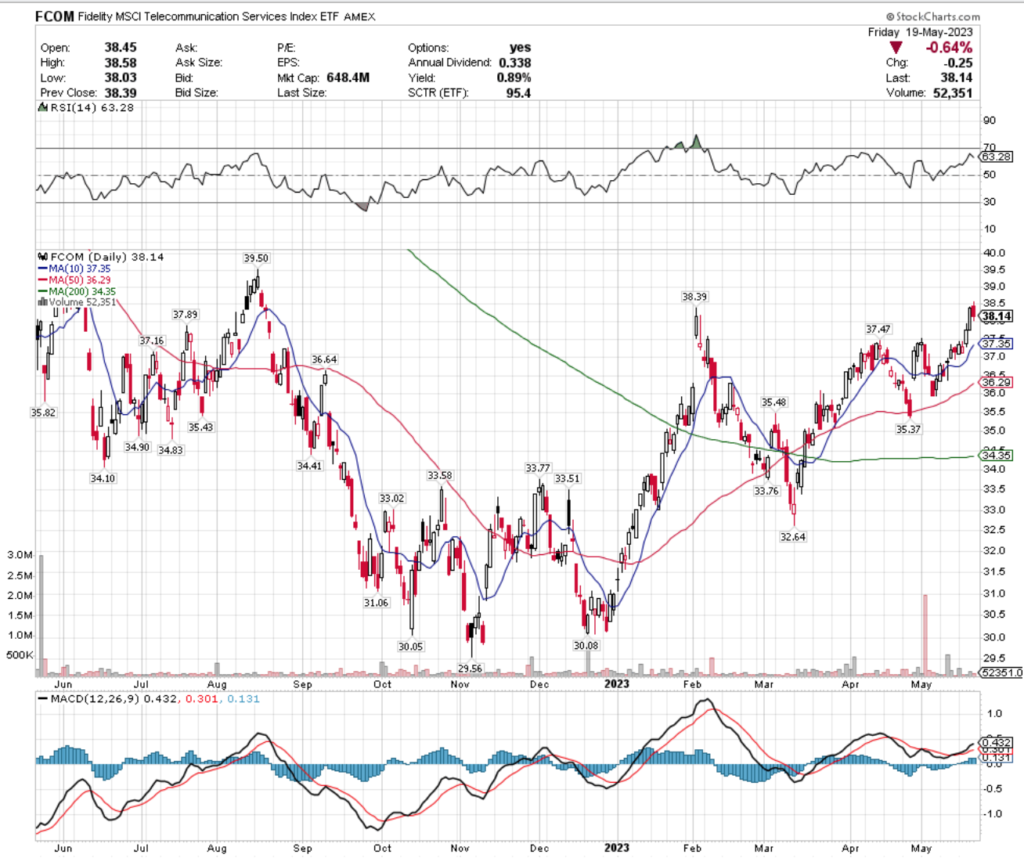
FCOM ETF – Fidelity MSCI Telecommunication Services Index ETF’s Technical Performance Over The Past Year
Friday’s session has caused their MACD to begin taking a turn towards a bearish crossover in the coming sessions, but this past week’s volume was also subpar compared to the year prior.
Their RSI is moving back towards neutral from a more overbought position earlier in the week.
Their modest 0.89% distribution yield will not provide much protection against losses, making an options strategy the best bet while waiting to see where to enter a long-term position.
FCOM has support at the $37.89, $37.47, $37.35 (10 day moving average) & $37.16/share price levels, with resistance at the $38.39, $39.35, $39.50 & $40.73/share price levels.
Regional Banking (KRE), Clean Energy (PBW), Metals & Mining (XME) & Turkey (TUR) Are All Bearishly Lagging The Market
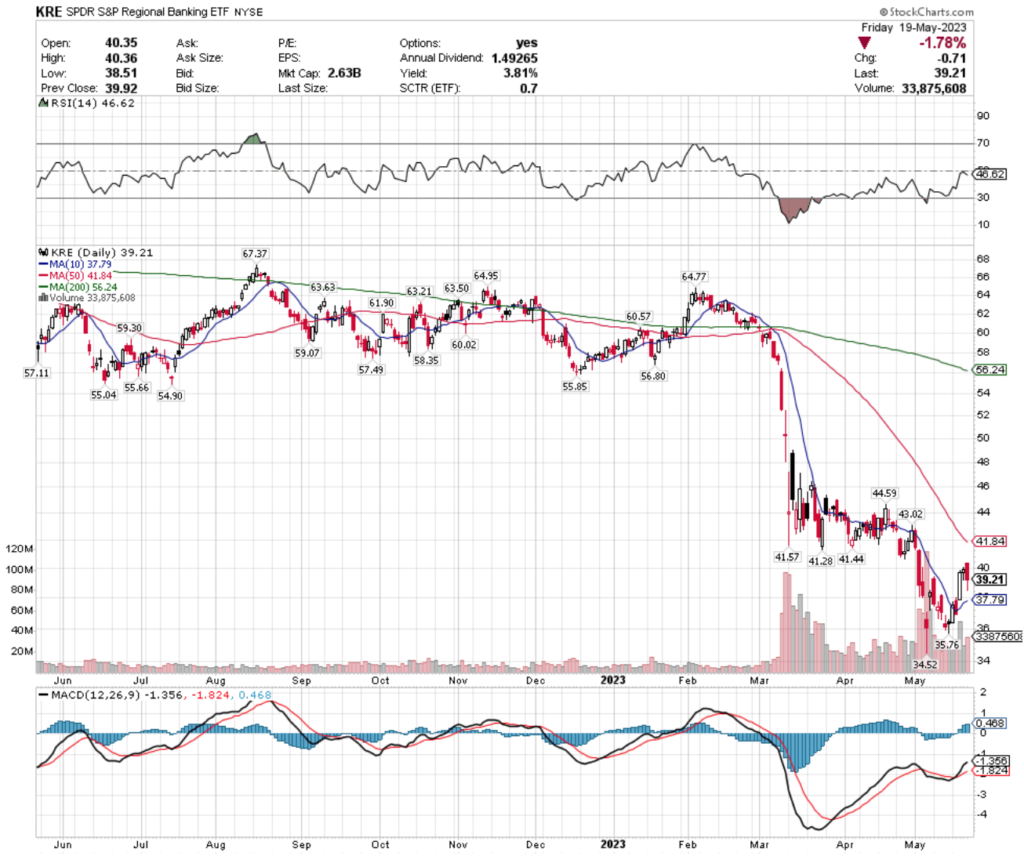
KRE, the SPDR S&P Regional Banking ETF has lost -32.8% over the past year, losing -43% from their 52-week high in August of 2022, but recovering +13.59% from their 52-week low in May of 2023 (ex-distributions).
KRE ETF – SPDR S&P Regional Banking ETF’s Technical Performance Over The Past Year
After a small rebound early in the week, an ominous hanging man candle concluded the week on both Thursday & Friday, signaling that investors are not feeling optimistic on their share price in the near-term.
Their MACD is bullish, but beginning to curl over bearishly & their RSI bounced off of neutral earlier in the week, but has begun bearishly declining again.
While volumes are above average compared to the year prior, they are below average for the last few months, which is when regional banks began to get in trouble, showing more uncertainty among investors.
KRE offers a 3.81% distribution yield, which is a decent cushion against losses for long-term holders, but any position should be accompanied by an options strategy in the near-term, as we wait to see how these banks fare.
KRE has support at the $37.79 (10 day moving average), $35.76 & $34.52/share price levels, with resistance at the $41.28, $41.44, $41.57 & $41.84/share (50 day moving average) price levels.
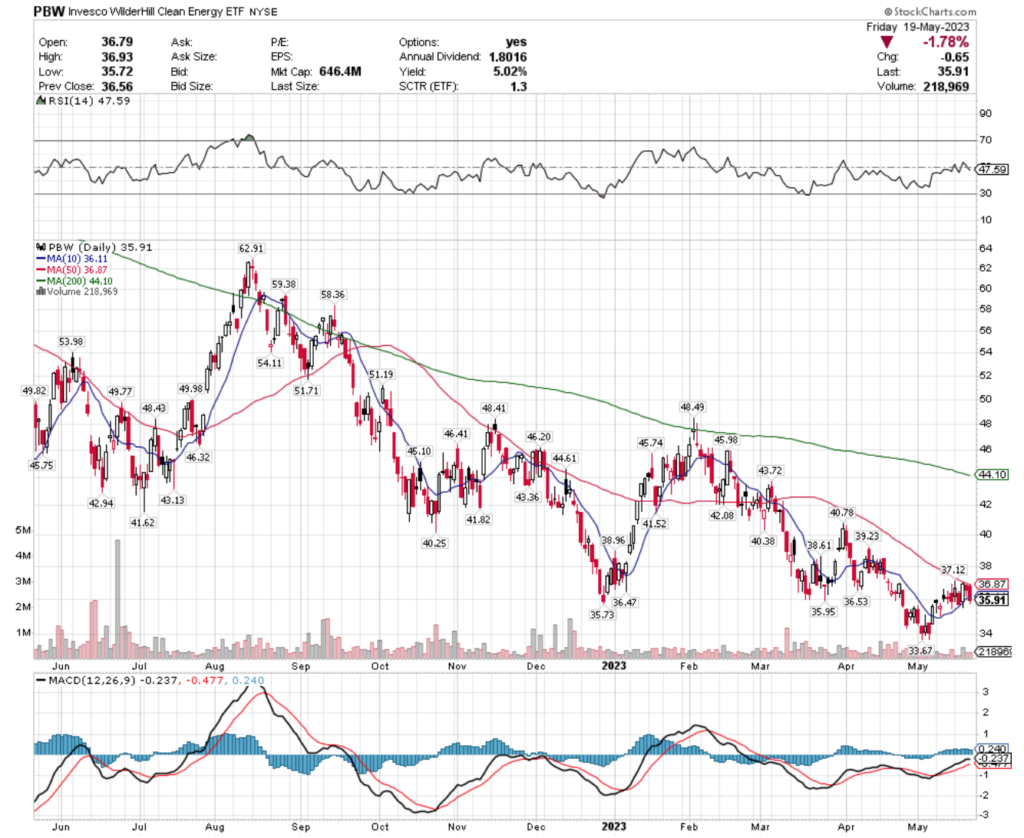
PBW, the Invesco WilderHill Clean Energy ETF has fallen -24.88% over the past year, losing -44.85% since their 52-week high in August of 2022, while recovering +6.65% since their 52-week low in May of 2023 (ex-distributions).
PBW ETF – Invesco WilderHill Clean Energy ETF’s Technical Performance Over The Past Year
Their MACD is signaling that momentum is being lost, with their RSI beginning to bearishly decline after crossing over the neutral 50 mark recently.
All of their candles for the past week have been consolidated in a tight range, with very weak volume, signaling that investors are still not confident in their price level.
Their 5.2% distribution yield is a decent cushion for long-term holders, but investors would be wise to wait & see how they behave at their existing support levels before buying long shares, unless they are employing an insurance policy using options.
PBW has support at the $35.73 & $33.67/share price levels, with resistance at the $35.95, $36.11, $36.53 & $36.87 (50 day moving average) price levels.
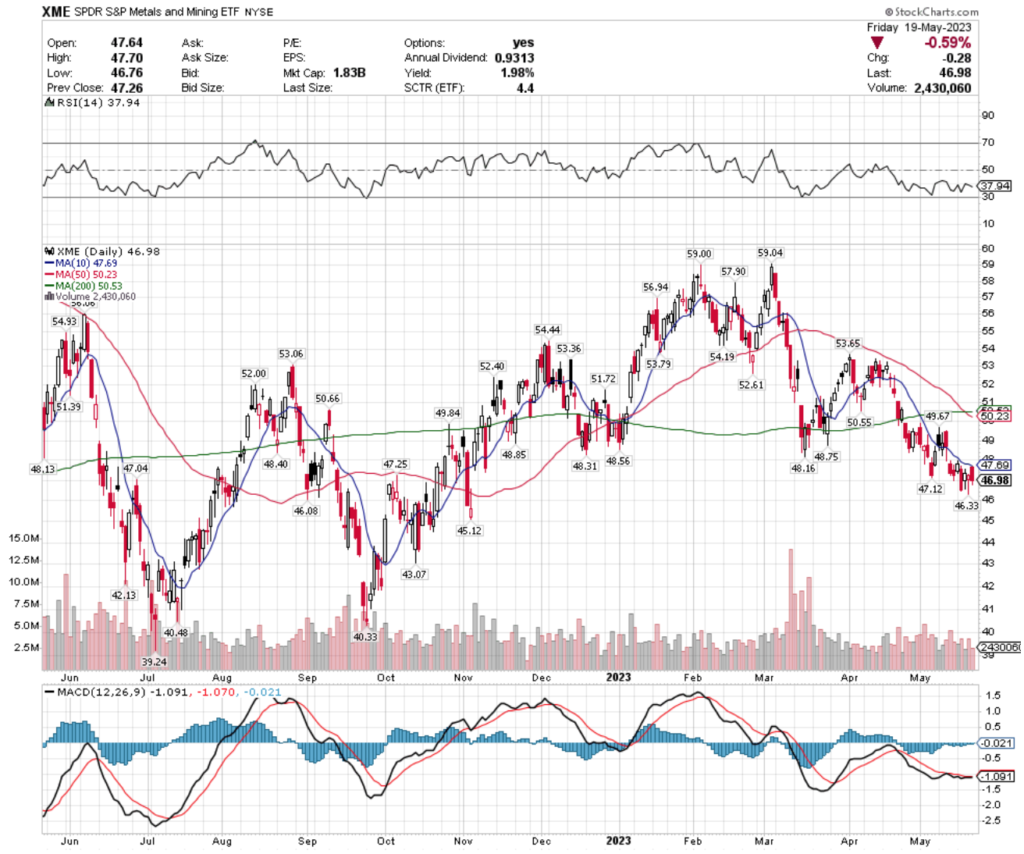
XME, the SPDR S&P Metals & Mining ETF has dropped -5.26% over the past year, losing -20.7% since their 52-week high in March of 2023, but has recovered +17.95% since their 52-week low in July of 2022 (ex-distributions).
XME ETF – SPDR S&P Metals & Mining ETF’s Technical Performance Over The Past Year
After a recent death cross last week, their MACD has been unable to manage a bullish crossover & has moved relatively flat for the past couple of weeks.
Their RSI is moving towards the oversold level of 30, with recent trading volumes being about average compared to the year prior.
Their price has spent the past week consolidated in a narrow range, signaling uncertainty among investors.
XME offers a 1.98% distribution yield for long-term holders, but that provides limited insurance against losses, calling for a defensive options strategy to be in place while waiting out to see how their support levels hold up in the near-term.
XME has support at the $46.33, $46.08, $45.12 & $43.07/share price levels, with resistance at the $47.04, $47.12, $47.25 & $47.69/share (10 day moving average) price levels.
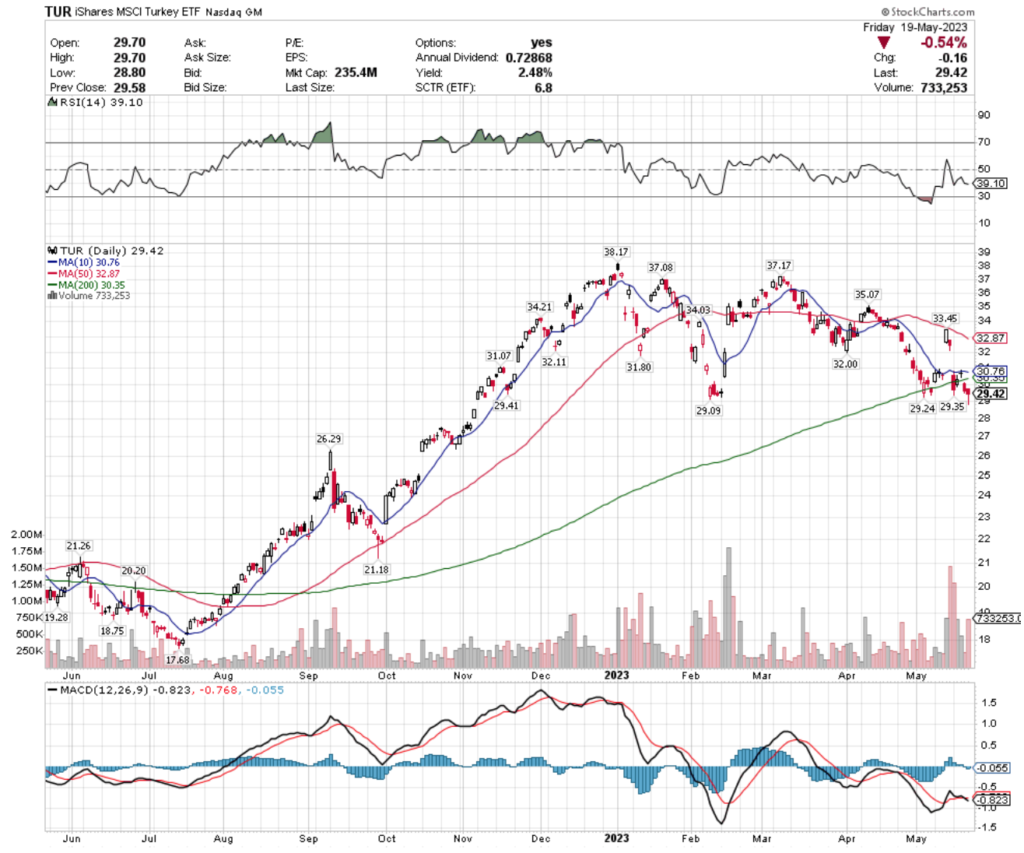
TUR, the iShares MSCI Turkey ETF has gained +50.1% over the past year, including a +66% gain since their 52-week low in July of 2022, but has fallen -22.92% since their 52-week high achieved in the first trading session of 2023 (ex-distributions).
TUR ETF – iShares MSCI Turkey ETF’s Technical Performance Over The Past Year
Their MACD is bearish, as is their RSI which is trending its way back towards the oversold mark at 30.
Recent trading volumes have been above average compared to the year prior, signaling that investors think that their price level is valued below their two day gap up range that they tried to establish earlier in May.
With a 2.48% cushion for protection against losses from their distribution yield, there are other gaps that need to be filled in the near-term that support levels may not be able to protect.
TUR has support at the $29.41, $29.35, $29.24 & $29.09/share price levels, with resistance at the $30.35 (200 day moving average), $30.76 (10 day moving average), $31.07 & $31.80/share price levels.
Tying It All Together
This week is relatively quiet on the data front until Friday, compared to prior weeks in terms of the number of announcements.
Monday morning at 8:30 am St. Louis President James Bullard speaks, followed by San Francisco Fed President Mary Daly at 11 am & Atlanta Fed President Bostic & Richmond Fed President Barkin speaking at 11:05 am.
Monday’s earnings calls include Global-E Online, HEICO, Nordson & Zoom Video Communications.
Dallas Fed President Lorie Logan speaks at 9 am on Tuesday, followed by S&P Flash U.S. Services PMI & S&P Flash U.S. Manufacturing PMI data at 9:45 am & New Home Sales data at 10 am.
On Wednesday Fed Governor Waller speaks at 12:40 pm & at 2pm the Fed’s May FOMC Minutes are released.
Wednesday’s earnings calls include Nvidia, Abercrombie & Fitch, Digital Turbine, Kohl’s, Petco Health & Wellness, Snowflake, Splunk, The Children’s Place & more.
Thursday morning kicks off at 8:30 am with the GDP (second reading) & Initial Jobless Claims data, followed up with Richmond Fed President Barkin speaking at 9:50 am & at 10 am the Pending Home Sales data being reported.
Dollar Tree, 23andMe, Best Buy, Burlington Stores, Costco Wholesale, Deckers Outdoor, Gap, Manchester United, Nutanix, Pinduoduo, Ralph Lauren, Royal Bank of Canada, Titan Machinery, Toronto-Dominion Bank, Ulta Beauty, WMware, Workday & many other names will report earnings on Thursday.
Friday morning at 8:30 am we get the bulk of the week’s data reports, which include Durable-goods Orders, Durable-goods Minus Transportation, Person Income (nominal), Personal Spending (nominal), PCE Index, Core PCE Index, PCE (Y-o-Y), Core PCE (Y-o-Y), Advanced U.S. Trade Balance in Goods, Advanced Retail Inventories & Advanced Wholesale Inventories, with Consumer Sentiment (final) data coming in at 10 am.
Friday’s earnings calls conclude with Big Lots, Booz Allen Hamilton, Buckle & Hibbett reporting.
See you back here next week!
***I DO NOT OWN SHARES OR OPTIONS CONTRACT POSITIONS IN SPY, QQQ, IWM, SOXL, ARGT, EWG, FCOM, KRE, PBW, XME or TUR AT THE TIME OF PUBLISHING THIS ARTICLE***
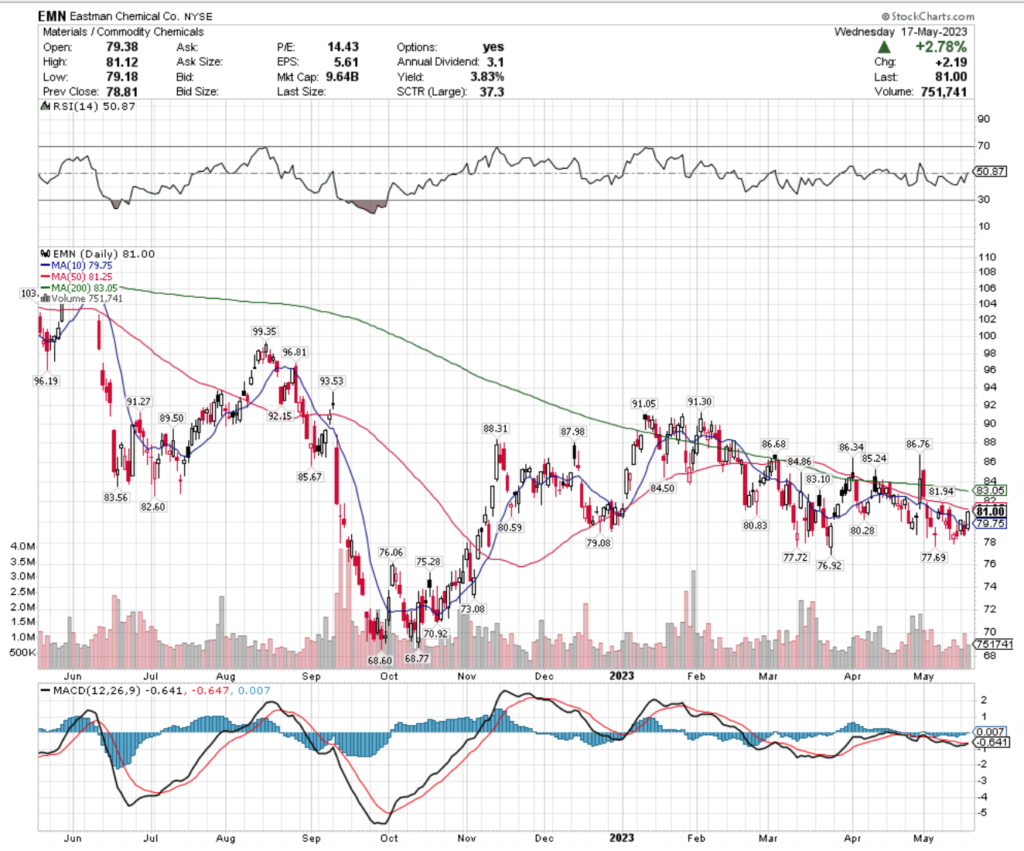
Eastman Chemical Co. stock trades under the ticker EMN & has shown recent bullishness that traders & investors should look deeper into to find opportunities for when market volatility has subsided.
EMN stock closed at $81.00/share on 5/17/2023.
Eastman Chemical CO. EMN Stock’s Technical Performance Broken Down
Eastman Chemical CO. EMN Stock’s Technical Performance Over The Past Year
EMN Stock Price: $81.00
10 Day Moving Average: $79.75
50 Day Moving Average: $81.25
200 Day Moving Average: $83.05
RSI: 50.87
MACD: -0.641, -0.647, 0.007
Yesterday, EMN stock completed a bullish MACD crossover, gaining +2.78% on the day’s session.
Their RSI is neutral at 50.87 & recent trading volumes have been about average compared to the year prior.
Investors would be wise to watch how they behave around their support levels in the near-term while planning an entry point for when markets have become less volatile, while traders can use options in the meantime to profit from their price movements.
EMN stock has support at the $80.83, $80.59, $80.28 & $79.75/share (10 day moving average) price levels, with resistance at the $81.25 (50 day moving average), $81.94, $82.60 & $83.10/share price levels.
Eastman Chemical CO. EMN Stock As A Long-Term Investment
Long-term oriented investors will like EMN stock’s 14.86 P/E (ttm) & their 1.95 P/B (mrq).
They recently reported -11.1% Quarterly Revenue Growth Y-o-Y, with -43% Quarterly Earnings Growth Y-o-Y, which should be looked further into before making an investment.
Their balance sheet will also require a more thorough review, with $559M of Total Cash (mrq) & $5.74B of Total Debt (mrq).
EMN stock pays a 3.93% dividend, which appears it should be sustainable in the long-run, with a 54.67% payout ratio.
86.2% of EMN stock’s outstanding share float is owned by institutional investors.
Eastman Chemical CO. EMN Stock As A Short-Term Trade Using Options
Traders with shorter time horizons can use options to profit from EMN stock’s price movements, while protecting their portfolios from volatility.
I am looking at the contracts with the 6/16 expiration date.
The $80, $75 & $70 call options are in-the-money, listed from highest to lowest level of open interest.
The $85, $90 & $100 puts are also all in-the-money, with the former being more liquid than the latter strikes.
Tying It All Together
EMN stock has many interesting characteristics that traders & investors will find appealing.
Investors will like their dividend yield & valuation metrics, but will want to research further into their balance sheet & recent growth metrics.
Traders will like their recent technical performance & relatively liquid options.
All-in-all, it is worth taking a closer look into EMN stock to see how it fits into your portfolio strategy for when market volatility has died down.
*** I DO NOT OWN SHARES OR OPTIONS CONTRACT POSITIONS IN EMN STOCK AT THE TIME OF PUBLISHING THIS ARTICLE ***
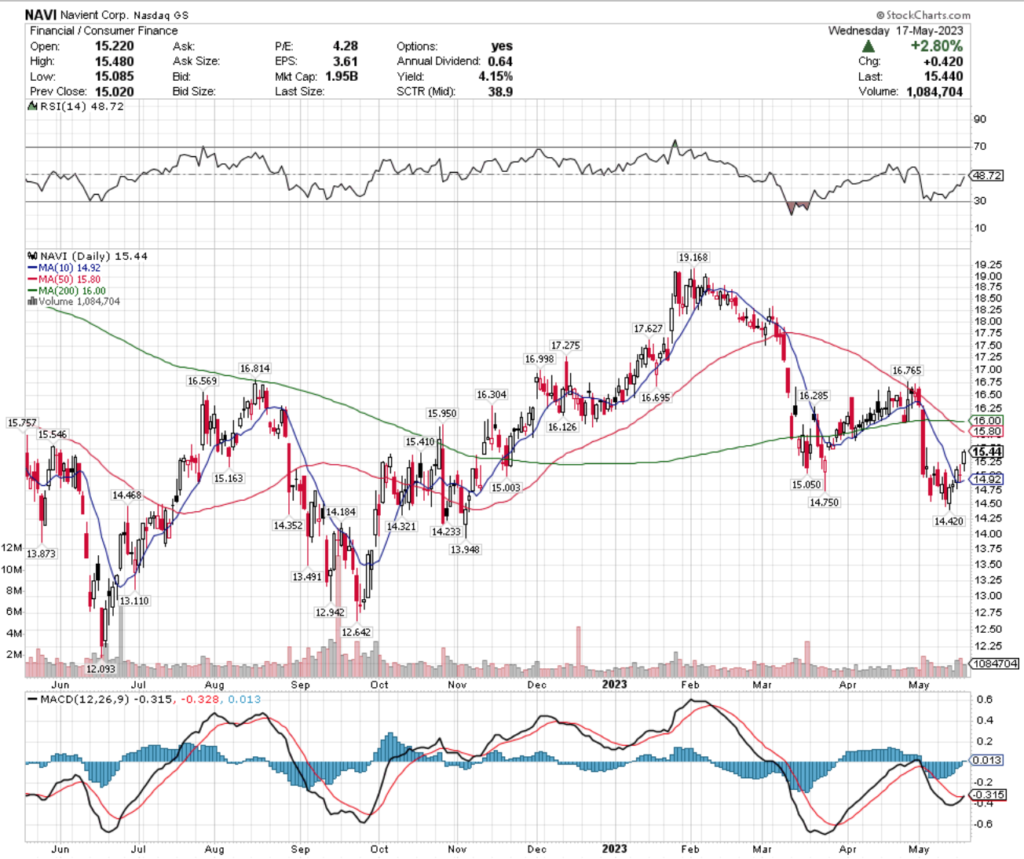
Navient Corp. stock trades under the ticker NAVI & has shown recent bullishness that traders & investors should research further into for when market volatility has subsided.
NAVI stock closed at $15.44/share on 5/17/2023.
Navient Corp. NAVI Stock’s Technical Performance Broken Down
Navient Corp. NAVI Stock’s Technical Performance Over The Past Year
NAVI Stock Price: $15.44
10 Day Moving Average: $14.92
50 Day Moving Average: $15.80
200 Day Moving Average: $16.00
RSI: 48.72
MACD: -0.315, -0.328, 0.013
Yesterday, NAVI stock completed a bullish MACD crossover, gaining +2.8% on the day’s session.
Their RSI is in neutral range at 48.7, with recent trading volumes being average/just below average compared to the year prior.
Investors would be wise to watch how NAVI stock behaves around its support levels in the coming weeks to plan where to enter once the markets have become less volatile, while traders can use options in the meantime to profit from the swings in their price level.
NAVI has support at the $15.41, $15.16, $15.05 & $15 price levels, with resistance at the $15.55, $15.76, $15.80 (50 day moving average) & $15.95/share price levels.
Navient Corp. NAVI Stock As A Long-Term Investment
Long-term focused investors will like NAVI stock’s 4.46 P/E (ttm), as well as their 0.7 P/B (mrq).
They recently reported -38.2% Quarterly Revenue Growth Y-o-Y, with -56.5% Quarterly Earnings Growth Y-o-Y, which investors will want to research deeper into before investing.
Their balance sheet will also require a more thorough review, with $643M of Total Cash (mrq) & $63.37B of Total Debt (mrq).
NAVI stock pays a 4.26% dividend, which appears to be sustainable in the long-run, as their payout ratio is 17.39%.
96.38% of NAVI stock’s outstanding share float is owned by institutional investors.
Navient Corp. NAVI Stock As A Short-Term Trade Using Options
Short-term oriented traders can use options to profit from NAVI stock’s price movements, while protecting their portfolios from volatility.
NAVI stock has limited liquidity in their near-term options prices.
The for call options, the $15 5/19 expiration dated contracts, $15 6/16 expiration dated contracts & $15 7/21 dated contracts are all in-the-money.
For puts, currently the only in-the-money strike price are the $17.50 puts that expire on 7/21.
Tying It All Together
NAVI stock has many interesting characteristics that traders & investors should research further into for when markets become less volatile.
Investors will like their valuation metrics & dividend yield, but may want to look into their recent growth metrics, as well as their balance sheet before investing.
Traders will like their recent technical performance, but will be disappointed by the current, less than liquid state of their options.
Overall, it is worth taking a closer look at NAVI stock to see how it fits into your portfolio strategy.
*** I DO NOT OWN SHARES OR OPTIONS CONTRACTS IN NAVI STOCK AT THE TIME OF PUBLISHING THIS ARTICLE ***
Capital One Financial Corp. stock trades under the ticker COF & has shown recent bullishness that traders & investors should research further into for when market volatility has calmed down.
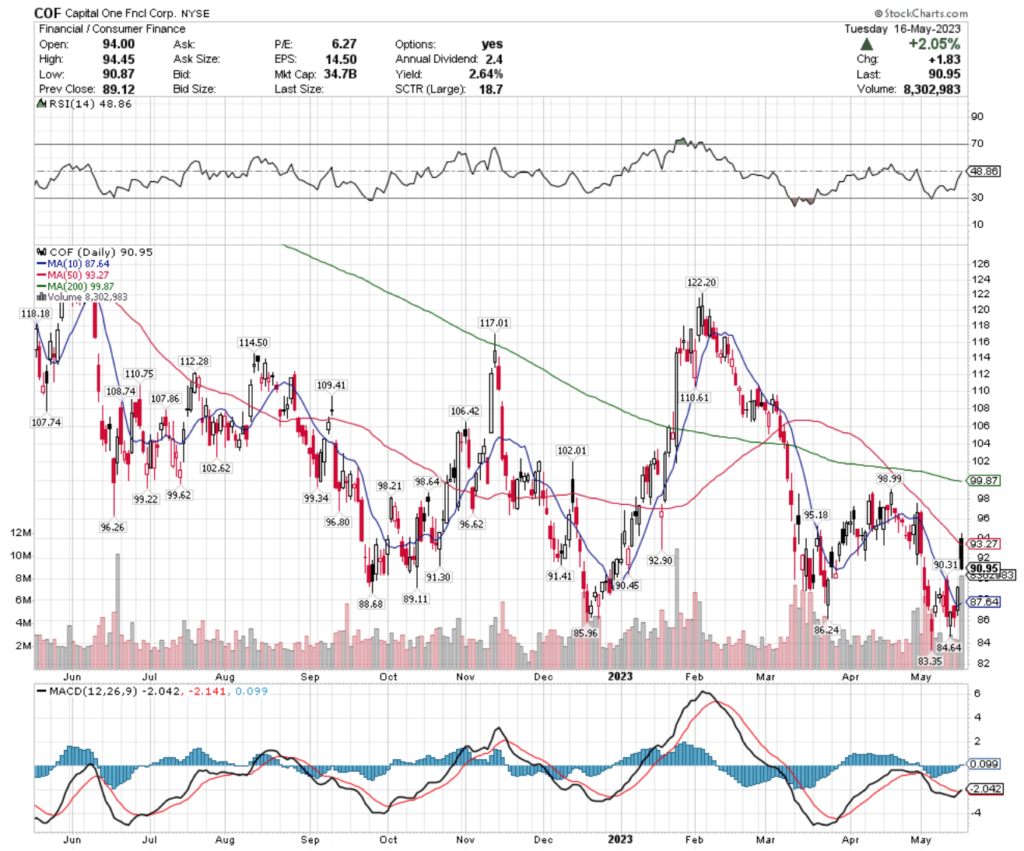
COF stock closed at $90.95/share on 5/16/2023.
Capital One Financial Corp. COF Stock’s Technical Performance Broken Down
Capital One Financial Corp. COF Stock’s Technical Performance Over The Past Year
COF Stock Price: $90.95
10 Day Moving Average: $87.64
50 Day Moving Average: $93.27
200 Day Moving Average: $99.87
RSI: 48.86
MACD: -2.042, -2.141, 0.099
Yesterday, COF stock completed a bullish MACD crossover, gapping up +2.05% on the day’s sessions.
Their RSI is slightly in the oversold end of neutral at 48.86, with their recent volumes being above average.
Yesterday’s session had a major volume spike, but closed -3.24% below the day’s open, signaling uncertainty in the near-term for COF stock’s price movements.
Investors are best off waiting to see how they behave at support levels in the next couple of weeks before entering a position, while traders can profit in that time using options strategies around the volatility.
COF has support at the $90.45, $90.31, $89.11 & $88.68/share price levels, with resistance at the $91.30, $91.41, $92.90 & $93.27/share (50 day moving average) price levels.
Capital One Financial Corp. COF Stock As A Long-Term Investment
Long-term oriented investors will like COF stock’s 5.43 P/E (ttm), as well as their 0.71 P/B (mrq).
They recently reported 18.5% Quarterly Revenue Growth Y-o-Y, with -60% Quarterly Earnings Growth Y-o-Y, which will need to be looked deeper into before making an investment.
Their balance sheet will require a more thorough review, with $48.14B of Total Cash (mrq) & $53.04B of Total Debt (mrq).
COF stock pays a 2.69% dividend, which appears to be sustainable in the long-run, as their payout ratio is 16.44%.
90.54% of COF stock’s outstanding share float is owned by institutional investors.
Capital One Financial Corp. COF Stock As A Short-Term Trade Using Options
Traders with shorter time horizons can trade options to profit from COF stock’s price movements, while protecting their portfolios from volatility.
I am looking at the contracts with the 6/16 expiration date.
The $85, $90 & $80 call options are all in-the-money, with the former being more liquid than the latter strikes.
The $100, $95 & $105 puts are also all in-the-money, listed from highest to lowest level of open interest.
Tying It All Together
Capital One Financial Corp. stock has many interesting attributes that traders & investors will find appealing.
Investors will like their valuation metrics, balance sheet & dividend yield, but may want to review the causes of their recent growth trouble before investing.
Traders will like their recent technical performance, as well as their liquid options.
All-in-all, it is worth taking a closer look into how COF stock fits into your portfolio strategy.
*** I DO NOT OWN SHARES OR OPTIONS CONTRACT POSITIONS IN COF STOCK AT THE TIME OF PUBLISHING THIS ARTICLE ***
Texas Instruments, Inc. stock trades under the ticker TXN & has shown recent bullish behavior that traders & investors may want to look closer into for when market volatility has subsided.
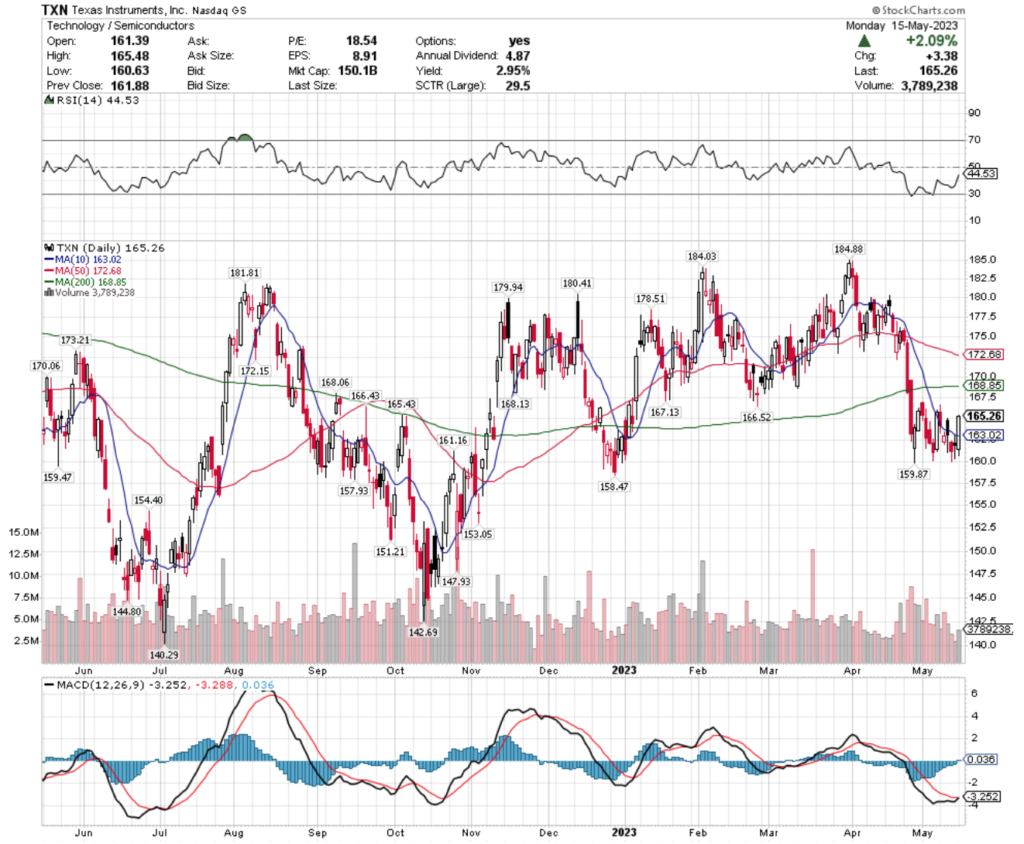
TXN stock closed at $165.26/share on 5/15/2023.
Texas Instruments, Inc. TXN Stock’s Technical Performance Broken Down
Texas Instruments, Inc. TXN Stock’s Technical Performance Over The Past Year
TXN Stock Price: $165.26
10 Day Moving Average: $163.02
50 Day Moving Average: $172.68
200 Day Moving Average: $168.85
RSI: 44.53
MACD: -3.25
Yesterday, TXN stock completed a bullish MACD crossover, gaining +2.09% on the day’s session.
Their RSI is on the oversold end of neutral at 44.53, with recent trading volumes being below average compared to the year prior, signaling uncertainty among investors.
Traders & investors should begin to watch how TXN stock behaves around its support levels in the coming weeks ahead, in order to begin planning where to enter a position once the market becomes less volatile.
TXN stock has support at the $163.02 (10 day moving average), $161.16, $159.47 & $158.47/share price levels, with resistance at the $165.43, $166.43, $166.52 & $167.13/share price levels.
Texas Instruments, Inc. TXN Stock As A Long-Term Investment
Investors focused on longer time horizons will like TXN stock’s 18.61 P/E (ttm), but may find their 9.87 P/B (mrq) to be a bit too rich.
They recently reported -10.7% Quarterly Revenue Growth Y-o-Y, with -22.4% Quarterly Earnings Growth Y-o-Y, which investors may want to review further before entering a position.
Their balance sheet at first glance is much more appealing than many of their peers, with $9.54B of Total Cash (mrq) & $10.13B of Total Debt (mrq).
TXN stock pays a 2.95% dividend, which appears to be sustainable in the long-run, as their payout ratio is 53.7%.
87.6% of TXN stock’s outstanding share float is owned by institutional investors.
Texas Instruments, Inc. TXN Stock As A Short-Term Trade Using Options
Traders with shorter time horizons can trade options to profit from price movements in TXN stock’s price, while protecting their portfolios from broader market volatility.
I am looking at the contracts with the 6/16 expiration date.
The $155, $165 & $150 call options are all in-the-money, listed from highest to lowest level of open interest.
The $170, $175 & $180 puts are also all in-the-money, with the former being more liquid than the latter strike prices.
Tying It All Together
TXN stock has many interesting characteristics that traders & investors will find appealing.
Investors will like their dividend yield, as well as their balance sheet when compared to their peers.
Traders will like their recent technical performance, as well as how liquid their options are.
Overall, it is worth taking a closer look into how TXN stock fits into your portfolio strategy.
*** I DO NOT OWN SHARES OR OPTIONS CONTRACT POSITIONS IN TXN STOCK AT THE TIME OF PUBLISHING THIS ARTICLE ***
On Friday afternoon I found myself at happy hour, pen in hand, modeling out volume data on some of my holdings & hedges.
I was mostly interested in seeing how the volume has been at their support & resistance levels, as well as at & around the strike prices of my options contracts, which led me to the idea of doing the same exercise (in Excel this time) for ETFs that track the major stock indexes.
The methodology is relatively simple (feel free to skip ahead to the data in the next heading section if this portion is not of interest); first, look at the Point & Figure charts’ time horizons & match the candlestick charts to the closest time period (based on my account permissions), then find the resistance & support levels on the candlestick charts for said time period.
After, using the Volume By Price layover data on the Point & Figure charts, I looked at the Buyer vs. Seller Volume at each price level & recorded the volume trends for each price level’s relevant box as a ratio & applied the data to the individual support/resistance/strike prices (my notebook exercise had more layers of relevant detail & indicators to my specific trades, but this is what is being used in the following article).
Those ETFs were chosen due to their coverage of the major U.S. market indexes, but the methodology can be applied to other securities as well, with further customizations.
The data & tables presented below are meant to serve as a reference guide to trader/investor sentiment for each price level being presented.
Please note that some of the observed data may not be complete/was unable to be accounted for (most likely due to sampling), leading to some ratio figures that are unconventional, which are all marked with a “*” & can be referenced in any of the images that accompany each section.
The following is meant to serve as a reference to how market participants have behaved historically at these price levels & is neither investment advice nor recommendations of any kind.
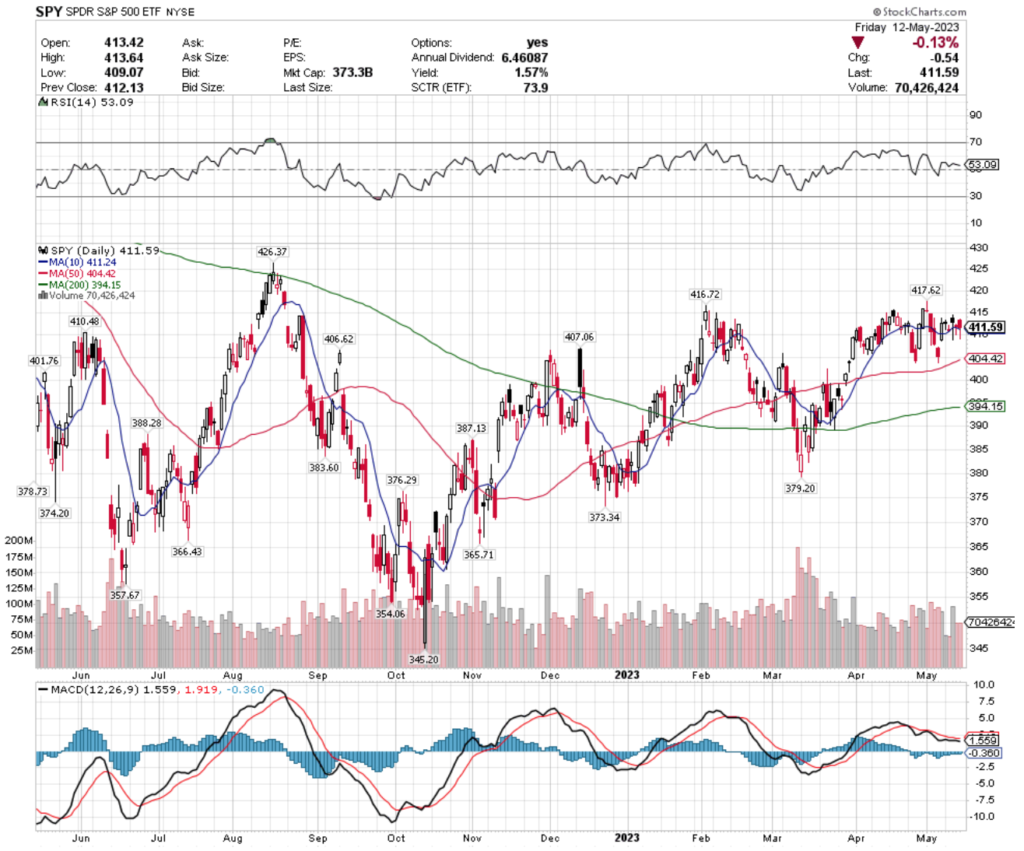
SPY, The S&P 500 ETF’s Volume Analysis At Support & Resistance Points
SPY, the ETF that is most often referred to for tracking the returns of the S&P 500’s Point & Figure Chart is below, showing the volume overlays along with the 10 & 50 day moving averages & support lines for a period of roughly the past 2 years.
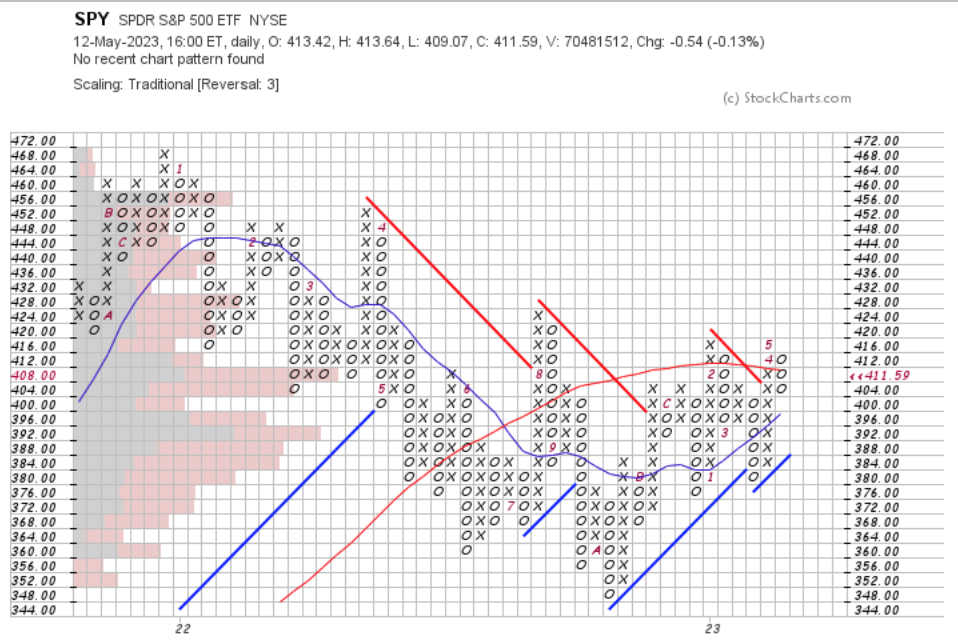
SPY ETF – SPDR S&P 500 ETF Point & Figure Chart
As the chart goes back ~2 years, I selected the 2 year SPY candlestick chart as well to make them match as closest as possible, given the limitations of the toolset that I was using, where we are able to see the support & resistance levels for that time period, as well as the moving averages & other indicator data.
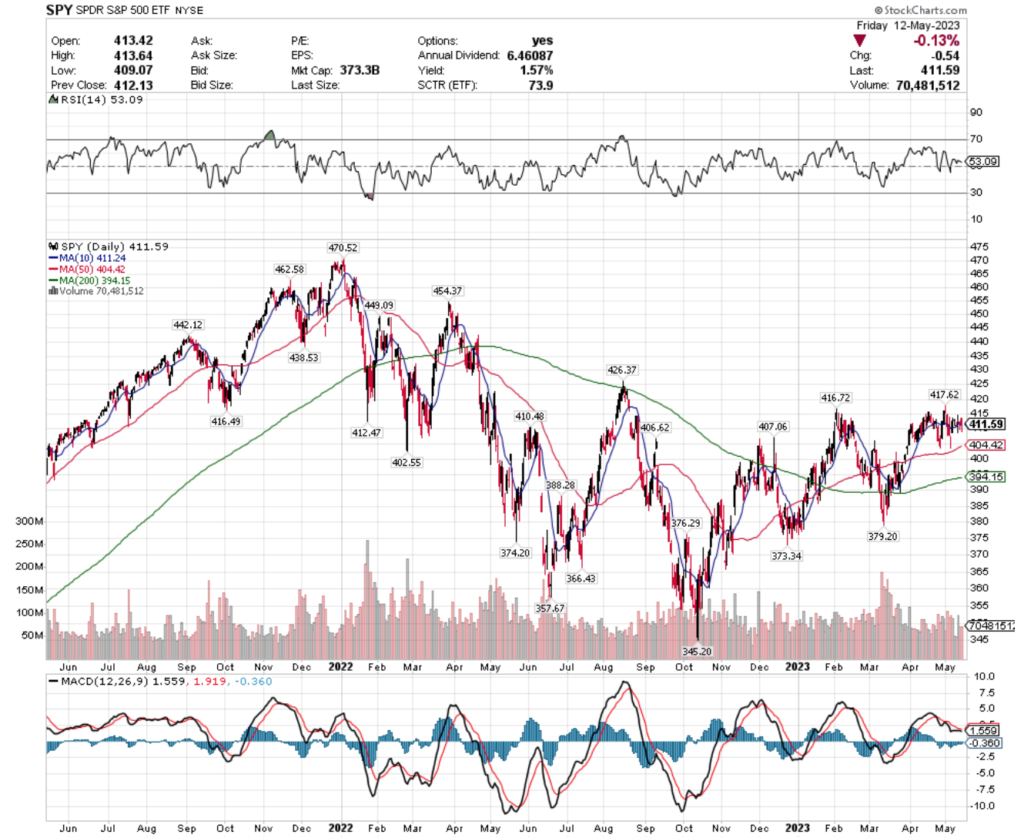
SPY ETF – SPDR S&P 500’s Technical Performance Over The Past Two Years
SPY closed on Friday 5/12/2023 at $411.49/share, which would place it in the Point & Figure percentage box range for the $408/share price level.
At $408/share over the past year, SPY’s volume has favored the Sellers by 1.57:1 (I counted the boxes by hand/estimated the fraction of boxes, this did not come from raw data).
The $412/share box covers all prices that go from $412.00-$415.99, where Buyers are dominating the volume 3:1, which is one of the 5 strongest price levels in terms of their ratio.
The $404/share box covers $404-$407.99 SPY prices, where the Sellers are favored 1.90:1, before from $400 down to $392 the Buyers are back in control historically for the time period covered (1.133:1, 1.45:1 & 1.87:1, respectively), before the Sellers take back over from $388 down until $364.
SPY ETF’s Volume By Price Level, Including At Support & Resistance Levels From The Past Two Years
SPY’s current closest Resistance Levels for the time period, as well as their volume ratings are below:
$412.47 – Buyers – 3:1
$416.49 – Sellers – 1.33:1
$416.72 – Sellers – 1.33:1
$417.62 – Sellers – 1.33:1
$426.37 – Sellers – 1.24:1
$438.53 – Sellers – 1.32:1
$442.12 – Sellers – 1.35:1
$449.09 – Buyers – 1.89:1
$454.37 – Sellers – 1.25:1
$462.58 – Buyers – 1.5:0*
$470.52 – Buyers – 3.33:1
SPY’s Support Levels within that time period are below (BOLD denotes a moving average):
$411.24 – Sellers – 1.57:1(10 DMA)
$410.48 – Sellers – 1.57:1
$407.06 – Sellers – 1.9:1
$406.62 – Sellers- 1.9:1
$404.42 – Sellers – 1.9:1 (50 DMA)
$402.55 – Buyers – 1.13:1
$394.15 – Buyers – 1.87:1 (200 DMA)
$388.28 – Sellers – 1.5:1
$379.20 – Sellers – 1.63:1
$374.20 – Sellers – 1.37:1
$373.34 – Sellers – 1.37:1
$366.43 – Sellers – 3.71:1
$357.67 – Sellers – 2.2:0*
$345.2 – NULL – 0:0*
SPY’s Point & Figure price levels are listed below, with their respective volume sentiment:
$472 – NULL – 1:1
$468 – Buyers – 3.33:1
$464 – Sellers – 3.33:1
$460 – Buyers – 1.5:0*
$456 – Buyers – 1.53:1
$452 – Sellers – 1.25:1
$448 – Buyers – 1.89:1
$444 – Buyers – 1.14:1
$440 – Sellers – 1.35:1
$436 – Sellers – 1.32:1
$432 – Buyers – 4.25:1
$428 – Sellers – 1.56:1
$424 – Sellers – 1.24:1
$420 – Sellers – 1.30:1
$416 – Sellers – 1.33:1
$412 – Buyers – 3:1
$408 – Sellers – 1.57:1
$404 – Sellers – 1.90:1
$400 – Buyers – 1.13:1
$396 – Buyers – 1.45:1
$392 – Buyers – 1.87:1
$388 – Sellers – 1.5:1
$384 – Sellers – 2.38:1
$372 – Sellers – 1.37:1
$380 – Sellers – 2.14:1
$376 – Sellers – 1.63:1
$368 – Sellers – 1.91:1
$364 – Sellers – 3.71:1
$360 – NULL – 3:3
$356 – Sellers – 2.2:0*
$352 – Sellers – 3:0*
$348 – NULL 0:0*
$344 – NULL – 0:0*
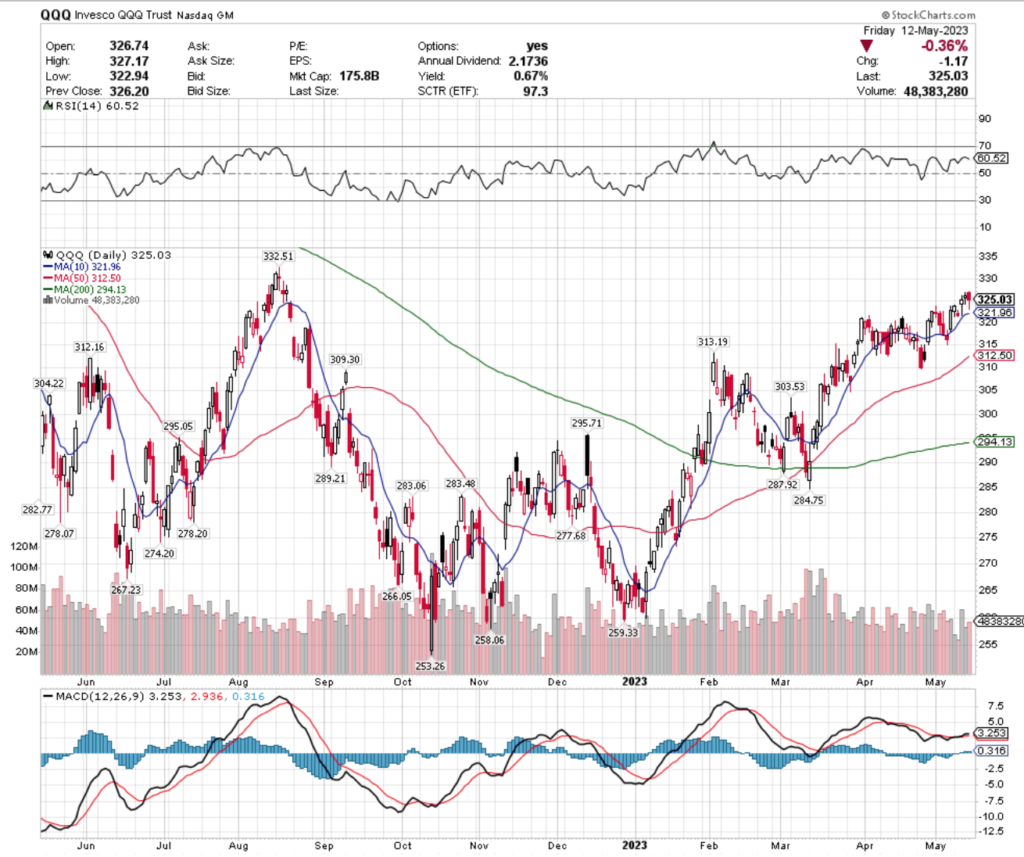
QQQ, the Invesco QQQ Trust, Tracking The NASDAQ ETF’s Volume Analysis At Support & Resistance Points
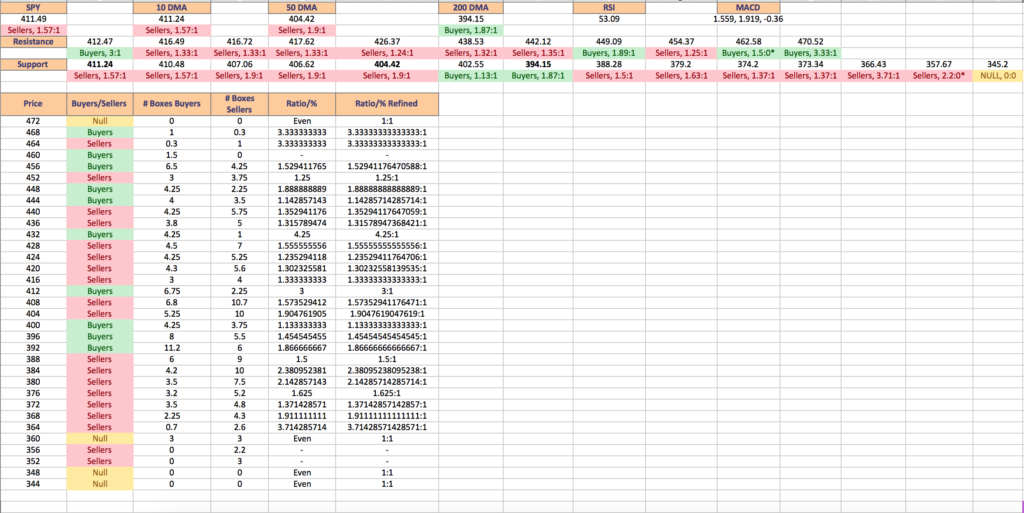
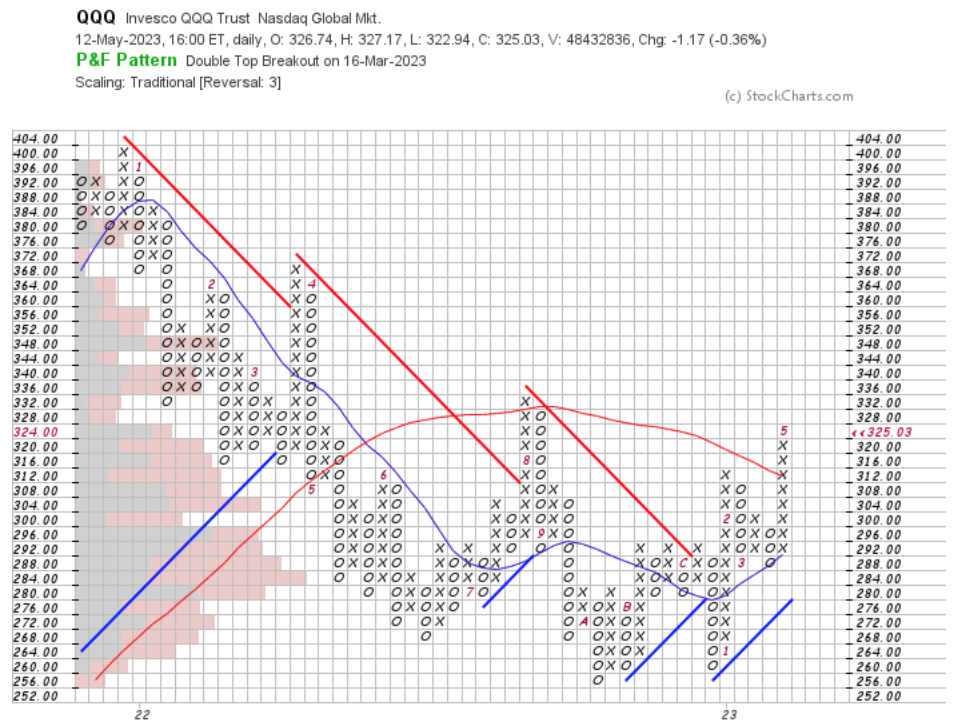
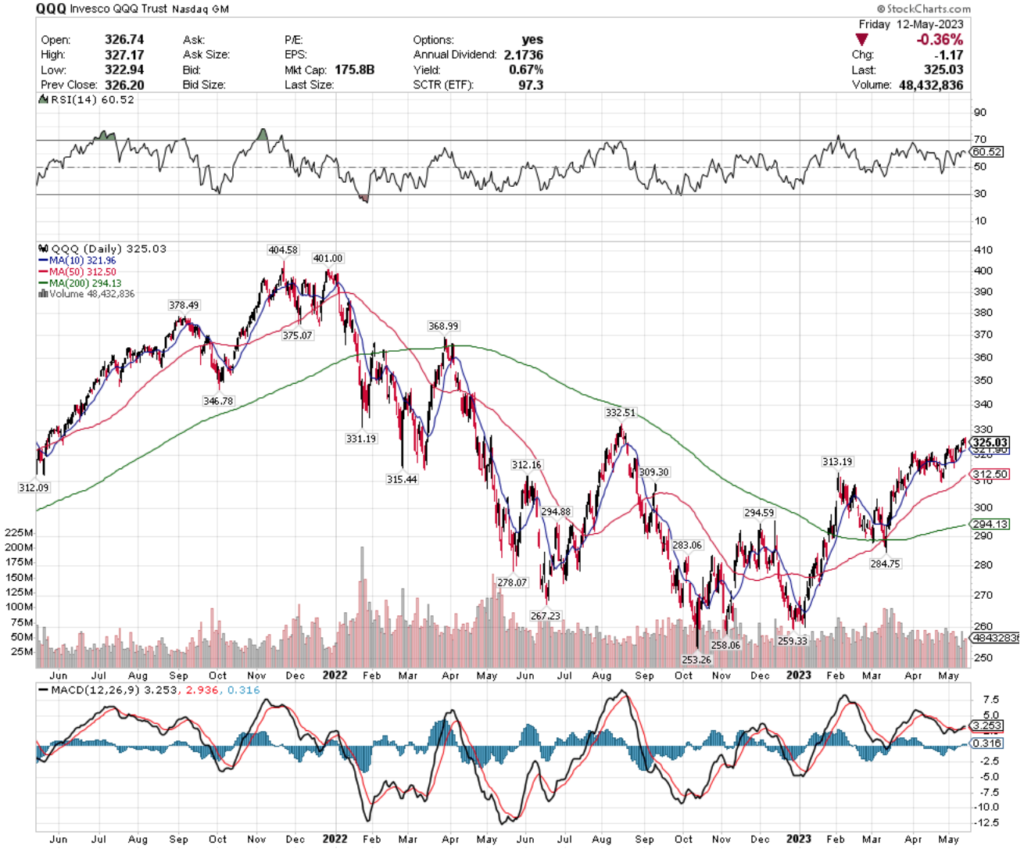
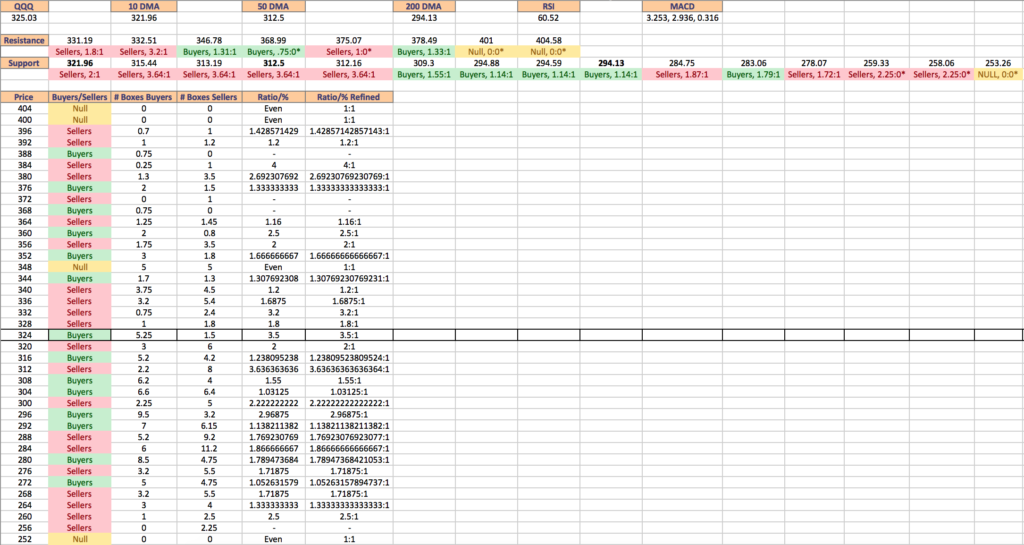
The QQQ ETF is often used as a proxy for the performance of the NASDAQ index & closed at $325.03/share on Friday 5/12/2023.
Their Point & Figure chart was closer to a year & a half, so a two year candlestick chart was selected in order to observe their support & resistance levels.
At $325.03, QQQ is currently in the $324/share box range, which for the past year & a half has been dominated by Buyers, at a rate of 5.3:1.
QQQ ETF – The Invesco QQQ Trust ETF’s Technical Performance Over The Past Two Years
The neighboring $328/share box is a Sellers range at 1.8:1, and the neighboring 3 higher levels have also been dominated by Sellers in this time period (3.2:1, 1.69:1 & 1.2:1), with the $320/share box also being a Sellers range at a rate of 2:1.
QQQ ETF’s Volume By Price Level, Including At Support & Resistance Levels From The Past Two Years
QQQ’s Resistance Levels For The Past Two Years & Their Volume Sentiment:
$331.19 – Sellers – 1.8:1
$332.51 – Sellers – 3.2:1
$346.78 – Buyers – 1.31:1
$368.99 – Buyers – 0.75:0*
$375.07 – Sellers – 1:0*
$378.49 – Buyers – 1.33:1
$401 – NULL – 0:0*
$404.58 – NULL – 0:0*
QQQ’s Support Levels for that time period are below (BOLD denotes moving average level):
$321.96 – Sellers – 2:1 (10 DMA)
$315.44 – Sellers – 3.64:1
$313.19 – Sellers – 3.64:1
$312.50 – Seller s- 3.64:1 (50 DMA)
$312.16 – Sellers – 3.64:1
$309.30 – Buyers – 1.55:1
$294.88 – Buyers – 1.14:1
$294.59 – Buyers – 1.14:1
$294.13 – Buyers – 1.14:1 (200 DMA)
$284.75 – Sellers – 1.87:1
$283.06 – Buyers – 1.79:1
$278.07 – Sellers – 1.72:1
$259.33 – Sellers – 2.25:0*
$258.06 – Sellers – 2.25:0*
$253.26 – NULL – 0:0*
QQQ’s Point & Figure price levels are listed below, with their respective volume sentiment:
$404 – NULL – 0:0*
$400 – NULL – 0:0*
$396 – Sellers – 1.43:1
$392 – Sellers – 1.2:1
$388 – Buyers – 0.75:0*
$384 – Sellers – 4:1
$380 – Sellers – 2.69:1
$376 – Buyers – 1.33:1
$372 – Sellers – 1:0*
$368 – Buyers – 0.75:0*
$364 – Sellers – 1.16:1
$360 – Buyers – 2.5:1
$356 – Sellers – 2:1
$352 – Buyers – 1.67:1
$348 – NULL – 1:1
$344 – Buyers – 1.31:1
$340 – Sellers – 1.2:1
$336 – Sellers – 1.69:1
$332 – Sellers – 3.2:1
$328 – Sellers – 1.8:1
$324 – Buyers – 3.5:1
$320 – Sellers – 2:1
$316 – Buyers – 1.24:1
$312 – Sellers – 3.64:1
$308 – Buyers – 1.55:1
$304 – Buyers – 1.03:1
$300 – Sellers – 2.22:1
$296 – Buyers – 2.97:1
$292 – Buyers – 1.14:1
$288 – Sellers – 1.77:1
$284 – Sellers – 1.87:1
$280 – Buyers – 1.79:1
$276 – Sellers – 1.72:1
$272 – Buyers – 1.05:1
$268 – Sellers – 1.72:1
$264 – 1.33:1
$260 – Sellers – 2.5:1
$256 – Sellers – 2.25:0*
$252 – NULL – 0:0*
IWM, the iShares Russell 2000 ETF’s Volume Analysis At Support & Resistance Points
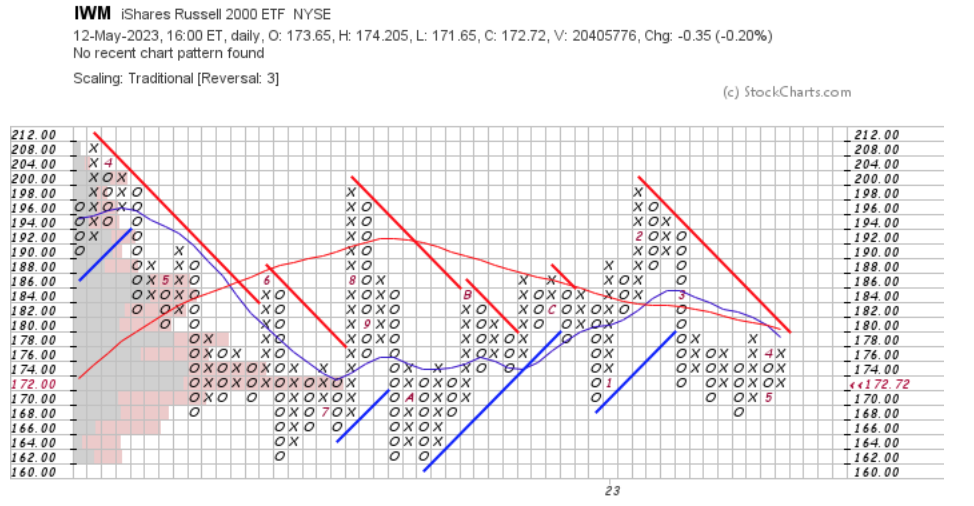
IWM, the ETF commonly used as a proxy for the performance of the Russell 2,000 small cap stocks had roughly a year & a half chart when I loaded their Point & Figure data, calling for a two year chart for the candlestick resources.
IWM ETF – iShares Russell 2000 ETF’s Point & Figure Chart
IWM closed at $172.72/share on Friday 5/12/2023, placing it in the $172/share box, which is currently dominated by the Sellers at a rate of 1.47:1.
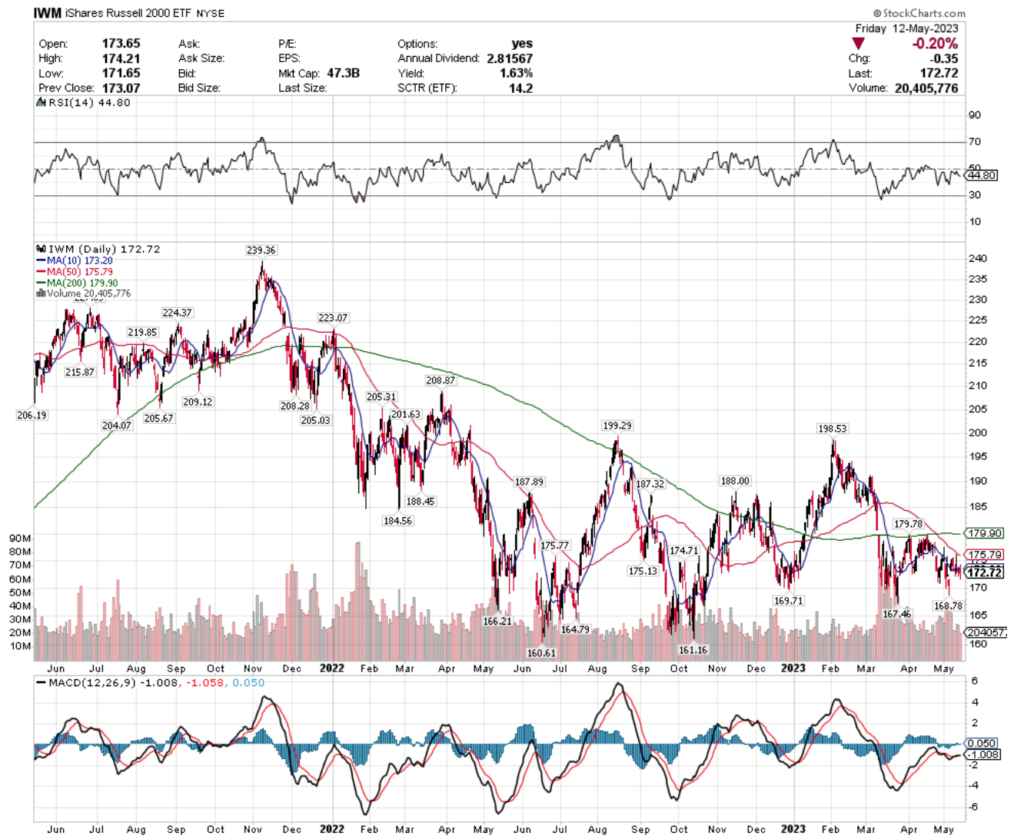
IWM ETF – iShares Russell 2000 ETF’s Technical Performance Over The Past Two Years
The next box above IWM’s current price level is $174, which has been won by the Buyers at a rate of 1.45:1 over the past 2 years, with their next leg lower being the $170 range, which has also been a Seller dominated zone at a rate of 2.17:1 in that time period.
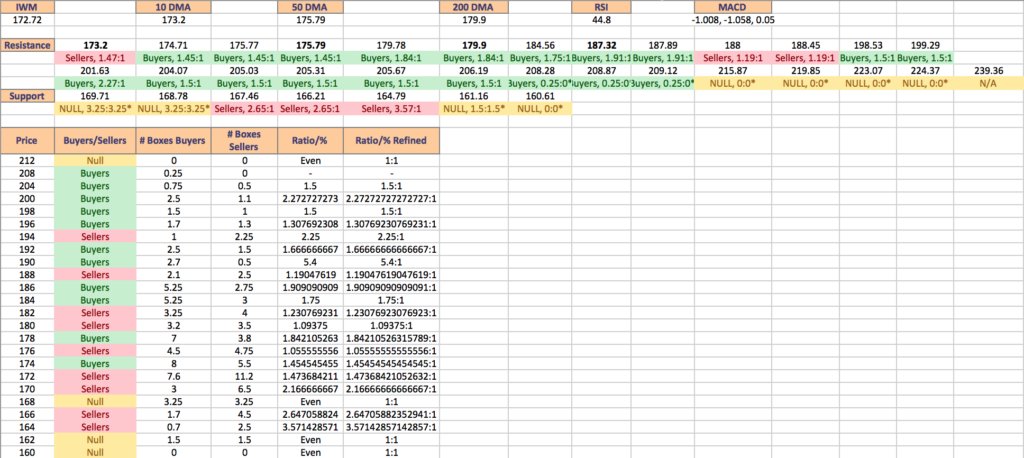
IWM ETF’s Volume By Price Level, Including At Support & Resistance Levels From The Past Two Years
IWM’s Resistance Levels For The Past Two Years & Their Volume Sentiment (BOLD denotes moving averages):
$173.20 – Sellers – 1.47:1 (10 DMA)
$174.71 – Buyers – 1.45:1
$175.77 – Buyers – 1.45:1
$175.79 – Buyers – 1.45:1 (50 DMA)
$179.78 – Buyers – 1.84:1
$179.90 – Buyers – 1.84:1 (200 DMA)
$184.56 – Buyers – 1.75:1
$187.32 – Buyers – 1.91:1
$187.89 – Buyers – 1.91:1
$188 – Sellers – 1.19:1
$188.45 – Sellers – 1.19:1
$198.53 – Buyers – 1.5:1
$199.29 – Buyers – 1.5:1
$201.63 – Buyers – 2.27:1
$204.07 – Buyers – 1.5:1
$205.03 – Buyers – 1.5:1
$205.31 – Buyers – 1.5:1
$205.67 – Buyers – 1.5:1
$206.19 – Buyers – 1.5:1
$208.28 – Buyers – 0.25:0*
$208.87 – Buyers – 0.25:0*
$209.12 – Buyers – 0.25:0*
$215.87 – NULL – 0:0*
$219.85 – NULL – 0:0*
$223.07 – NULL – 0:0*
$224.37 – NULL – 0:0*
$239.36 – N/A*
IWM’s Support Levels for that time period are below:
$169.71 – NULL – 1:1
$168.78 – NULL – 1:1
$167.46 – Sellers – 2.65:1
$166.21 – Sellers – 2.65:1
$164.79 – Sellers – 3.57:1
$161.16 – NULL – 1:1
$160.61 – NULL – 0:0*
IWM’s Point & Figure price levels are listed below, with their respective volume sentiment:
$212 – NULL – 0:0*
$208 – Buyers – 0.25:0*
$204 – Buyers – 1.5:1
$200 – Buyers – 2.27:1
$198 – Buyers – 1.5:1
$196 – Buyers – 1.31:1
$194 – Sellers – 2.25:1
$192 – Buyers – 1.67:1
$190 – Buyers – 5.4:1
$188 – Sellers – 1.19:1
$186 – Buyers – 1.91:1
$184 – Buyers – 1.75:1
$182 – Sellers – 1.23:1
$180 – Sellers – 1.09:1
$178 – Buyers – 1.84:1
$176 – Sellers – 1.06:1
$174 – Buyers – 1.45:1
$172 – Sellers – 1.47:1
$170 – Sellers – 2.17:1
$168 – NULL – 1:1
$166 – Sellers – 2.65:1
$164 – Sellers – 3.57:1
$162 – NULL – 1:1
$160 – NULL – 0:0*
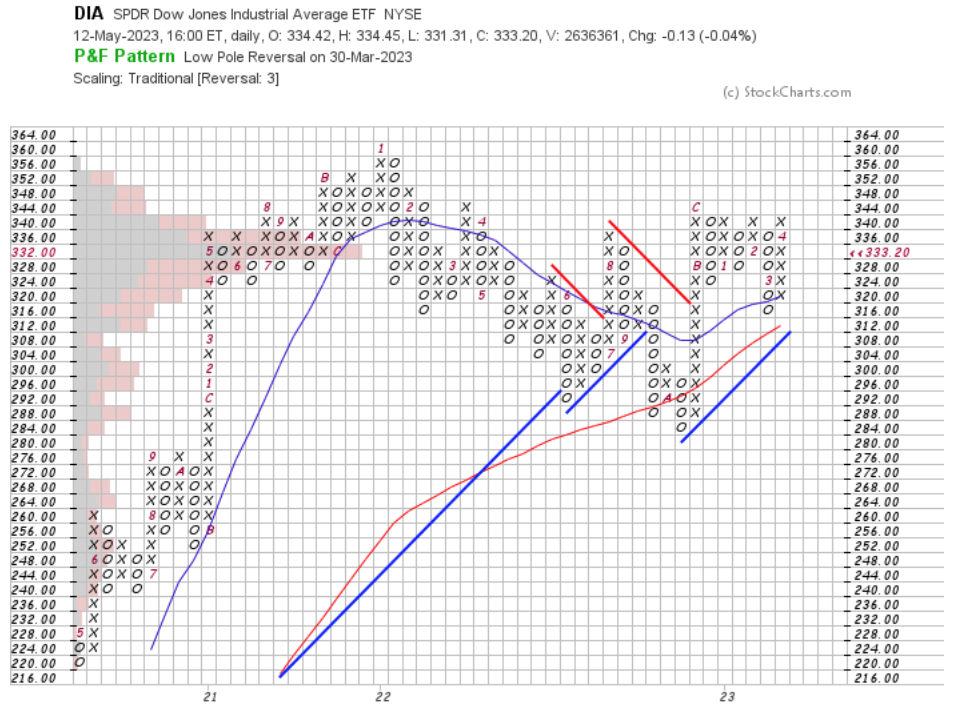
DIA, the SPDR Dow Jones Industrial Average ETF’s Volume Analysis At Support & Resistance Points
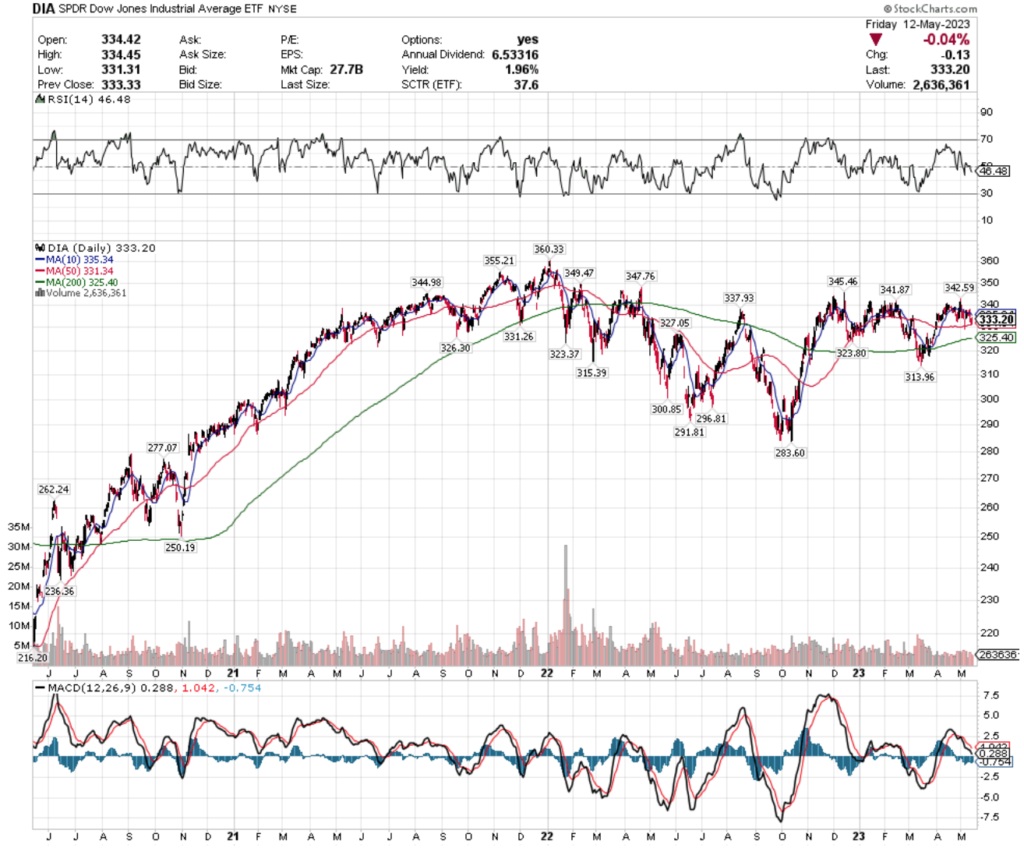
DIA is an ETF that is used to track the performance of the Dow Jones Industrial Average, whose Point & Figure Chart had closer to 3 year’s worth of data in the view, which called for using a 3 year candlestick chart for finding support & resistance levels.
DIA ETF – SPDR Dow Jones Industrial Average ETF’s Point & Figure Chart
DIA closed at $333.20/share on 5/12/2023, placing it in the $332 box in the data, which is currently favoring the Buyers 1.20:1.
DIA ETF – SPDR Dow Jones Industrial Average ETF’s Technical Performance Over The Past Two Years
The next 2 higher boxes are both in favor of the Buyers ($336 = 1.01:1 & $340 = 1.71:1), with the next 4 lower boxes being in favor of the Sellers ($328 = 1.35:1, $324 = 1.19:1, $320 = 1.4:1 & $316 = 1.88:1).
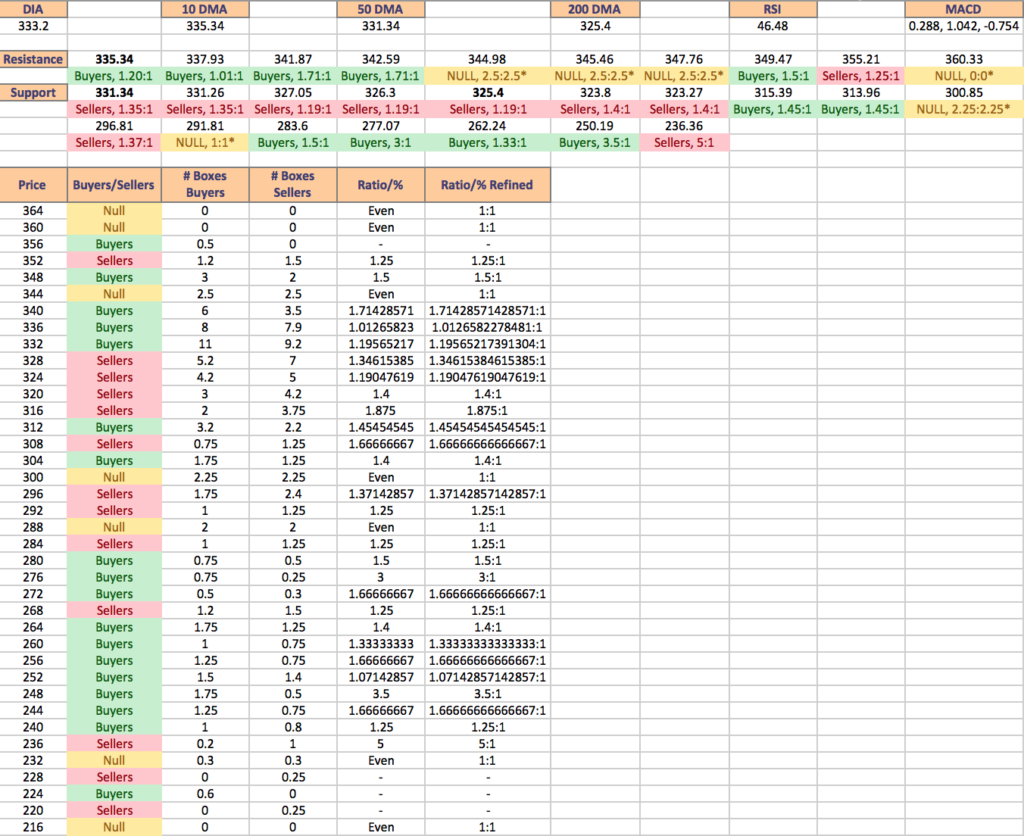
DIA ETF’s Volume By Price Level, Including At Support & Resistance Levels From The Past Three Years
DIA’s Resistance Levels For The Past Two Years & Their Volume Sentiment (BOLD denotes moving averages):
$335.34 – Buyers – 1.2:1 (10 DMA)
$337.93 – Buyers – 1.01:1
$341.87 – Buyers – 1.71:1
$342.59 – Buyers – 1.71:1
$344.98 – NULL – 1:1
$345.46 – NULL – 1:1
$347.76 – NULL – 1:1
$349.47 – Buyers – 1.5:1
$355.21 -Sellers – 1.25:1
$360.33 – NULL – 0:0*
DIA’s Support Levels for that time period are below (BOLD denotes moving average levels):
$331.34 – Sellers – 1.35:1 (50 DMA)
$331.26 – Buyers – 1.01:1
$327.05 – Sellers – 1.19:1
$326.30 – Sellers – 1.19:1
$325.40 – Sellers – 1.19:1 (200 DMA)
$323.80 – Sellers – 1.4:1
$323.27 – Sellers – 1.4:1
$315.39 – Buyers – 1.45:1
$313.96 – Buyers – 1.45:1
$300.85 – NULL – 1:1
$296.81 – Sellers – 1.37:1
$291.81 – NULL – 1:1
$283.60 – Buyers – 1.5:1
$277.07 – Buyers – 3:1
$262.24 – Buyers – 1.33:1
$250.19 – Buyers – 3.5:1
$236.36 – Sellers – 5:1
DIA’s Point & Figure price levels are listed below, with their respective volume sentiment:
$364 – NULL – 0:0*
$360 – NULL – 0:0*
$356 – Buyers – 0.5:0*
$352 – Sellers – 1.25:1
$348 – Buyers – 1.5:1
$344 – NULL – 1:1
$340 -Buyers – 1.71:1
$336 – Buyers – 1.01:1
$332 – Buyers – 1.20:1
$328 – Sellers – 1.35:1
$324 – Sellers – 1.19:1
$320 – Sellers – 1.4:1
$316 – Sellers – 1.88:1
$312 – Buyers – 1.45:1
$308 – Sellers – 1.67:1
$304 – Buyers – 1.4:1
$300 – NULL – 1:1
$296 – Sellers – 1.37:1
$292 – Sellers – 1.25:1
$288 – NULL – 1:1
$284 – Sellers – 1.25:1
$280 – Buyers – 1.5:1
$276 – Buyers – 3:1
$272 – Buyers – 1.67:1
$268 – Sellers – 1.25:1
$264 – Buyers – 1.4:1
$260 – Buyers – 1.33:1
$256 – Buyers – 1.67:1
$252 – Buyers – 1.07:1
$248 – Buyers – 3.5:1
$244 – Buyers – 3.5:1
$240 – Buyers – 1.25:1
$236 – Sellers – 5:1
$232 – NULL – 1:1
$228 – Sellers – 0.25:0*
$224 – Buyers – 0.6:0*
$220 – Sellers – 0.25:0*
$216 – NULL – 0:0*
Tying It All Together
Volume is one of the best indicators of investor sentiment that can be applied to any time frame, price level, or price range to help paint a better picture of the market’s behavior.
While it does not predict what will happen in the future as market conditions are ever changing & new variables may be of more importance now than they were when these volume levels were read, it can provide a reference as to how investors may behave when the same levels are approached again.
This document was intended to show investor sentiment at levels of support & resistance that are currently relevant to their price levels, while also providing more widespread data that can be used as prices move away from the levels of support & resistance mentioned above.
It can be combined with a current analysis of markets to give more clarity into how investors have historically behaved when prices have been in the price levels listed during the relevant time periods to provide additional detail to your analysis.
It is not intended to serve as investment recommendations or advice.
*** I DO NOT OWN SHARES OR OPTIONS CONTRACT POSITIONS IN SPY, QQQ, IWM or DIA AT THE TIME OF PUBLISHING THIS ARTICLE ***
SPY, the SPDR S&P 500 ETF lost -0.25% over the past week & remained in the same range that it’s been in for the past month & a half.
SPY ETF – SPDR S&P 500 ETF’s Technical Performance Over The Past Year
Uncertainty is still in the air, as the last few days’ candlesticks could characterize the past week as “the week of the hanging man”.
SPY’s RSI is still neutral at 53, with volumes slightly dipping from the previous weeks, but remaining in-line with the year prior’s average volume range.
Their MACD is still bearish, but both lines are moving relatively flat as a result of the previous month’s trading range still being in tact.
SPY has support at the $411.24 (10 day moving average), $410.48, $407.06 & $406.62/share price levels, with resistance at the $416.49, $416.72, $417.62 & $426.37/share price levels.
QQQ, the Invesco QQQ Trust ETF climbed +0.66% over the past week, after getting off to a slow start on Monday followed by an upside pivot on Wednesday.
QQQ ETF – Invesco QQQ Trust ETF’s Technical Performance Over The Past Year
Much like SPY, their past week is also marred with uncertainty when you look at the candles, with Wednesday & Friday being hanging men & Thursday being a spinning top, all of whom’s real bodies stayed relatively in-line with one another.
QQQ’s RSI is on the oversold end of neutral at 60.52, but their volume has waned a bit compared to the year prior’s average this past week.
Their MACD is also relatively flat, with both lines sitting atop one another waiting for the catalyst that will send it in one direction or another.
QQQ has support at the $321.96 (10 day moving average), $313.19, $312.96 (50 day moving average) & $312.16/share price levels, with resistance at the $331.19, $332.51, $346.78 & $368.99/share price levels (resistance levels required a 2 year chart view).
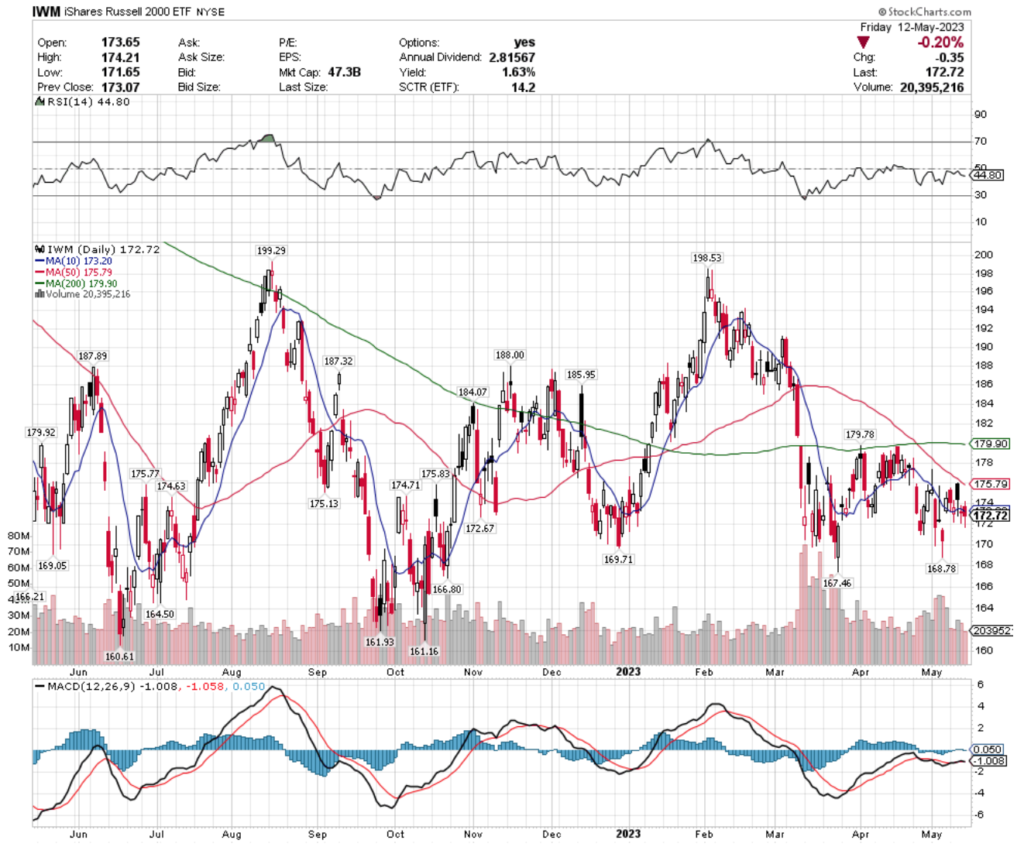
IWM, the iShares Russell 2000 ETF declined -0.99% over the past week, as investors fled from smaller cap names, mostly in favor of the larger NASDAQ components.
IWM ETF – iShares Russell 2000 ETF’s Technical Performance Over The Past Year
They too were not spared the uncertainty, with a week filled with hanging men & spinning top candlesticks as traders & investors await a signal as to which direction to move in.
Their RSI is on the more oversold end of neutral at 44.8, but trading volumes have remained relatively close to average compared to the year prior.
Their MACD is also in the same state of limbo as SPY’s & QQQ’s, although it is currently giving a slightly bullish reading.
IWM has support at the $172.67, $169.71, $169.05 & $168.78/share price levels, with resistance at the $173.20 (10 day moving average), 174.63, $174.71 & $175.13/share price levels.
Let’s dive into some of the best & worst performing market sectors & geo-locations based on this week’s technical analysis ratings!
Mexico (MEXX), U.S. Home Construction (ITB), Brazil Small Caps (BRF) & Global Gold Miners (RING) Are All Bullishly Leading The Market
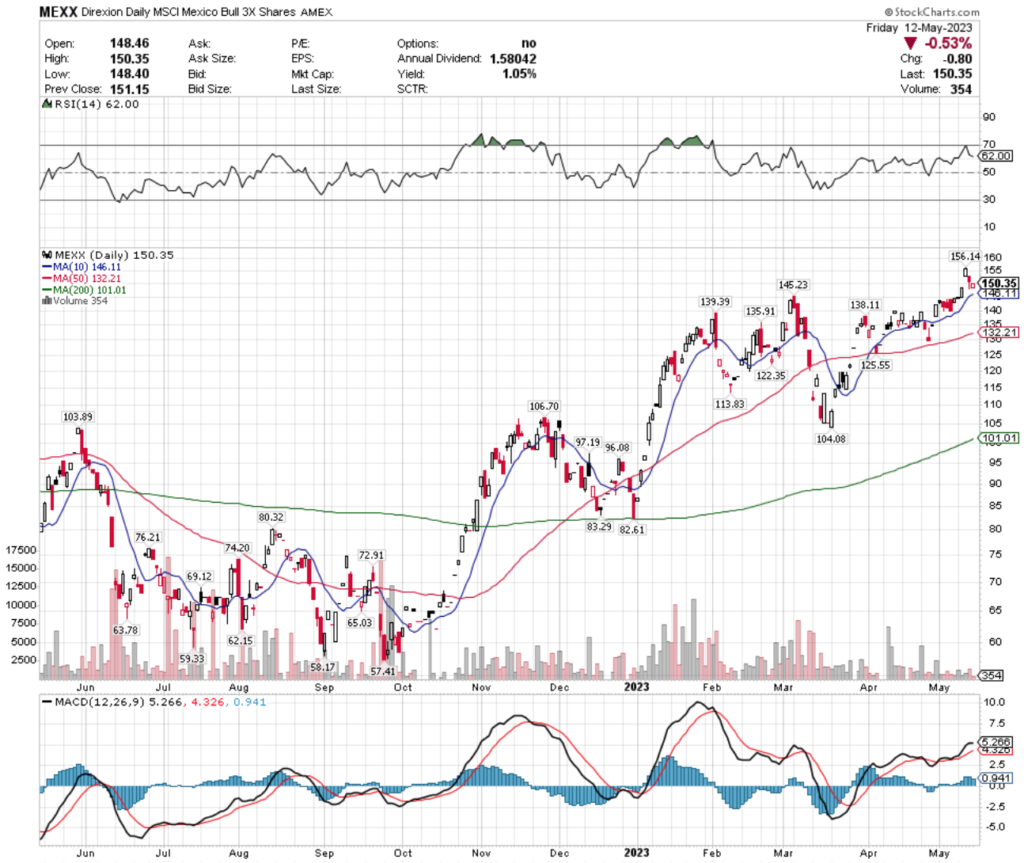
MEXX ETF – Direxion Daily MSCI Mexico Bull 3x Shares ETF’s Technical Performance Over The Past Year
After a year of explosive growth, MEXX’s volumes have declined to well below average compared to the year prior, signaling uncertainty in the near-term by investors.
Their RSI at 62 is on the overbought end of neutral & their MACD is beginning to show signs of a near-term bearish crossover, after two days of declines to fill the window following Wednesday’s gap up.
MEXX offers a 1.05% distribution yield to long-term holders, which will not provide much cushion against any impending consolidation or correction from their current high range for the past year.
This makes it important for investors to have a defensive options strategy in place for insurance such as buying puts or selling calls while they watch to see how MEXX behaves around support levels.
MEXX has support at the $146.11 (10 day moving average), $145.23, $139.39 & $138.11/share price levels, as they try to break out & above their $156.14, $159.55 & $162.16/share resistance levels (latter 2 are from 2019).
For investors who find too much risk in a 3x leveraged ETF, it is possible to get Mexico exposure via the EWW ETF, which was featured in our 4/23/2023 Weekly Notes.
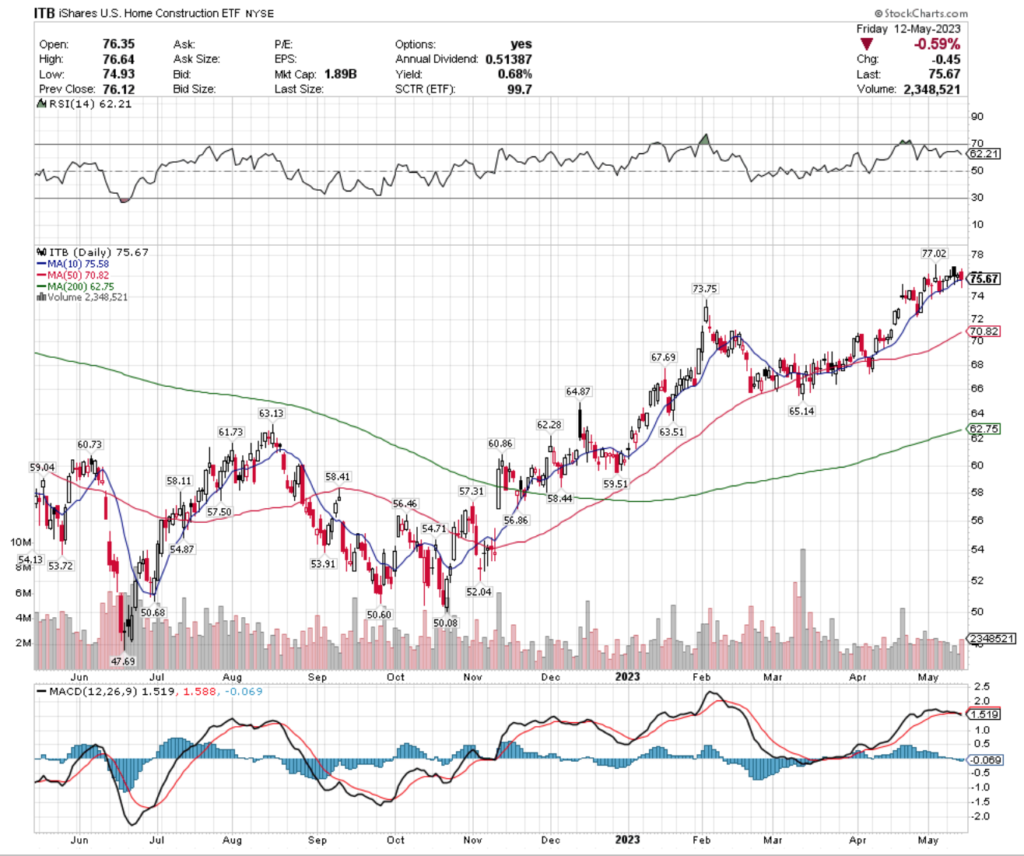
ITB ETF – iShares U.S. Home Construction ETF’s Technical Performance Over The Past Year
Much like MEXX, ITB & the U.S. Home Construction industry have been very bullish over the past year, but their volumes have waned less in recent days vs. MEXX & are much closer to average compared to the year prior’s levels.
This past week they remained relatively rangebound, with all of the real bodies of their candlesticks remaining at the same general price level, as traders & investors look for a catalyst to push them in one direction or another.
Their RSI is on the overbought end of neutral at 62, but their MACD has bearishly crossed over after spending the past week in a consolidation range.
With a modest 0.68% distribution yield for long-term holders there is limited cushion against losses from these steep price levels, making an insurance strategy against losses appealing while watching to see how they behave around their support levels in the near-term.
ITB has support at the $75.58 (10 day moving average), $73.75, $70.82 (50 day moving average) & $67.69, with resistance overhead at the $77.02, $77.51 & $82.52/share price levels (last 2 resistance levels are from 2021).
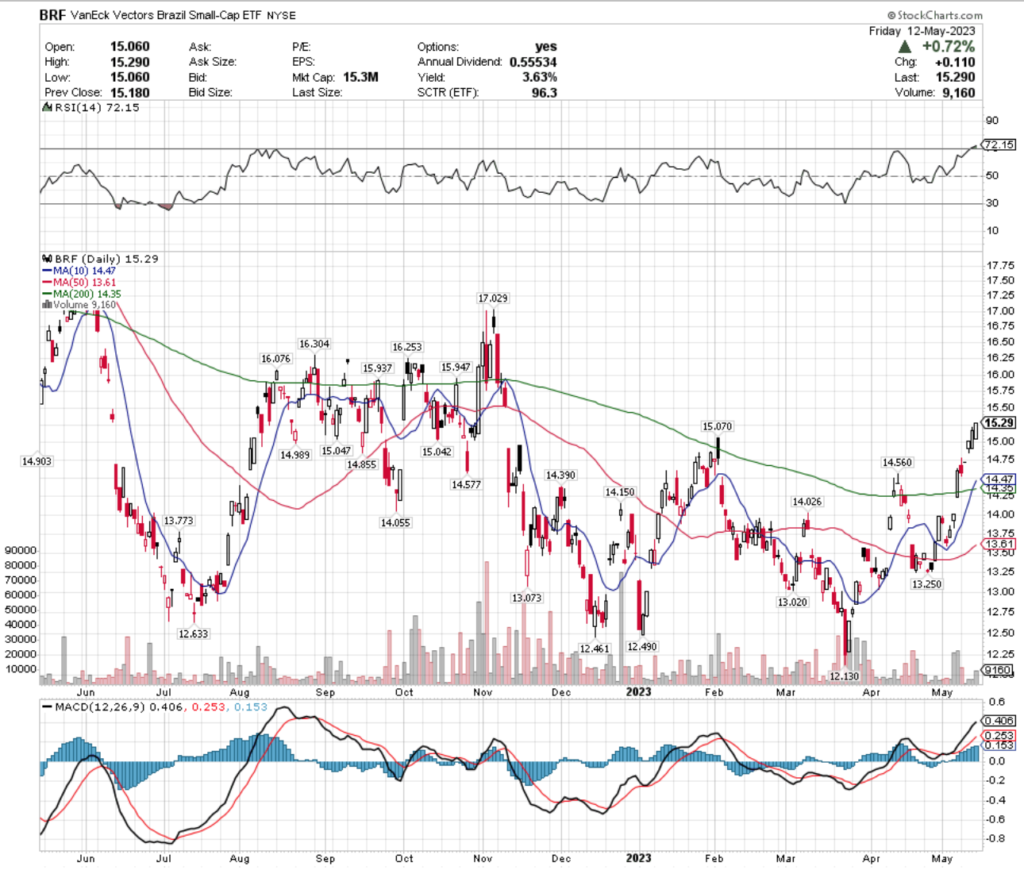
BRF ETF – VanEck Vectors Brazil Small-Cap ETF’s Technical Performance Over The Past Year
While they have fallen over the past year, their recent recovery in 2023 has shown strength compared to other ETFs, giving them a higher ranking in our system.
Their RSI is overbought currently at 72 after Wednesday’s gap up, but investor sentiment is signaling weakness in the past week as their volumes feel to below average compared to the year prior & their last three candlesticks all remained relatively closely aligned with one another’s real bodies.
Their MACD is still bullish & their 10 day moving average crossed through their 200 day moving average on Thursday of this past week.
With a 3.63% cushion against losses from their distribution yield for long-term shareholders, there is more protection against losses than some other names in this article, but a defensive options strategy would be wise to have as their RSI is signaling a near-term cooldown.
BRF has support at the $15.07, $15.05, $15.04 & $14.99/share price levels, as they try to resistance at the $15.94, $15.95, $16.08 & $16.25/share price levels.
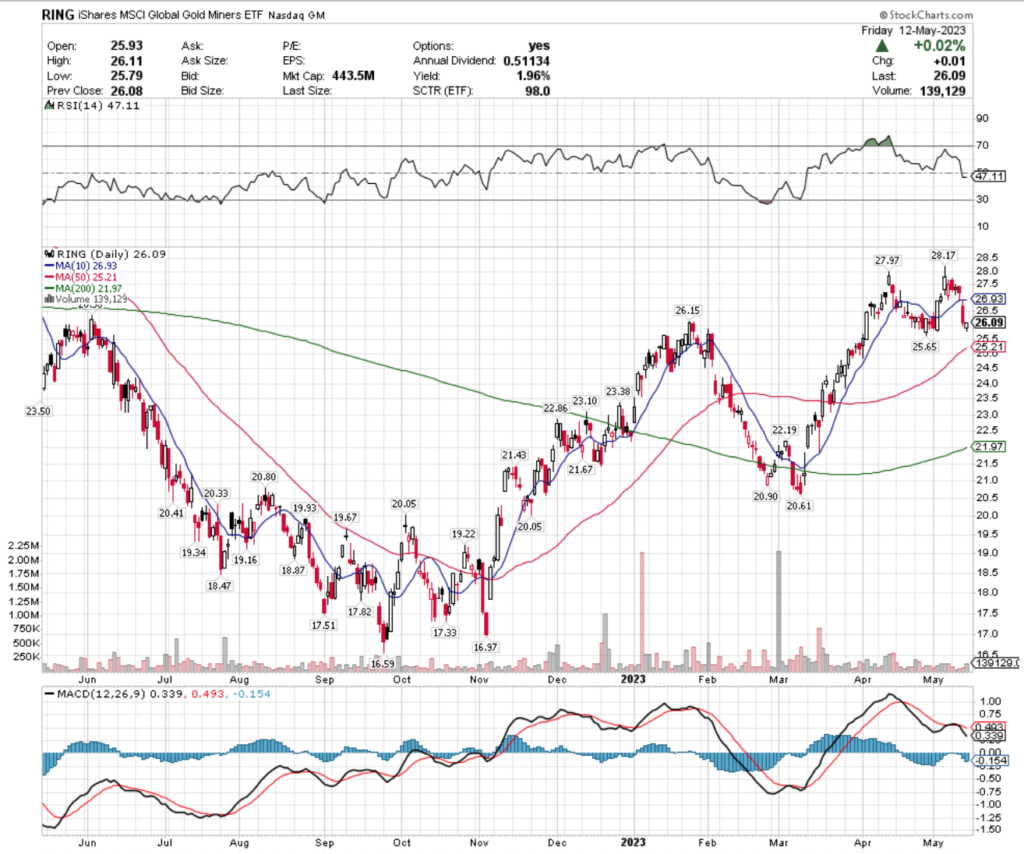
RING ETF – iShares MSCI Global Gold Miners ETF’s Technical Performance Over The Past Year
Their MACD has been in bearish decline over the past week, as their RSI dipped just under neutral to 47.
Recent volumes are showing indecisiveness in where investors value their shares, falling to below average levels for the year prior, with their past week’s candlesticks signaling an impending slide that was capped off with a hammer to close Friday’s session & temporarily slow their losses.
RING offers a 1.96% distribution yield, which provides a slight cushion for long-term holders, but like the other names mentioned above, they are best approached with a defensive options strategy while watching how they behave at their support levels in the near-term.
RING has support at the $25.65, $25.21 (50 day moving average), $23.50 & $23.38/share price level, with resistance at the $26.15, $26.36, $26.93 (10 day moving average) & $27.97/share price levels.
Cannabis (POTX), Oil Services (OIH), U.S. Aerospace & Defense (ITA) & Hong Kong (EWH) Are All Bearishly Lagging The Market
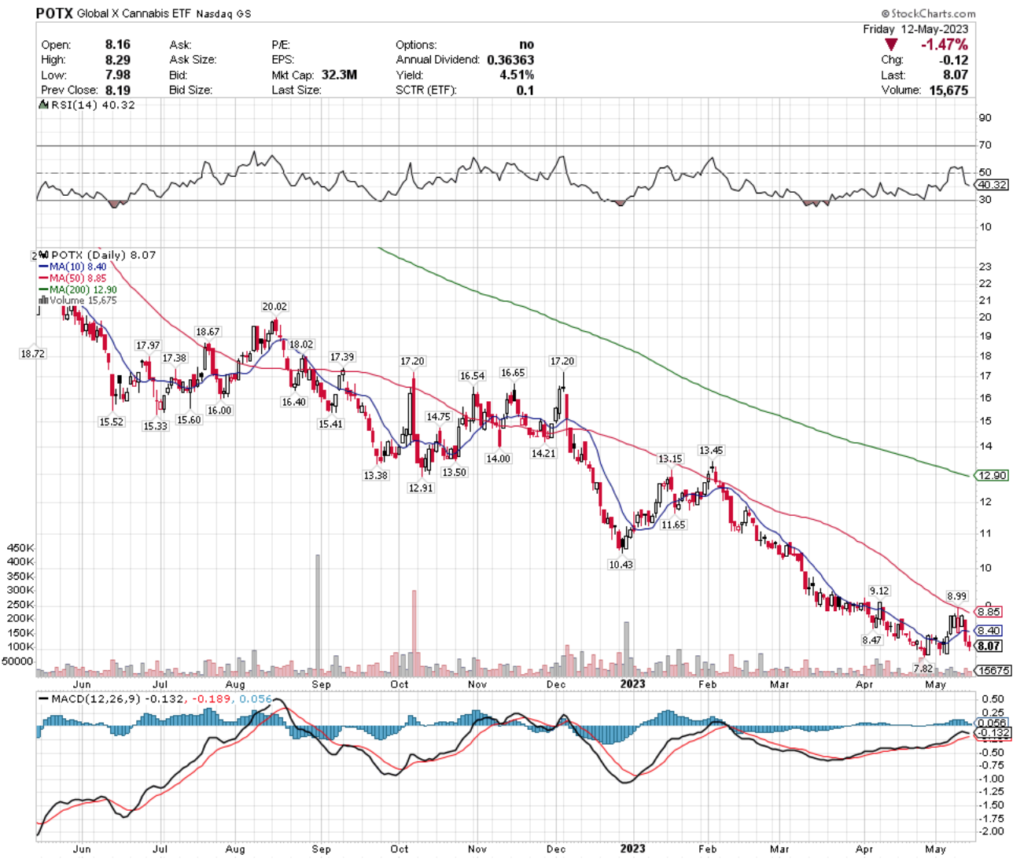
POTX, the Global X Cannabis ETF has fallen -62.09% over the past year, dropping -65.78% since their 52-week high in May of 2022, but recovering +3.2% since their 52-week low in April of 2023 (ex-distributions).
POTX ETF – Global X Cannabis ETF’s Technical Performance Over The Past Year
This year has been very bearish for the cannabis industry as a whole & POTX is looking to rebound off of their recent 52-week low.
Their RSI is on the oversold end of neutral at 40, but their MACD looks primed to cross bearishly in the coming trading sessions.
Volumes recently have been below average compared to the year prior, signaling uncertainty among investors.
POTX offers a 4.51% distribution yield for long-term holders, which can help protect against future losses, but in the near-term a defensive options strategy can generate profits for investors while they wait to see how POTX behaves at support levels.
POTX has support at the $7.82 (all time lowest since their inception in 2020), with resistance at the $8.40 (10 day moving average), $8.47, $8.85 (50 day moving average) & $8.99/share price levels.
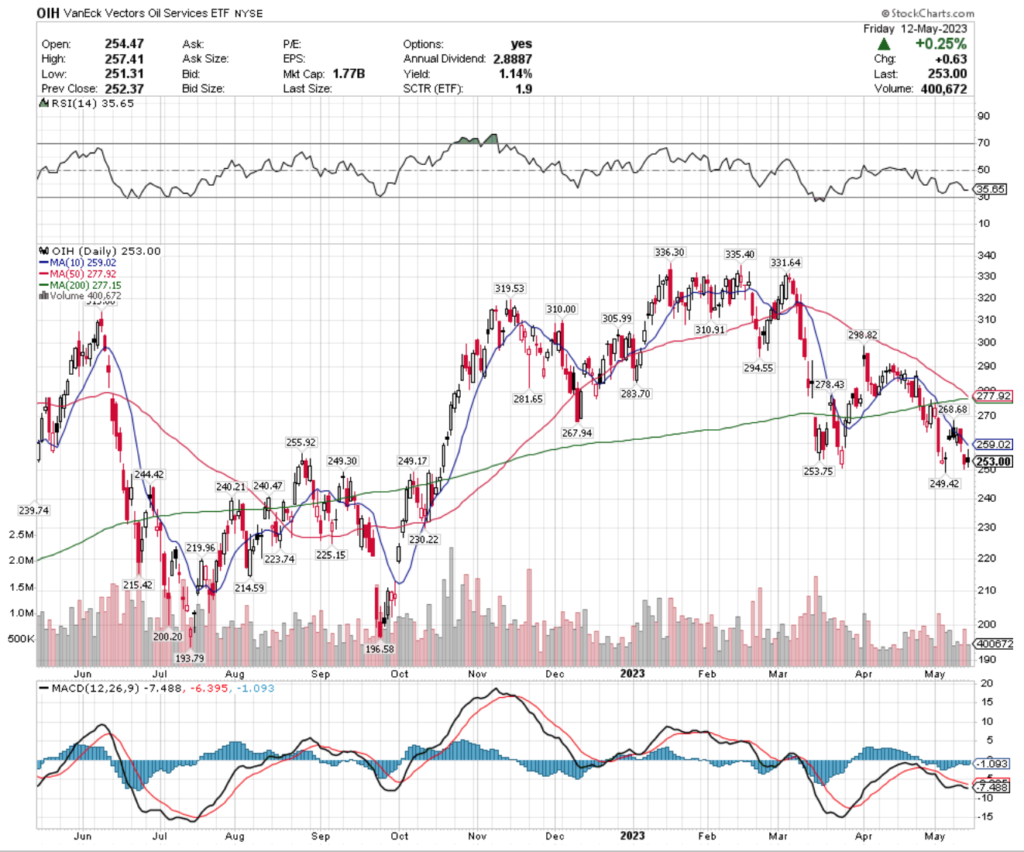
OIH, the VanEck Vectors Oil Services ETF has lost -2.61% over the past year, falling -24.77% since their 52-week high in January 2023, but has regained +29.23% since their 52-week low in July of 2022 (ex-distributions).
OIH ETF – VanEck Vectors Oil Services ETF’s Technical Performance Over The Past Year
Their RSI is closing in on oversold levels, which is supported by their impending death cross (bearish crossover of the 50 & 200 day moving average), which will add to the declines that began with Thursday’s gap down.
Their MACD is still bearish, but attempting to flatten out for a bullish crossover, but recent trading volumes are below average compared to the year prior, signaling weakness in the near-term as investors are not overly eager to buy shares at these price levels.
OIH offers a 1.14% distribution yield for long-term holders, but again, like everything else in this article, the best course of action currently is to wait & see their behavior around support levels, while employing a defensive strategy using options as an insurance policy.
OIH has support at the $249.42, $249.30, $249.17 & $244.42/share price levels, with resistance at the $253.75, $255.92, $259.02 (10 day moving average) & $267.94/share price levels.
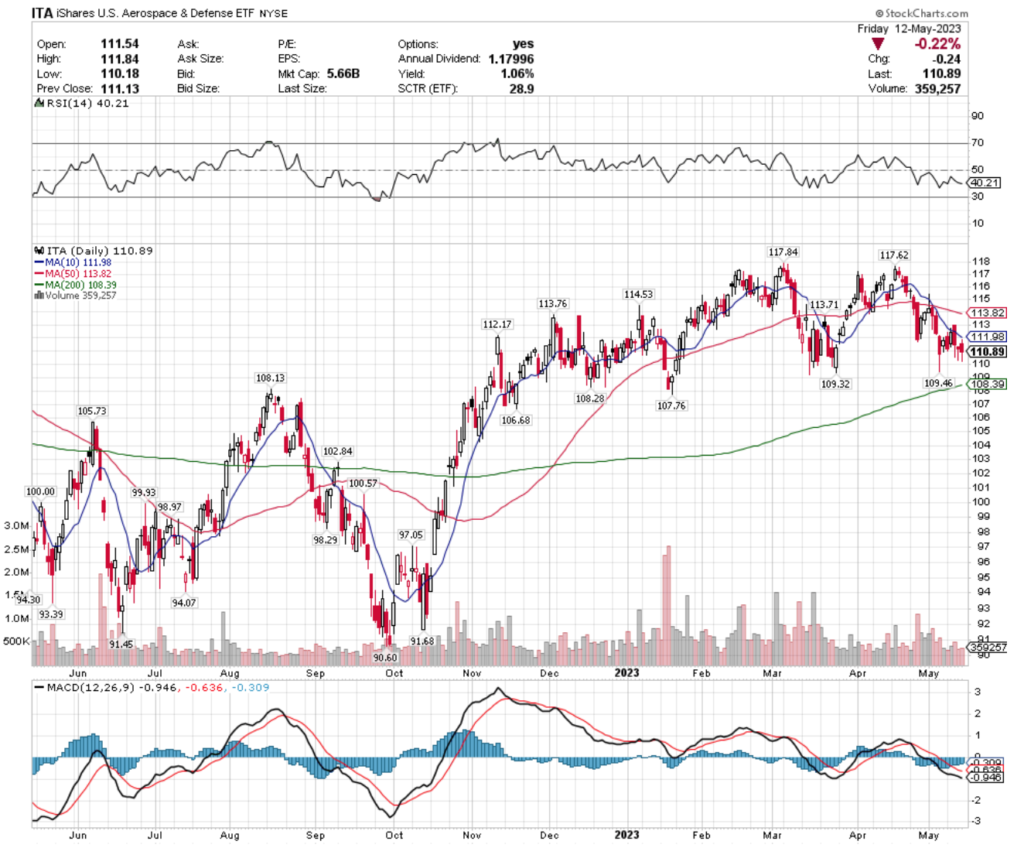
ITA, the iShares U.S. Aerospace & Defense ETF has gained +13.61% over the past year, losing -6.14% from their 52-week high in March of 2023 & improving +21.83% since their 52-week low in September of 2022 (ex-distributions).
ITA ETF – iShares U.S. Aerospace & Defense ETF’s Technical Performance Over The Past Year
Their MACD has been bearish for the past month, as their price has been in steady decline, with their RSI on the oversold end of neutral at 40.
Recent trading volumes are slightly below average compared to the year prior, signaling caution from investors.
ITA’s 1.06% distribution yield is not enough cushion to protect against any further near-term declines, making it wise to have a defensive strategy as insurance against losses, while watching their behavior around the near-term support levels.
ITA has support at the $109.46, $109.32, $108.28 & $108.13/share price levels, with resistance at the $111.98, $112.17, $113.71 & $113.76/share price levels.
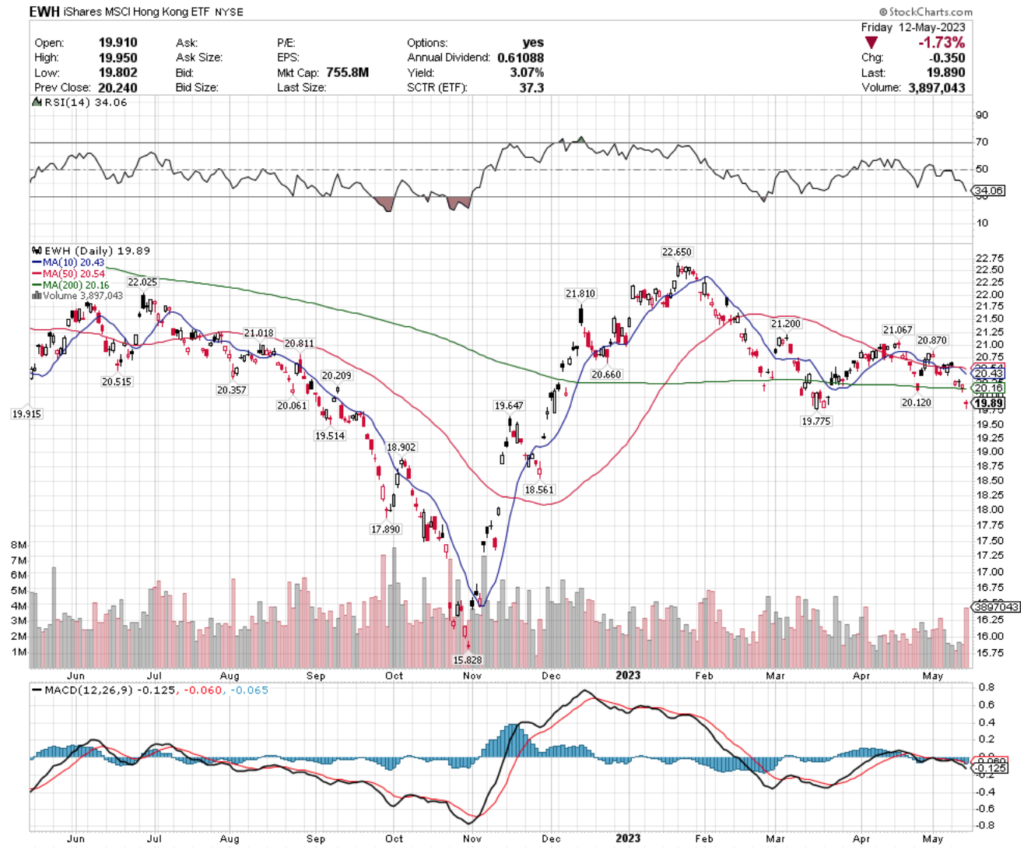
EWH, the iShares MSCI Hong Kong ETF has fallen -3.13% over the past year, dropping -12.19% since their 52-week high in January of 2023, but improving +24% since their 52-week low in October of 2022 (ex-distributions).
EWH ETF – iShares MSCI Hong Kong ETF’s Technical Performance Over The Past Year
Their RSI is very bearish & approaching oversold territory quickly, after 2 gap downs in the past week, which are setting the tone for the week ahead to be bearish at worst & at best finding them establishing a new, lower price range.
Their MACD is also bearish, and recent trading volumes have been relatively close to average compared to the year prior, signaling that there may be more losses incurred in the near-term.
With a 3.07% distribution yield for long-term holders, there is some protection against losses, but this is another instance where an insurance policy using options is the best idea in the near-term while watching their behavior at their support levels.
EWH has support at the $19.78, $19.65, $19.51 & $18.90/share price levels, with resistance at the $19.92, $20.12, $20.16 (200 day moving average) & $20.21/share price levels.
Tying It All Together
Next week’s data announcements kick off Monday morning at 8:30 am with the Empire Manufacturing Survey data & Chicago Fed President Goolsbee speaking on TV, followed by Minneapolis Fed President Kashkari speaking at 9:15 am.
Tuesday is a bit busier, beginning at 8:15 am with Cleveland Fed President Mester Speaking, U.S. Retail Sales & Retail Sales Minus Autos reported at 8:30 am, Industrial Production & Capacity Utilization at 9:15 am, and at 10 am Business Inventories, Home Builder Confidence Index data & Fed Chair Barr testifying.
Also on Tuesday at 10:30 am Richmond Fed President Barkin speaks, followed by New York Fed President Williams at 12:15 pm, Chicago Fed President Goolsbee on TV at 2:30 pm & Atlanta Fed President Bostic & Chicago Fed President Goolsbee speaking on a panel at 7pm.
Tuesday’s earnings calls include Home Depot, Baidu, Sea Limited, Tencent Music, Tupperware & others.
Wednesday has a slower pace on the data front, with Housing Starts & Building Permits data reported at 8:30 am.
Cisco Systems reports earnings on Wednesday, along with Bootbarn Holdings, Copart, Jack In the Box, Synopsys, Take-Two Interactive, Target, TJX, Trip.com Group, Wix.com & more.
On Thursday at 8:30 am the Philadelphia Fed Factory Survey & Initial Jobless Claims data are reported, followed by Fed Governor Philip Jefferson speaking at 9:15 am, Fed Vice Chair for Supervision Barr Testifying at 9:30 am, and at 10 am Existing Home Sales & U.S. Leading Economic Indicators data will be reported.
Walmart is set to report earnings on Thursday, as well as Alibaba Group Holding, Applied Materials, Bath & Body Works, Bilibili, Canada Goose, Deckers Outdoor, Dole, Ross Stores, The Children’s Place & many more.
Friday winds the week down with New York Fed President Williams speaking at 8:45 am & at 11 am Fed Chairman Powell & former Fed Chairman Bernanke will be speaking on a panel.
Friday’s bigger earnings reports include Deere & Footlocker.
See you back here next week!
*** I DO NOT OWN SHARES OR OPTIONS CONTRACT POSITIONS IN SPY, QQQ, IWM, MEXX, ITB, BRF, RING, POTX, OIH, ITA, or EWH AT THE TIME OF PUBLISHING THIS ARTICLE ***