Adobe Systems, Inc. stock trades under the ticker ADBE & has had a very interesting past 52 weeks when we look back from where it is currently sitting, near its 52-week high.
After experiencing a major gap down in September of 2022, the stock has gone through a series of swift, aggressive climbs, followed by consolidation ranges that have spanned anywhere from one-to-three months, which has created a wide range of price action, but many of the price levels have limited volume data attached.
Given that they are at a 52-week high, it is time to begin looking to see how strong their support levels are in order to get an idea as to how far they might fall in a correction.
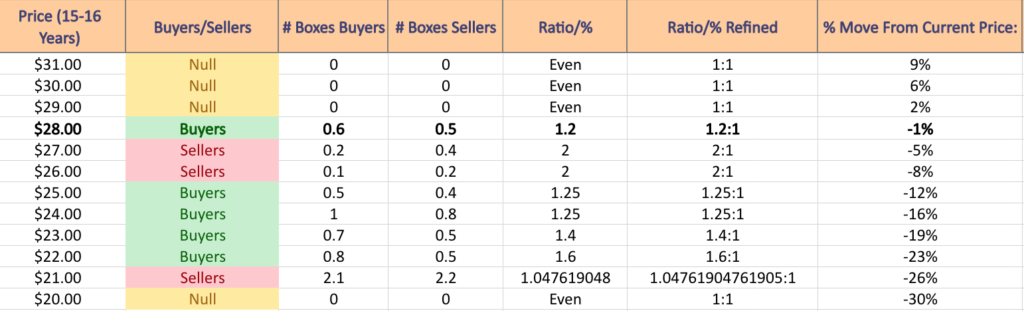
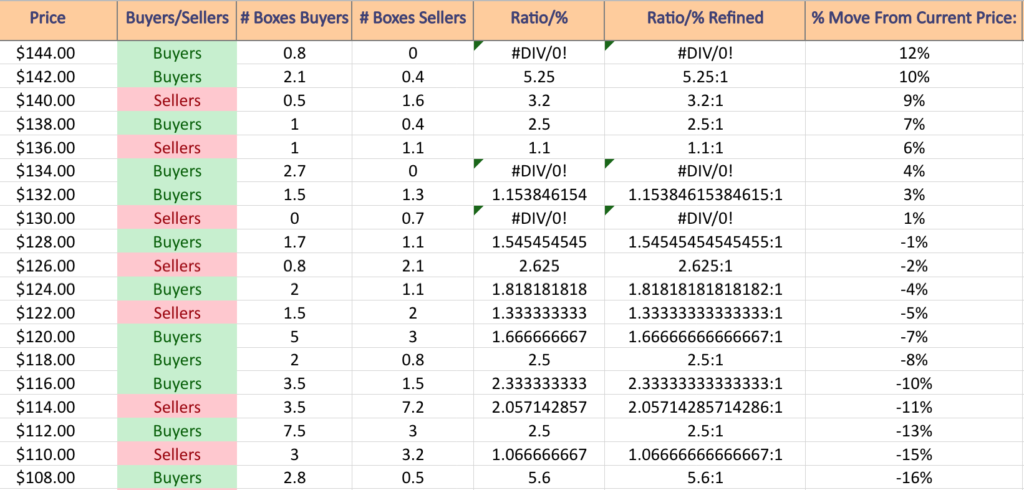
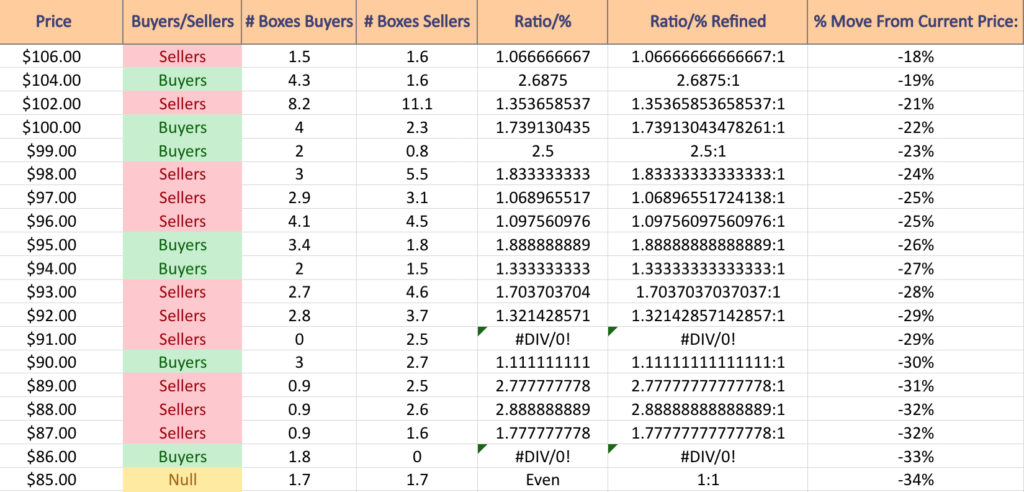
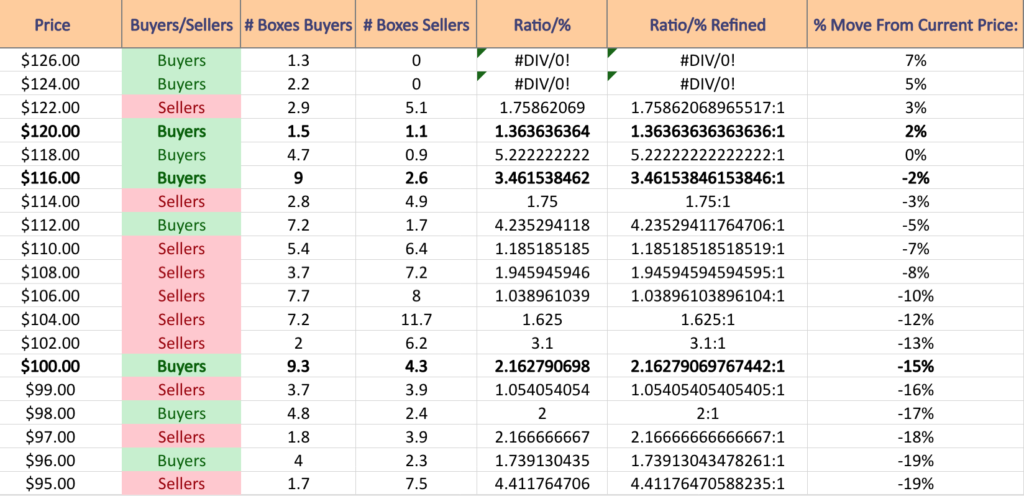
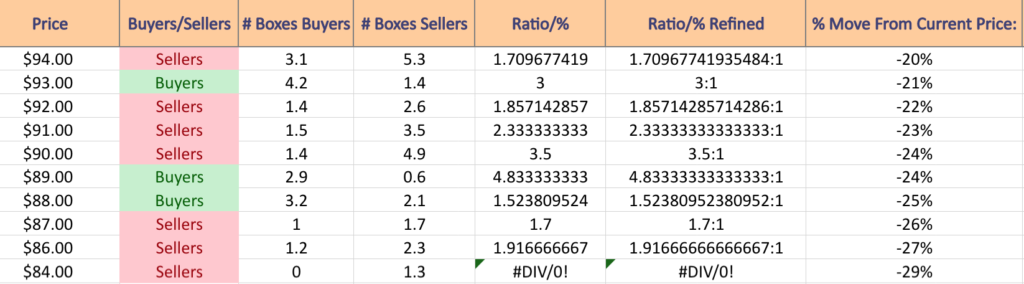
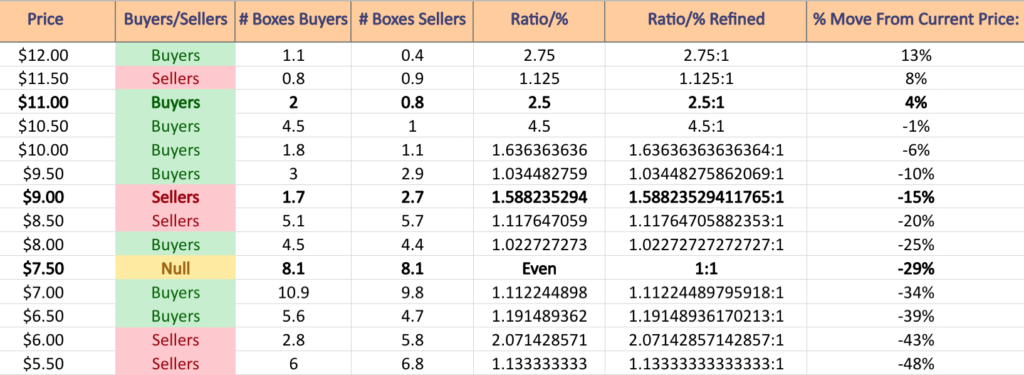
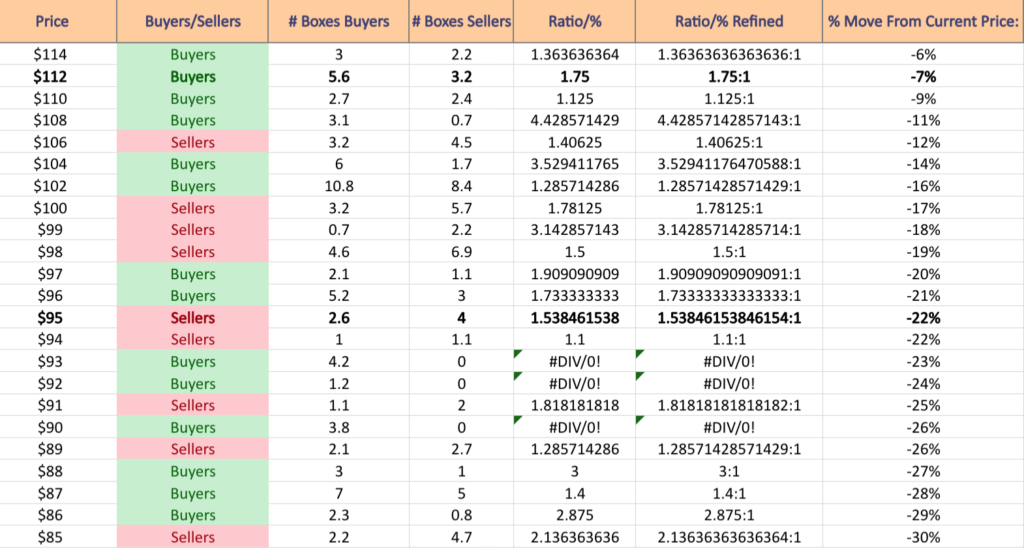
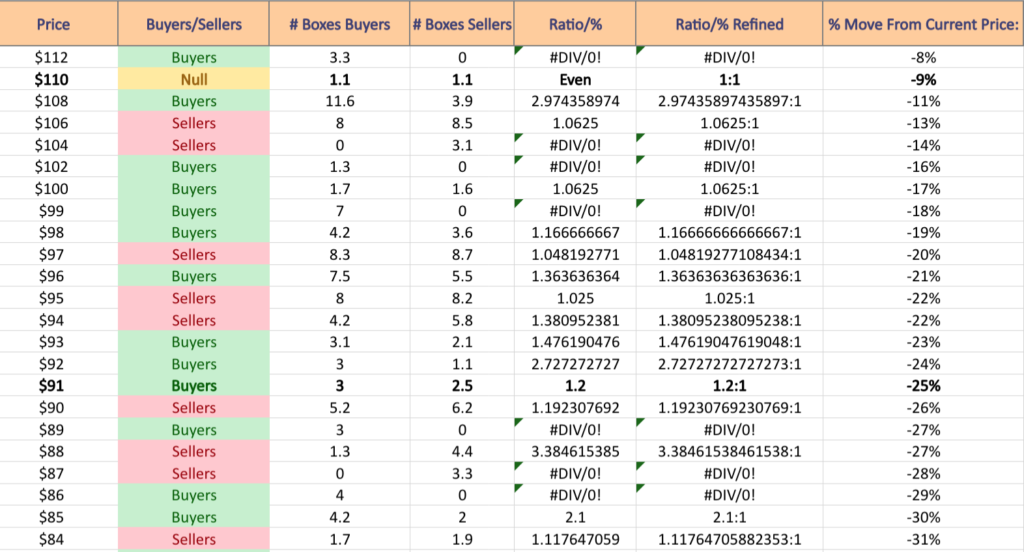
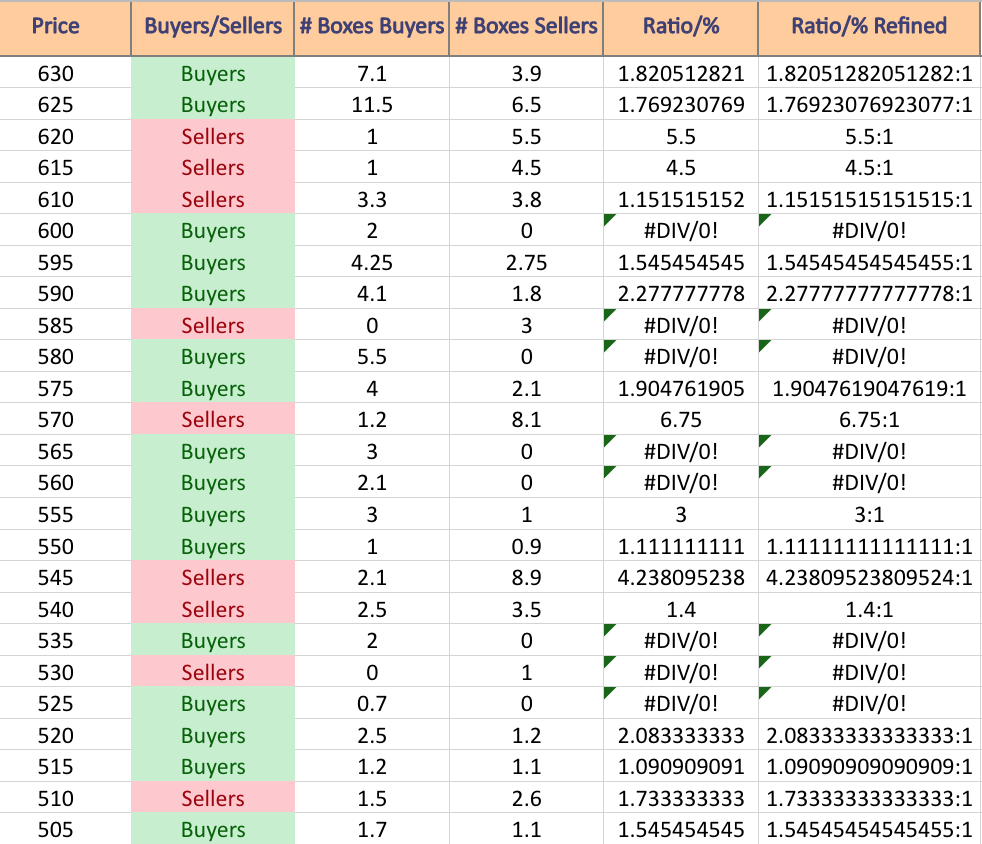
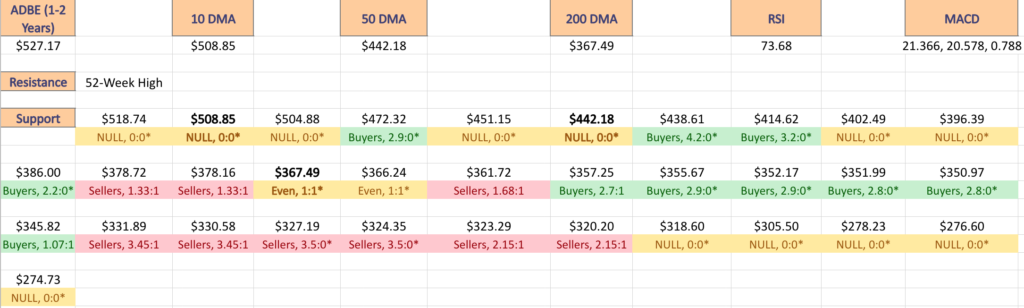
The Price:Volume analysis below seeks to display the volume at specific share-price levels from over the past one-to-two years & is intended to serve as a reference point for how investors viewed ADBE stock’s value at each level.
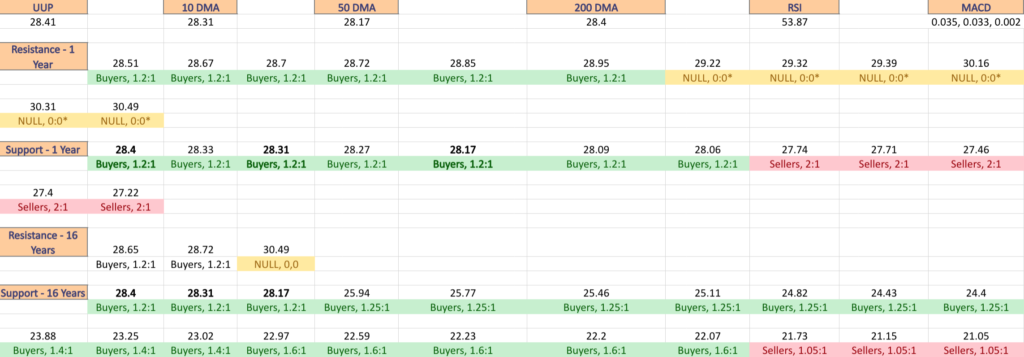
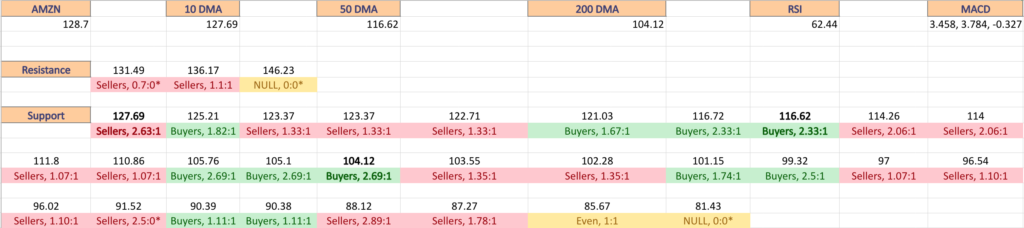
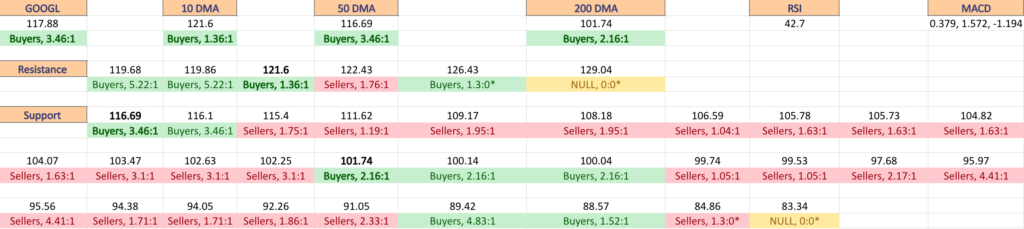
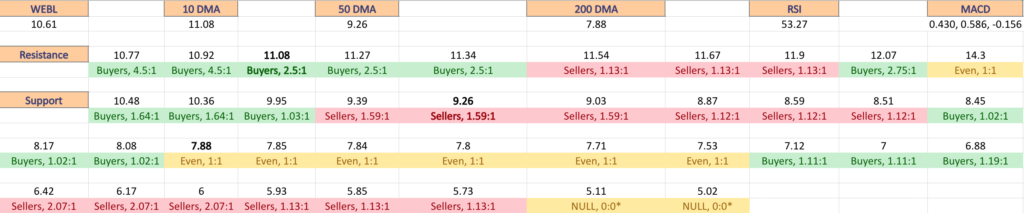
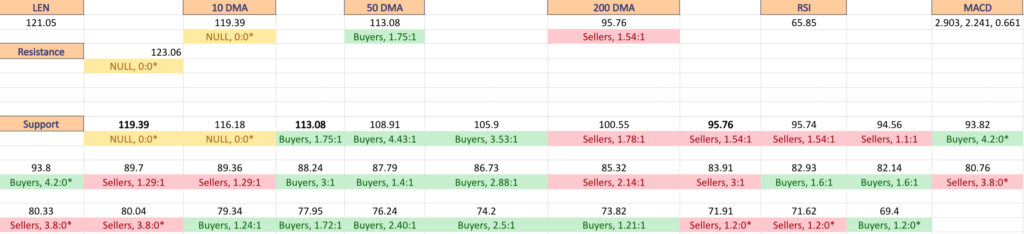
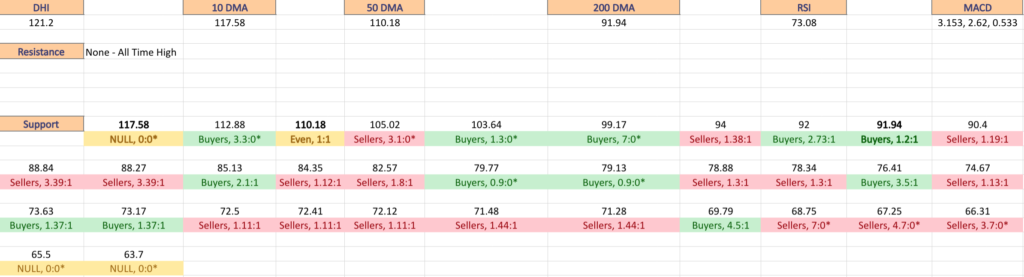
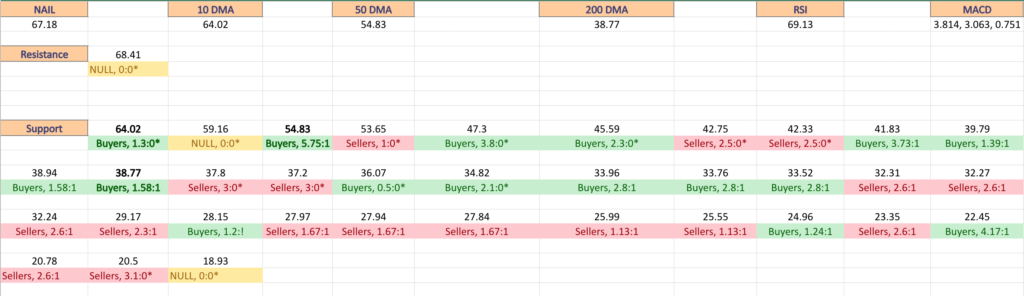
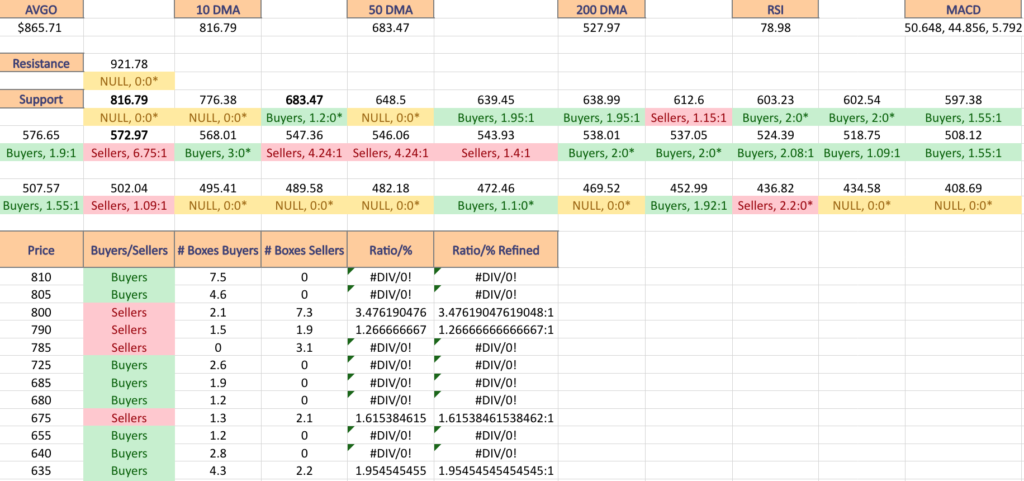
It also includes a list of moving averages, as well as support & resistance levels, which will be marked in bold.
Adobe Systems, Inc. ADBE Stock’s Price:Volume Sentiment Broken Down
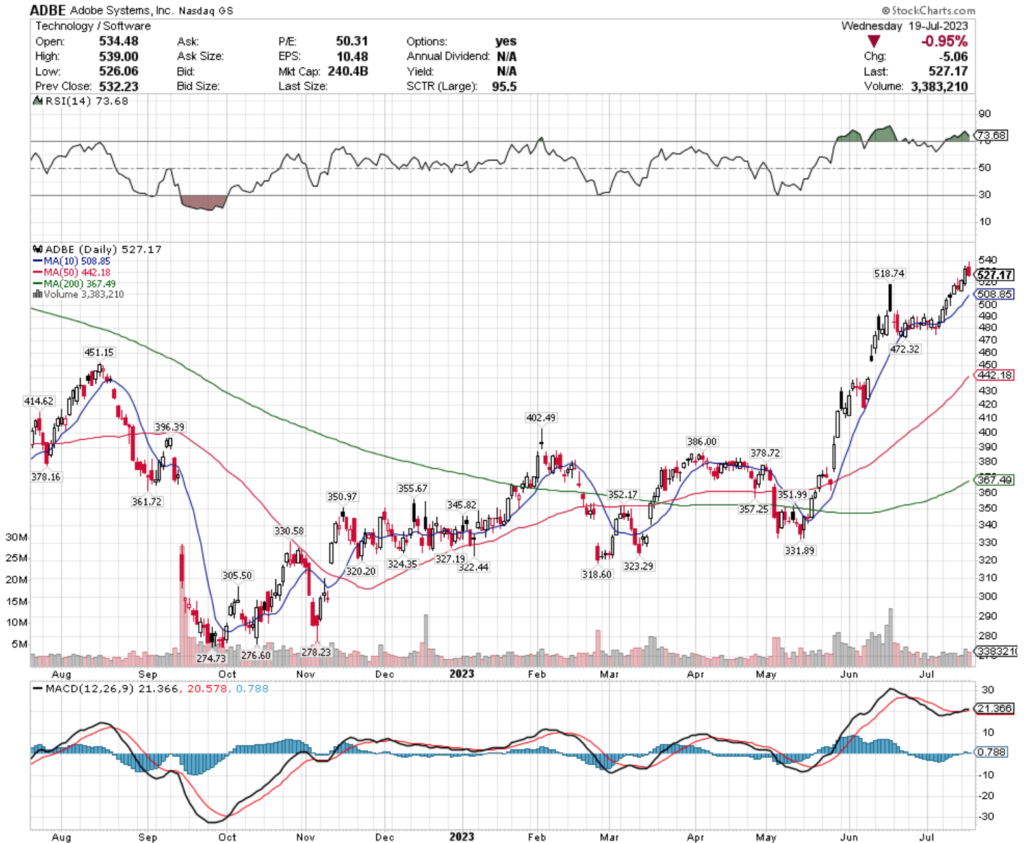
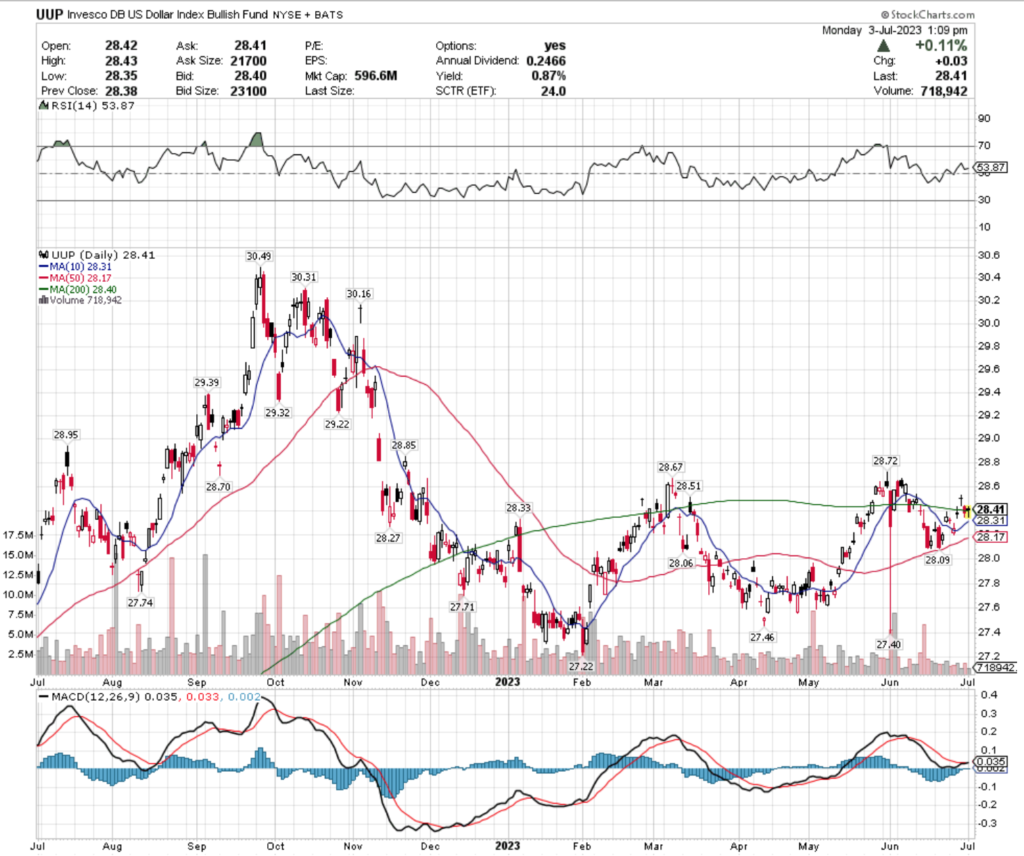
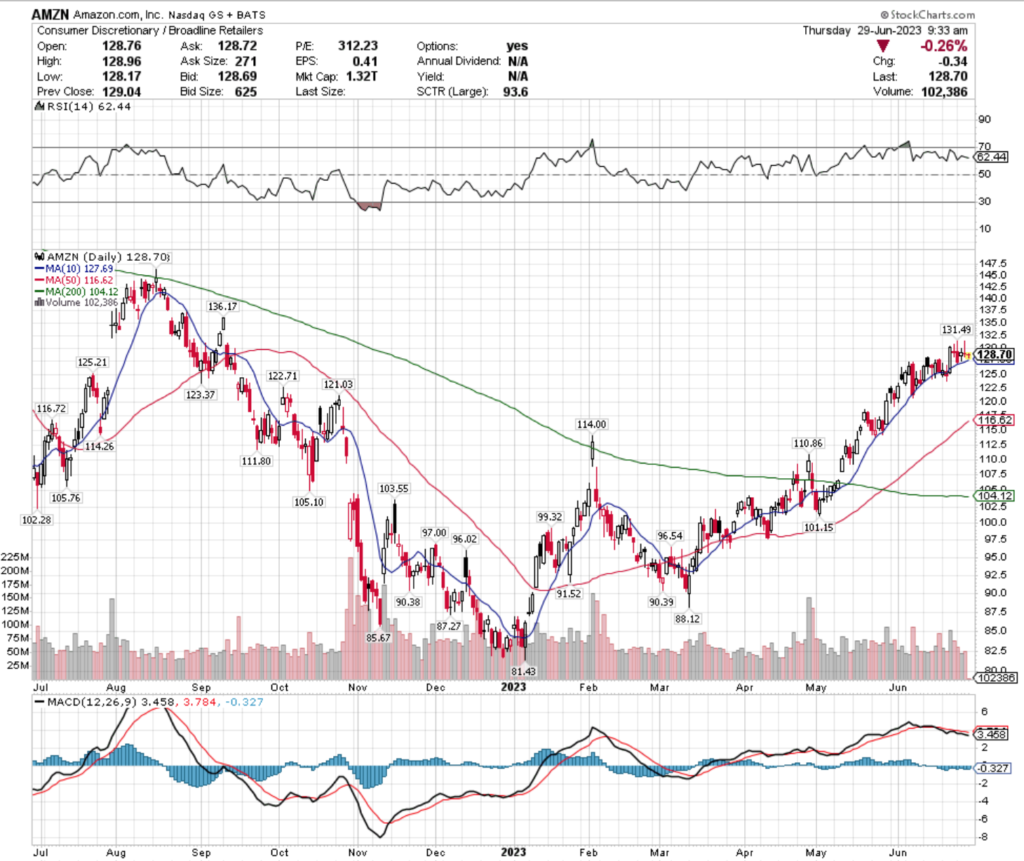
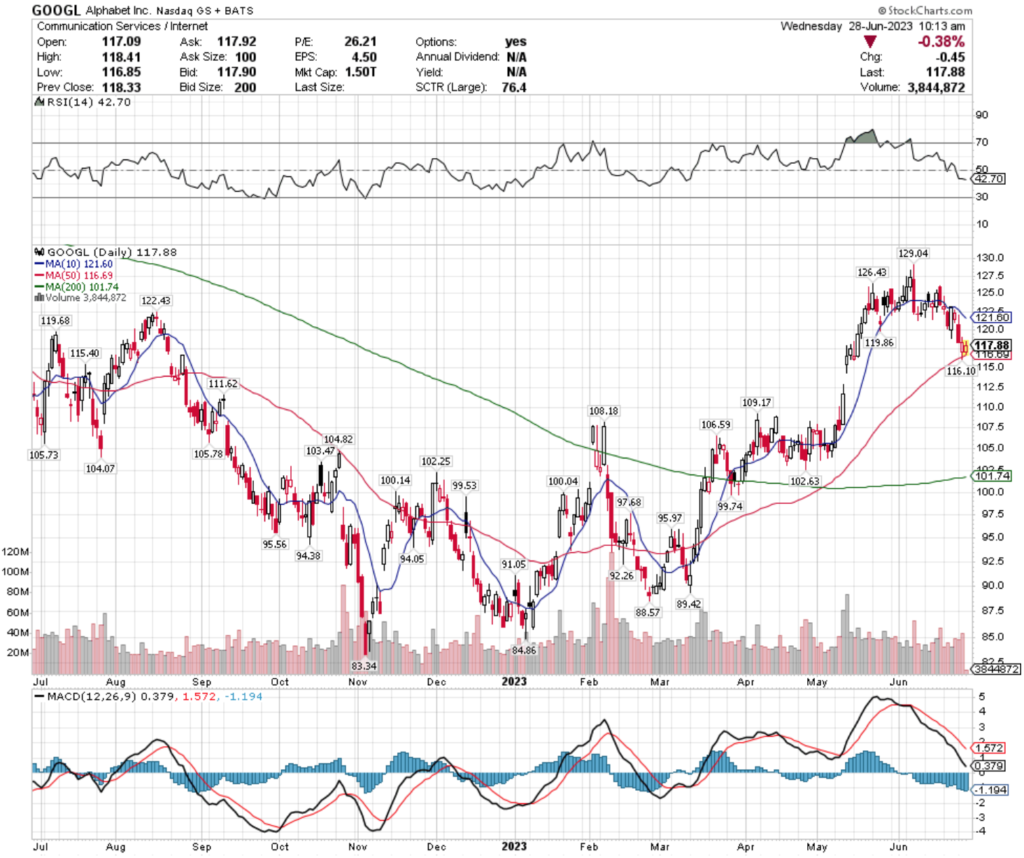
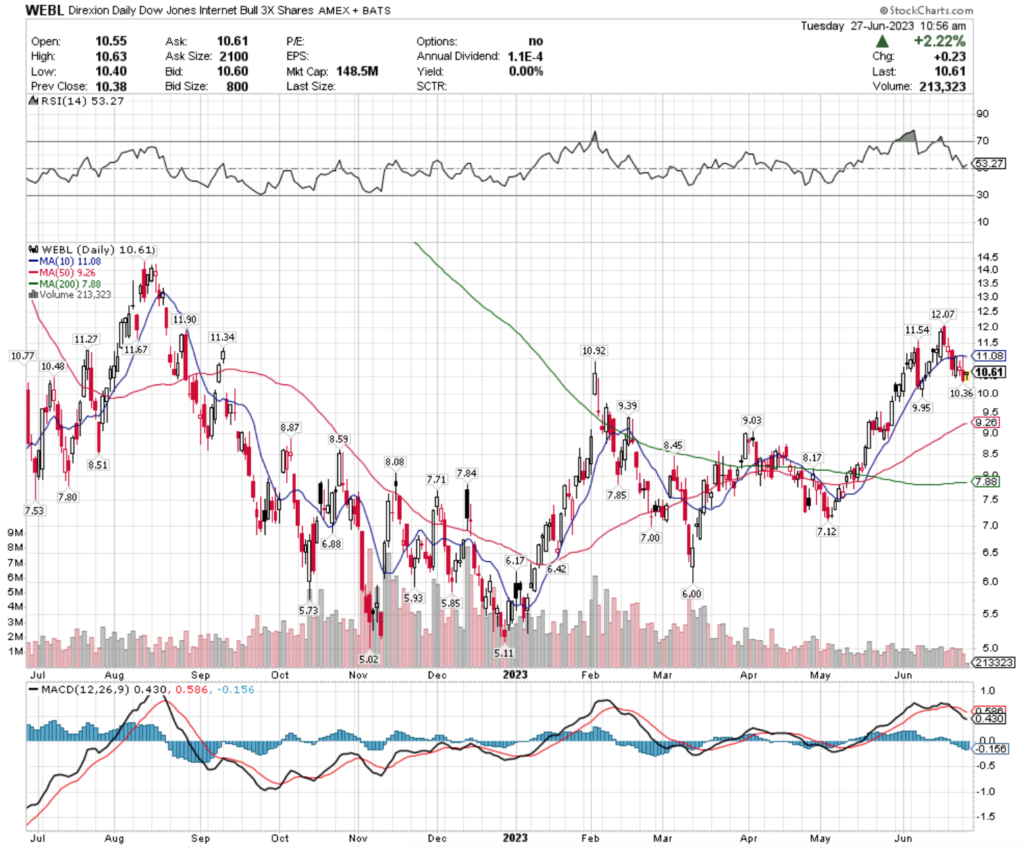
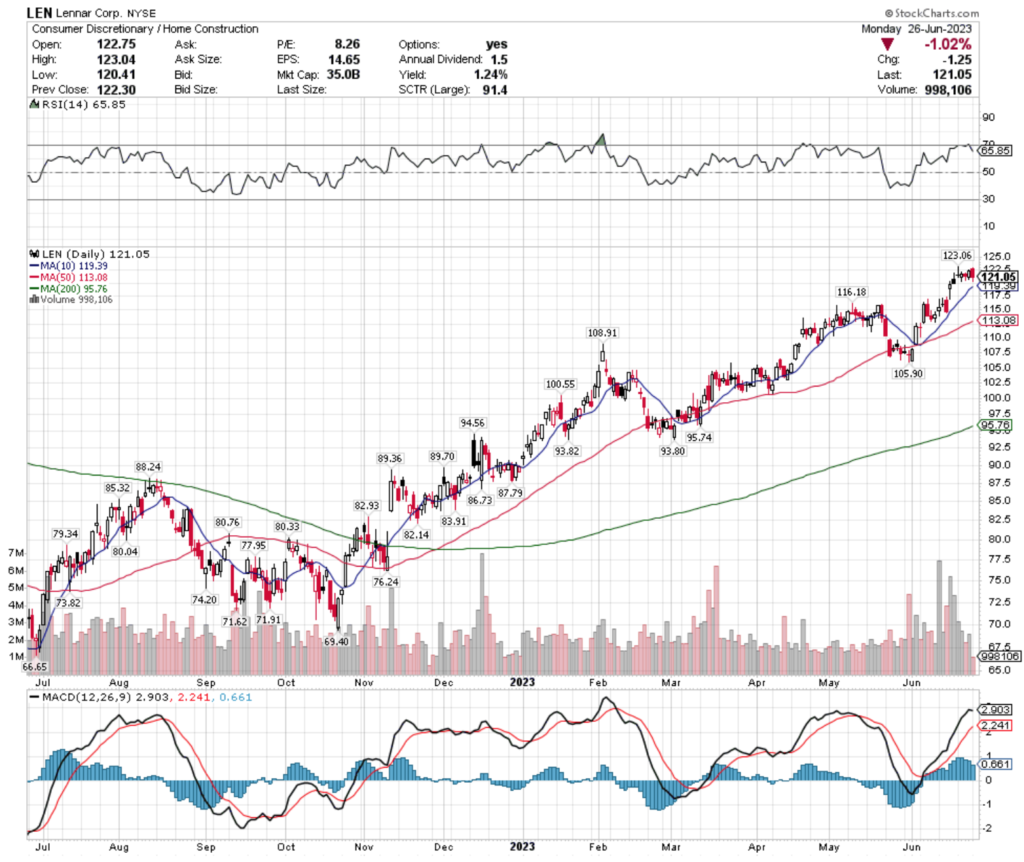
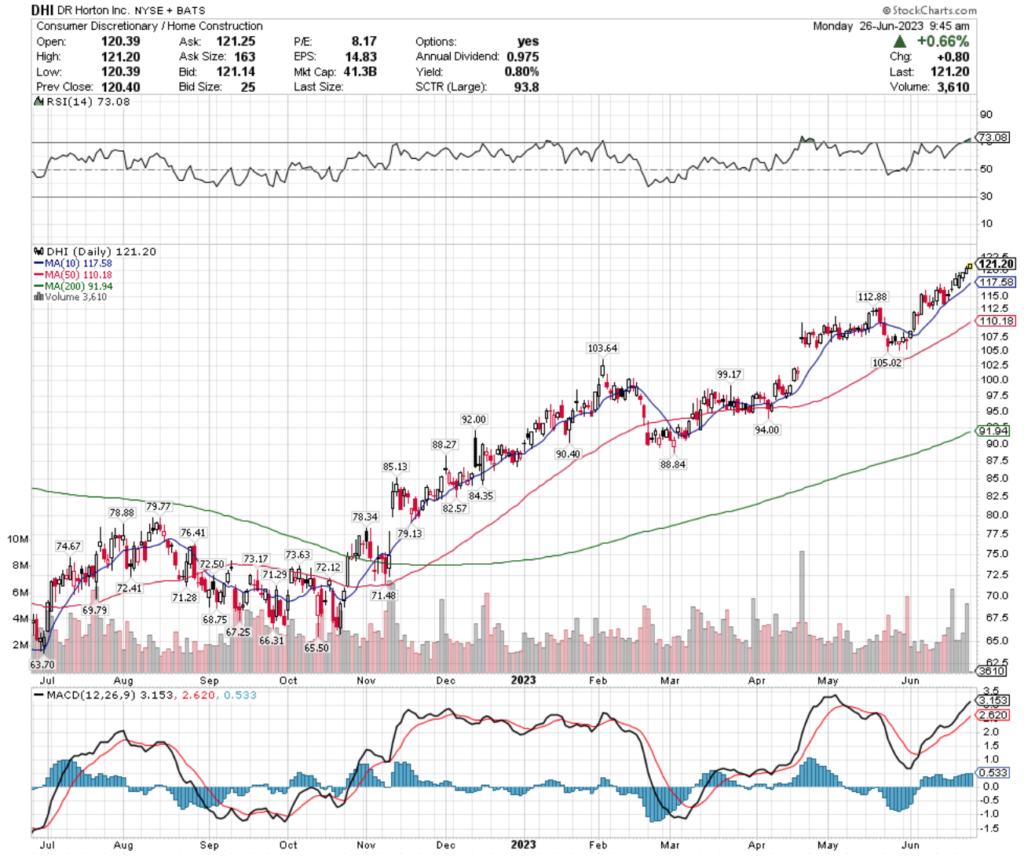
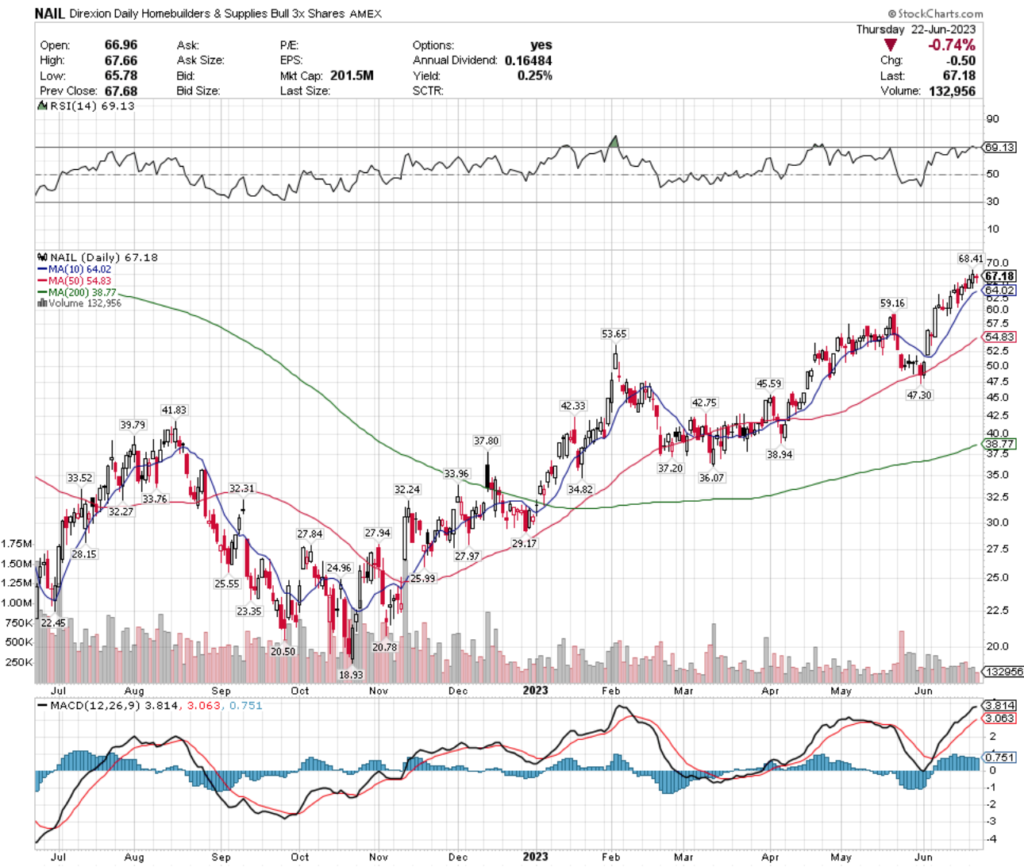
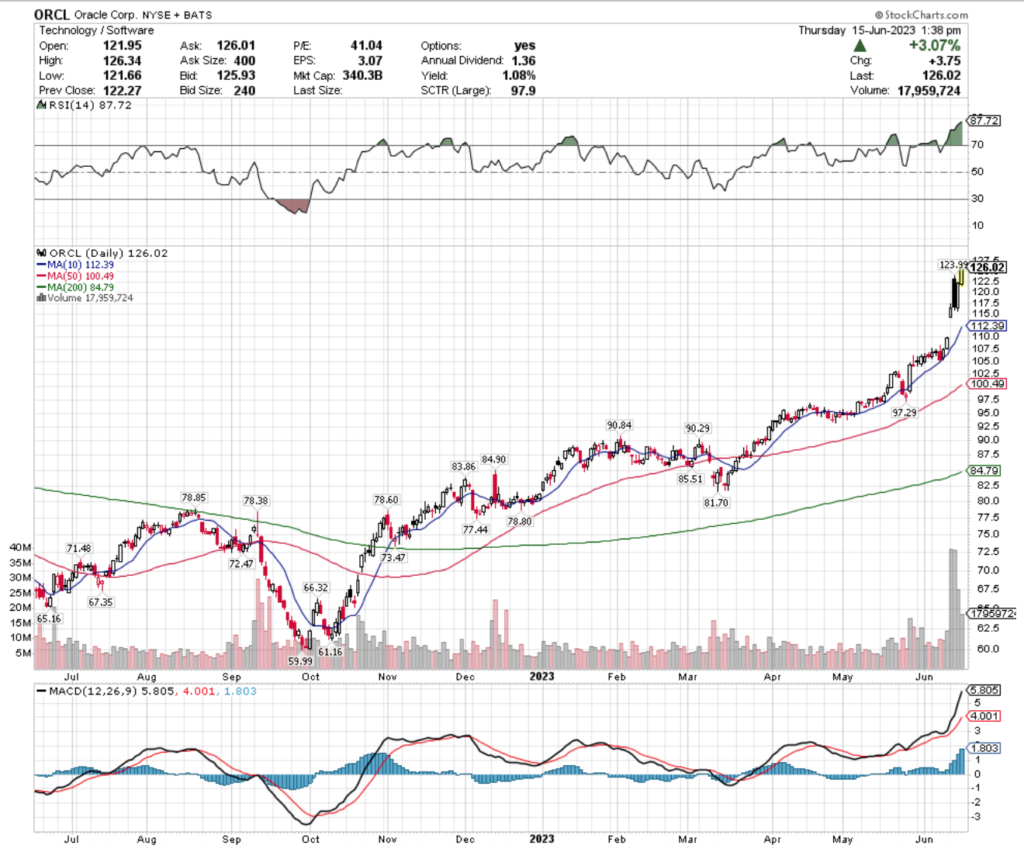
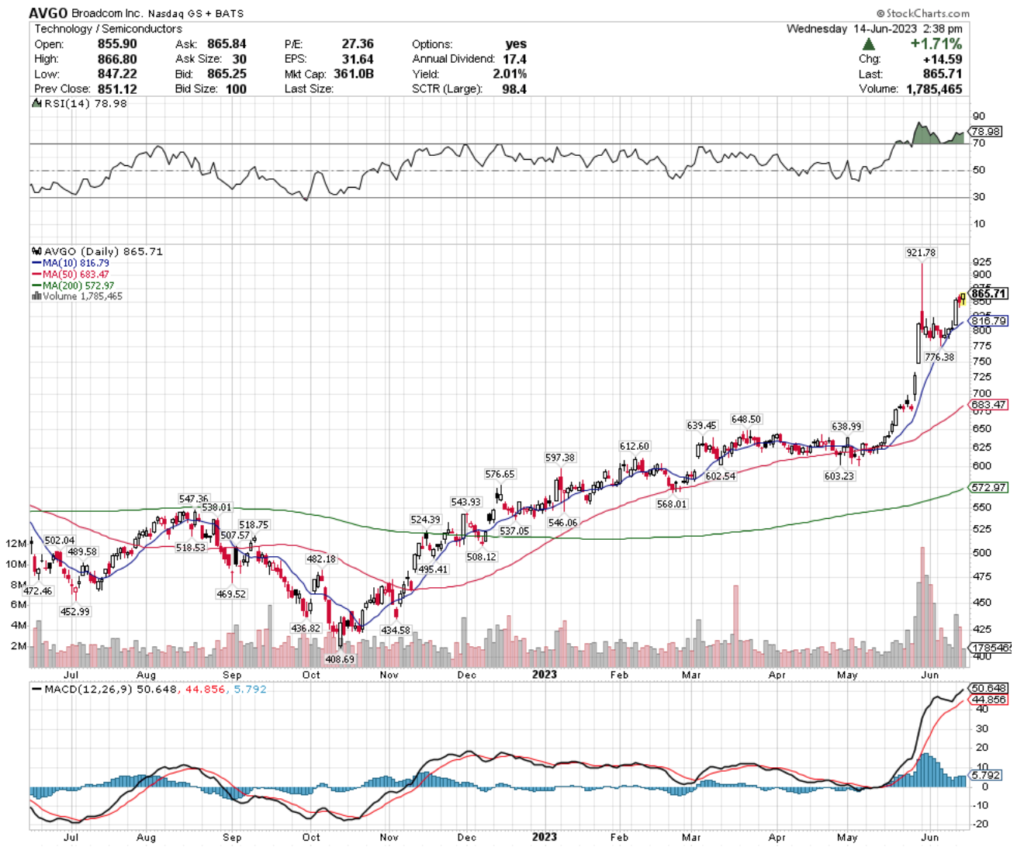
Their RSI is currently overbought at 73.68, with their MACD floundering around & looking prepared to cross over bearishly in the coming days after the close of yesterday’s session resulted in their share price dropping -0.95%.
Trading volumes over the past two weeks have been -11% lower than the average for the past year, signaling that investors are beginning to feel hesitant about the shares.
Last Wednesday trouble began to show up on their chart with a hanging man candlestick & while ADBE kept continuing higher, that Friday & yesterday more warning signals were flashed when their sessions resulted in shooting star candles.
Their next levels of support come at $518.74 (-1.6%), $508.85 (10 Day Moving Average, -3.48%) & $472.32 (-10.4%), before a short distance further down they enter a gap that has no support minus the advancing 50 Day Moving Average.
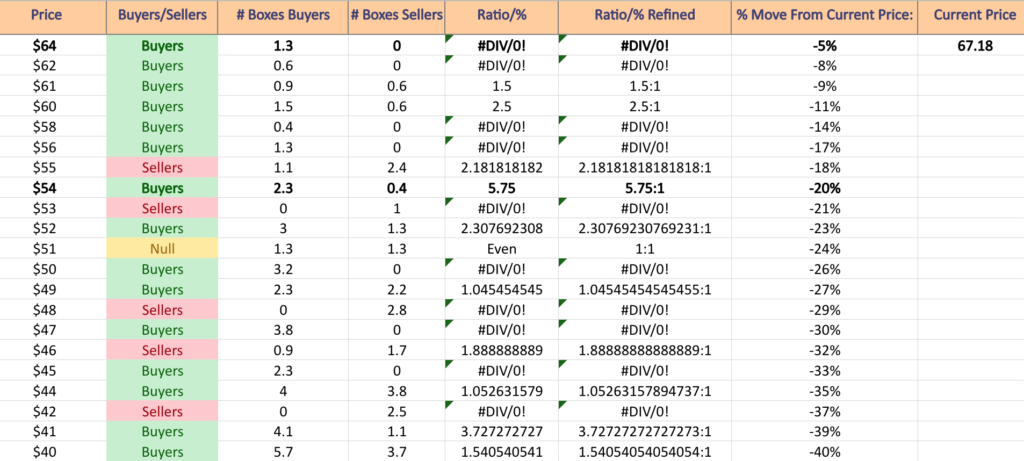
Due to this, it is important to have an idea for how the buyers & sellers of the stock have interacted at various price levels in recent history, especially at key levels of support & resistance.
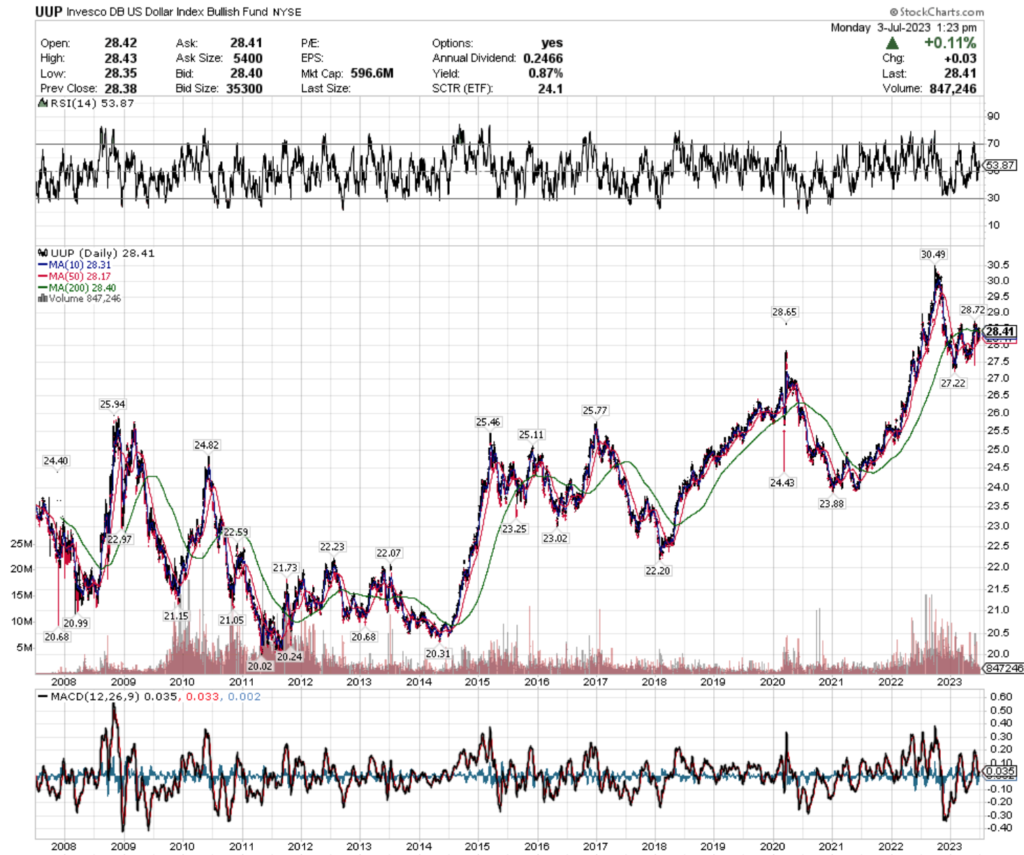
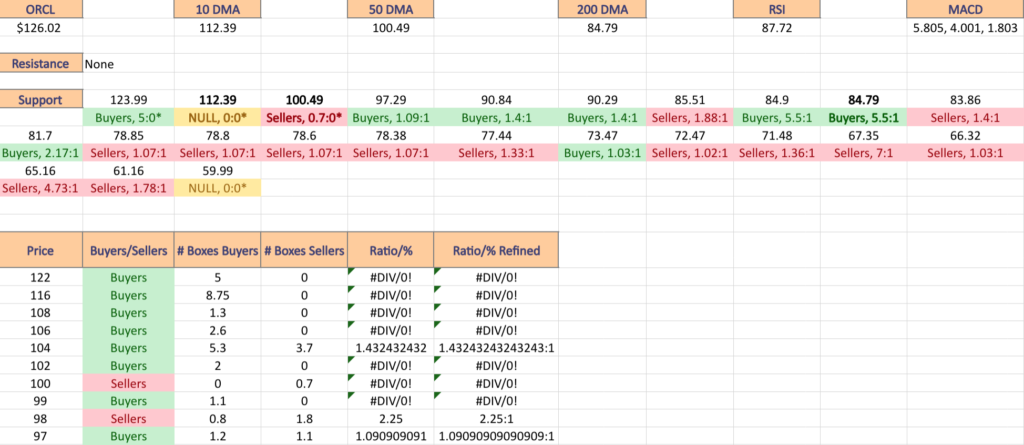
The price:volume sentiment data covers the last 1-2 years, so I have also included the two year chart for ADBE below, so that you can see the support & resistance points over that time period as well.
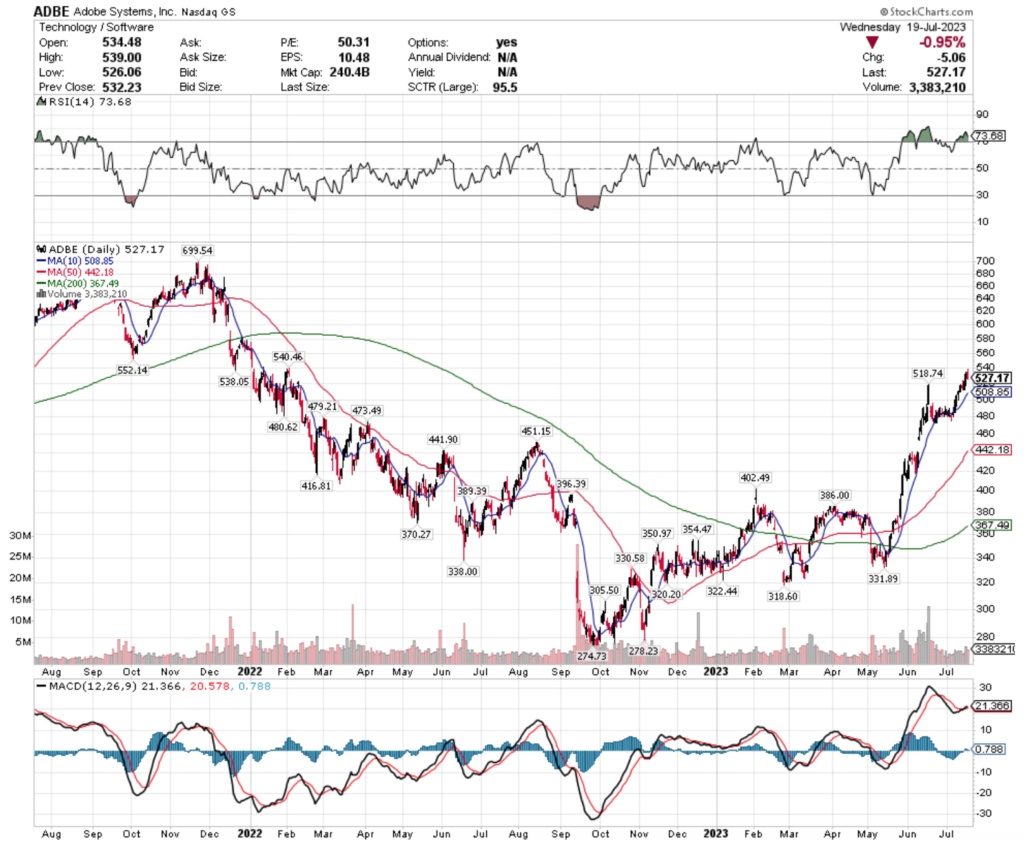
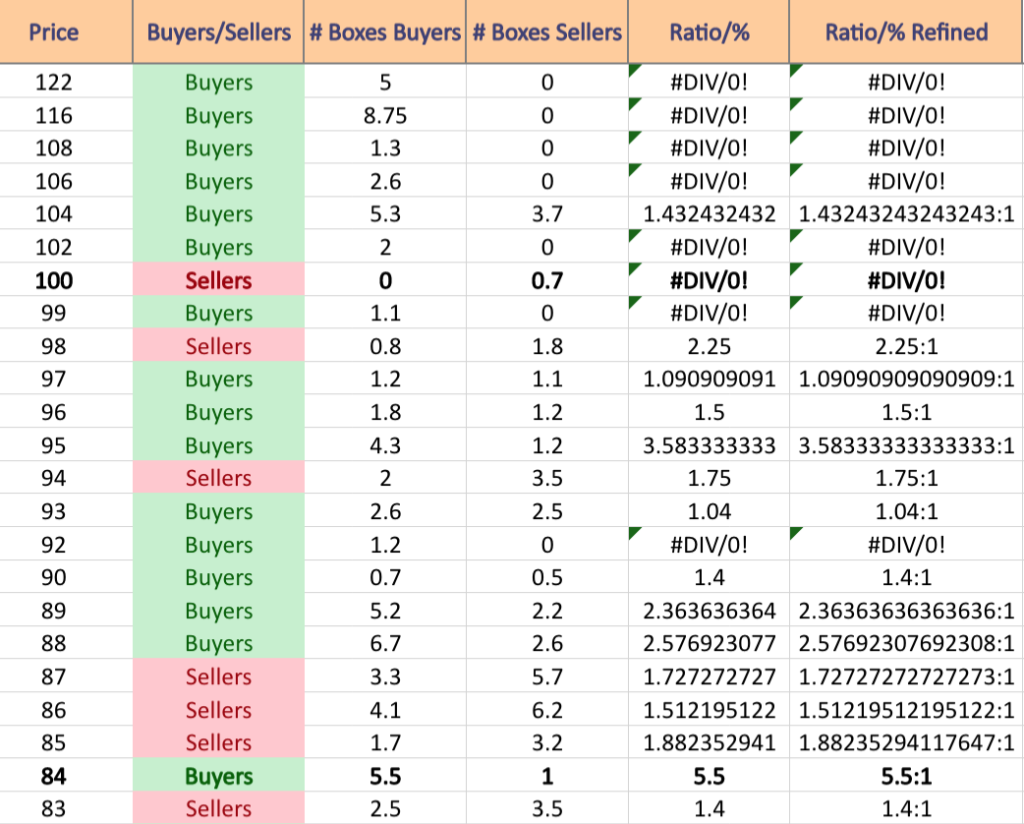
The bold prices on the image below denote the moving average levels just listed & the bold entries in the list form of the analysis under the images include other levels of support.
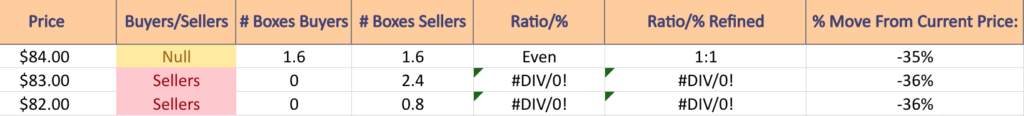
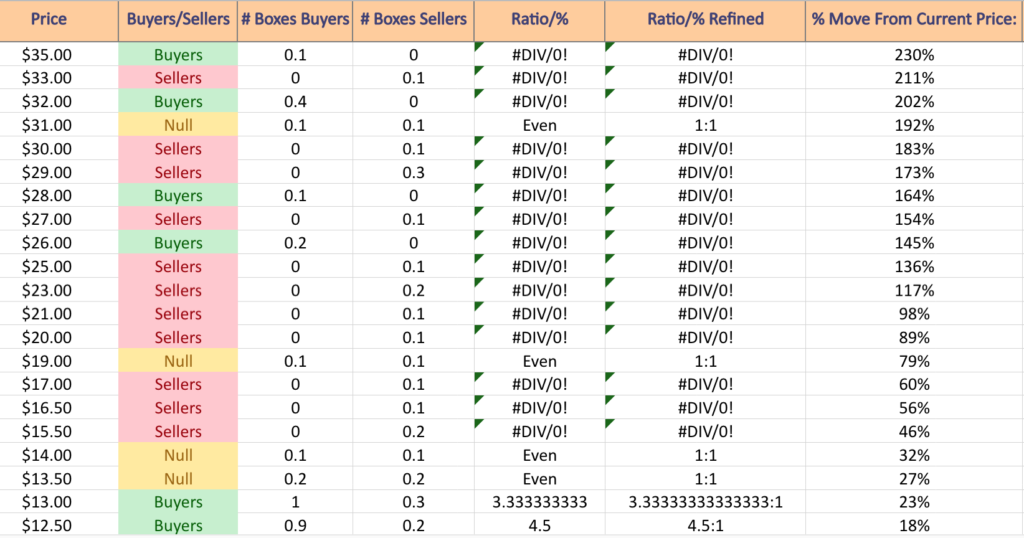
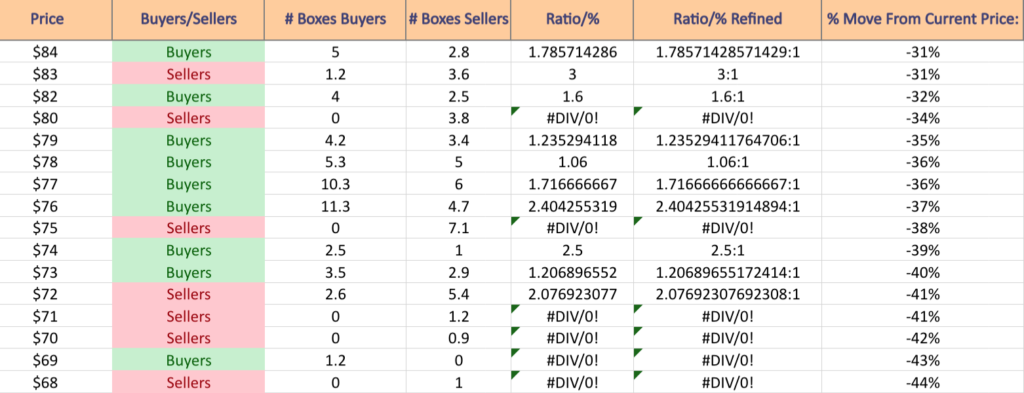
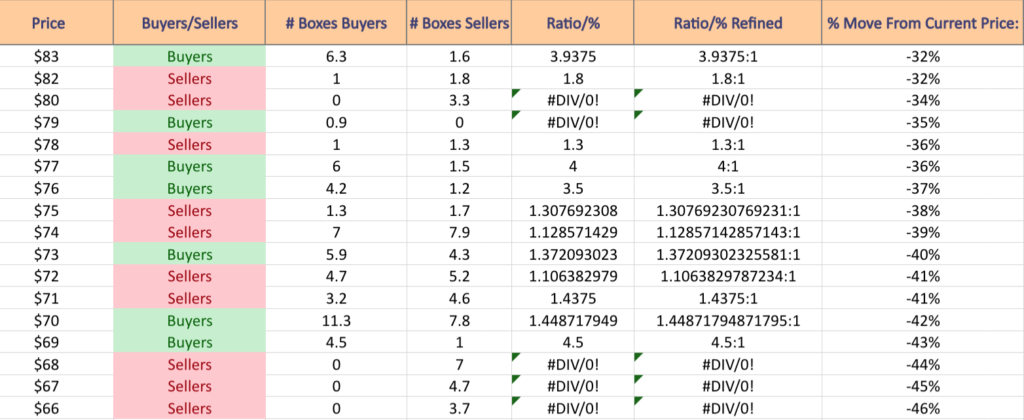
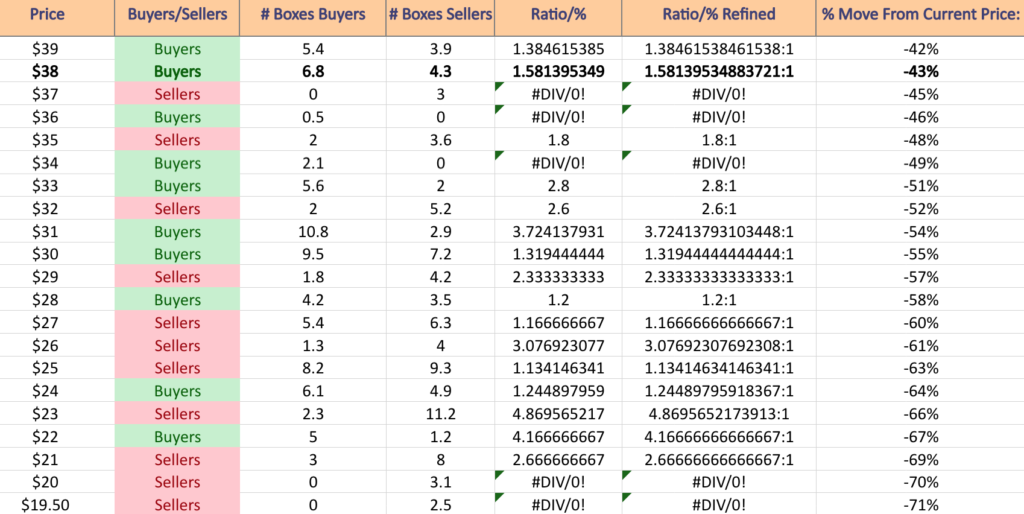
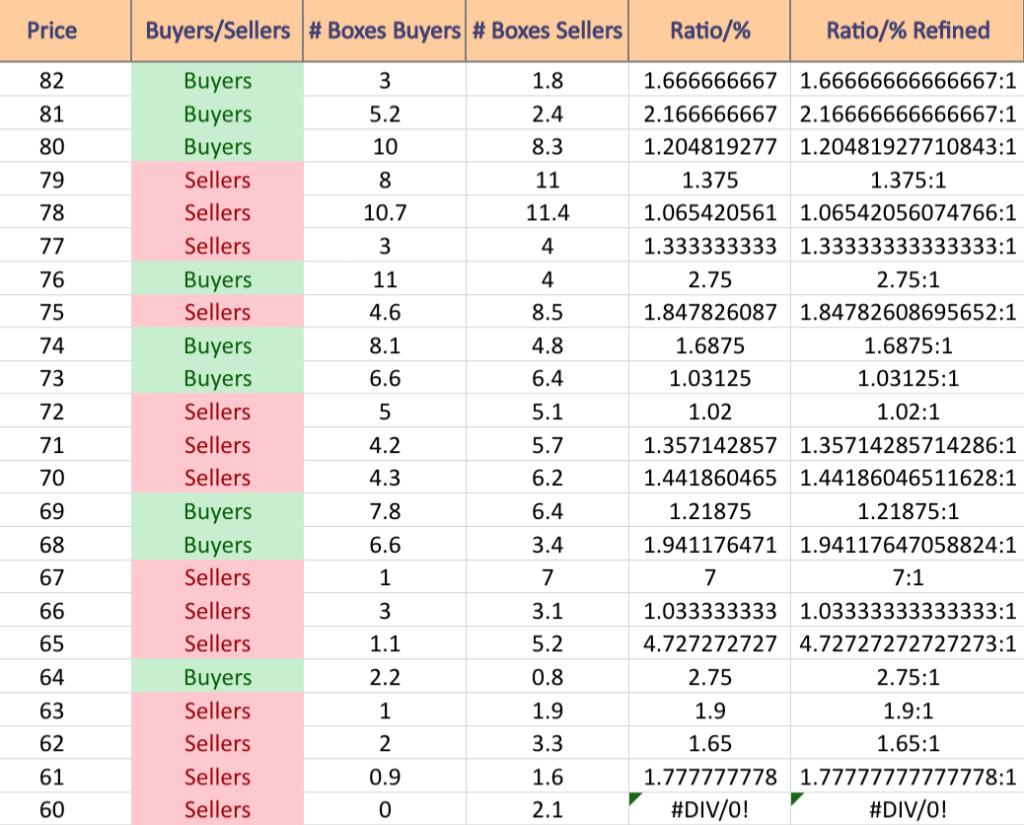
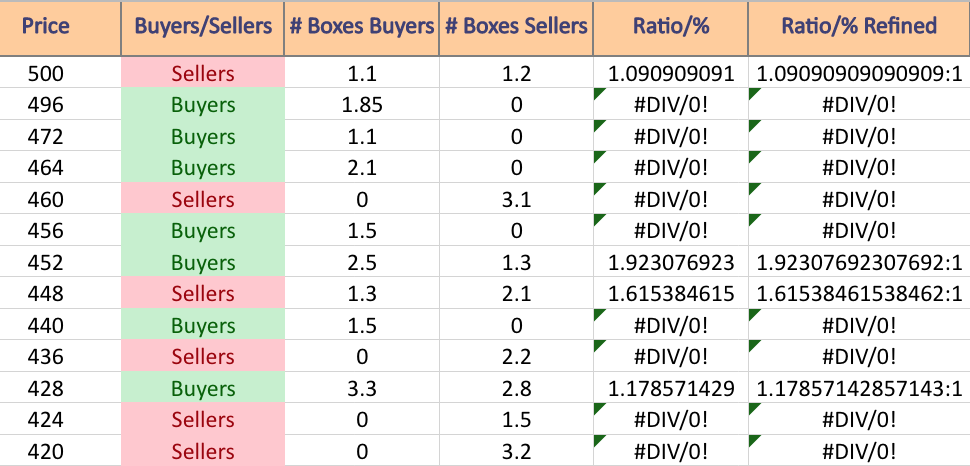
Each corresponding price level using a ratio of Buyers:Sellers (or Sellers:Buyers), NULL values denote that there was not enough data, so the ratio would’ve been 0:0.
Ratios with a 0 for the denominator/constant are denoted with an *, but are reported as is, as we are accounting for volume/sentiment.
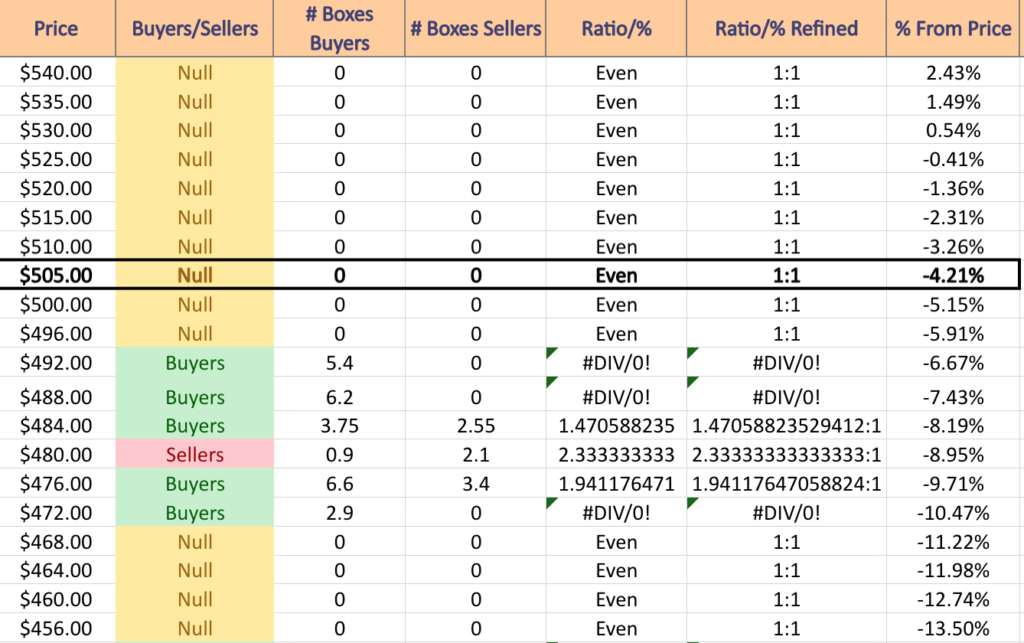
Adobe Systems, Inc. ADBE Stock’s Volume By Price Level
$540 – NULL – 0:0*, +2.43% From Current Price
$535 – NULL – 0:0*, +1.49% From Current Price
$530 – NULL – 0:0*, +0.54% From Current Price
$525 – NULL – 0:0*, -0.41% From Current Price
$520 – NULL – 0:0*, -1.36% From Current Price
$515 – NULL – 0:0*, -2.31% From Current Price
$510 – NULL – 0:0*, -3.26% From Current Price
$505 – NULL – 0:0*, -4.21% From Current Price – 10 Day Moving Average
$500 – NULL – 0:0*, -5.15% From Current Price
$496 – NULL – 0:0*, -5.91% From Current Price
$492 – Buyers – 5.4:0*, -6.67% From Current Price
$488 – Buyers – 6.2:0*, -7.43% From Current Price
$484 – Buyers – 1.47:1, -8.19% From Current Price
$480 – Sellers – 2.33:1, -8.95% From Current Price
$476 – Buyers – 1.94:1, -9.71% From Current Price
$472 – Buyers – 2.9:0*, -10.47% From Current Price
$468 – NULL – 0:0*, -11.22% From Current Price
$464 – NULL – 0:0*, -11.98% From Current Price
$460 – NULL – 0:0*, -12.74% From Current Price
$456 – NULL – 0:0*, -13.5% From Current Price
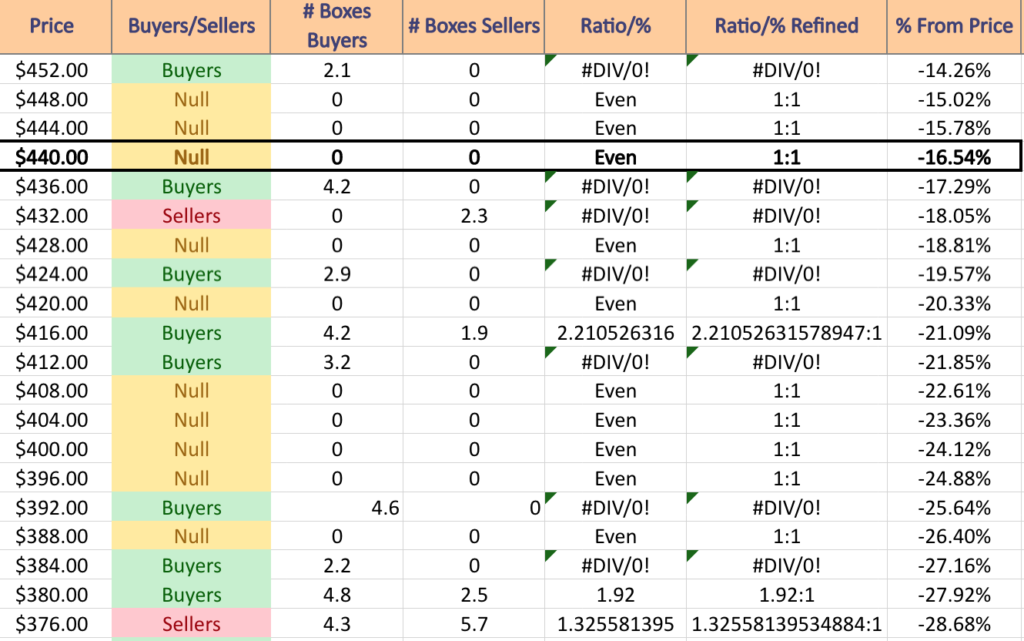
$452 – Buyers – 2.1:0*, -14.26% From Current Price
$448 – NULL – 0:0*, -15.02% From Current Price
$444 – NULL – 0:0*, -15.78% From Current Price
$440 – NULL – 0:0*, -16.54% From Current Price – 50 Day Moving Average
$436 – Buyers – 4.2:0*, -17.29% From Current Price
$432 – Sellers – 2.3:0*, -18.05% From Current Price
$428 – NULL – 0:0*, -18.81% From Current Price
$424 – Buyers – 2.9:0*, -19.57% From Current Price
$420 – NULL – 0:0*, -20.33% From Current Price
$416 – Buyers – 2.21:1, -21.09% From Current Price
$412 – Buyer s- 3.2:0*, -21.85% From Current Price
$408 – NULL – 0:0*, -22.61% From Current Price
$404 – NULL – 0:0*, -23.36% From Current Price
$400 – NULL – 0:0* -24.12% From Current Price
$396 – NULL – 0:0*, -24.88% From Current Price
$392 – Buyers – 4.6:0*, -25.64% From Current Price
$388 – NULL – 0:0*, -26.4% From Current Price
$384 – Buyers – 2.2:0*, -27.16% From Current Price
$380 – Buyers – 1.92:1, -27.92% From Current Price
$376 – Sellers – 1.33:1, -28.68% From Current Price
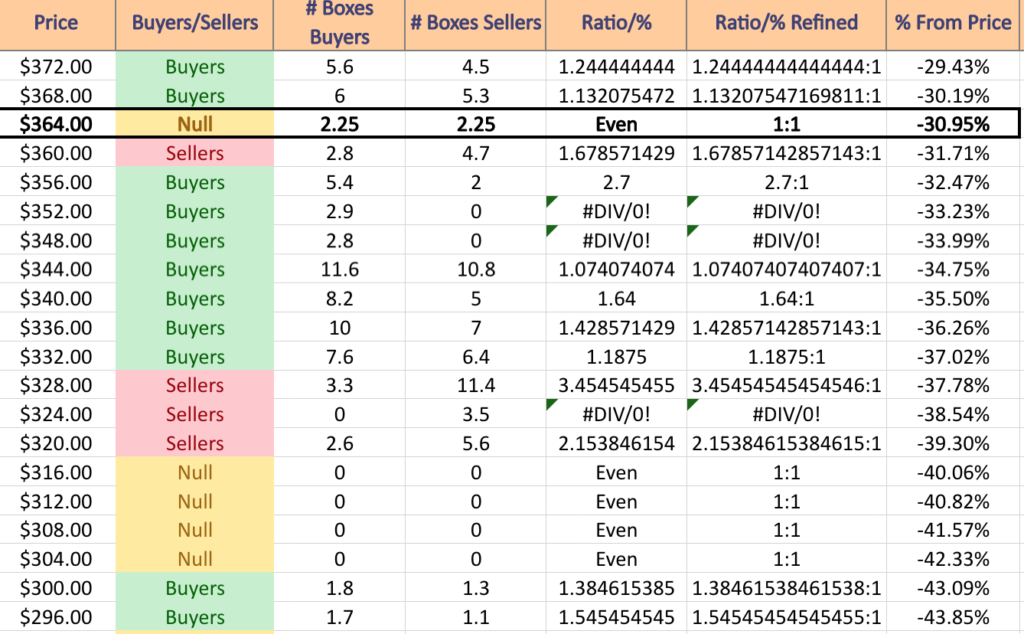
$372 – Buyers – 1.24:1, -29.43% From Current Price
$368 – Buyers – 1.13:1, -30.19% From Current Price
$364 – Even, 1:1, -30.95% From Current Price – 200 Day Moving Average
$360 -Sellers – 1.68:1, -31.71% From Current Price
$356 – Buyers – 2.7:1, -32.47% From Current Price
$352 – Buyers – 2.9:0*, -33.23% From Current Price
$348 – Buyers – 2.8:0*, -33.99% From Current Price
$344 – Buyers – 1.07:1, -34.75% From Current Price
$340 – Buyers – 1.64:1, -35.5% From Current Price
$336 – Buyers – 1.43:1, -36.26% From Current Price
$332 – Buyers – 1.19:1, -37.02% From Current Price
$328 – Sellers – 3.45:1, -37.78% From Current Price
$324 – Sellers – 3.5:0*, -38.54% From Current Price
$320 – Sellers – 2.15:1, -39.3% From Current Price
$316 – NULL – 0:0*, -40.06% From Current Price
$312 – NULL – 0:0*, -40.82% From Current Price
$308 – NULL – 0:0*, -41.57% From Current Price
$304 – NULL – 0:0*, -42.33% From Current Price
$300 – Buyers – 1.38:1, -43.09% From Current Price
$296 – Buyers – 1.55:1, -43.85% From Current Price
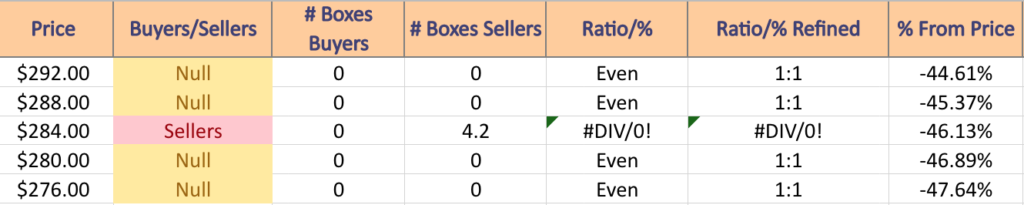
$292 – NULL – 0:0*. -44.61% From Current Price
$288 – NULL – 0:0*, -45.37% From Current Price
$284 – Sellers – 4.2:0*, -46.13% From Current Price
$280 – NULL – 0:0*, -46.89% From Current Price
$276 – NULL – 0:0*, -47.64% From Current Price
Tying It All Together
The list & image above paint the picture as to how investors & traders have behaved at various price levels that ADBE has been at over the past one-to-two years.
It is not meant to serve as investment/trading advice, and is simply a way to visualize what investor/trader sentiment has been like at each of the price levels mentioned, as well as what it was at levels of support & resistance that are denoted in the image & list.
As always, do your own due diligence before making investing/trading decisions.
For more on the methodology on how the data was collected & put together, please refer to our original Price:Volume analysis.
*** I DO NOT OWN SHARES OR OPTIONS CONTRACT POSITIONS IN ADBE AT THE TIME OF PUBLISHING THIS ARTICLE ***