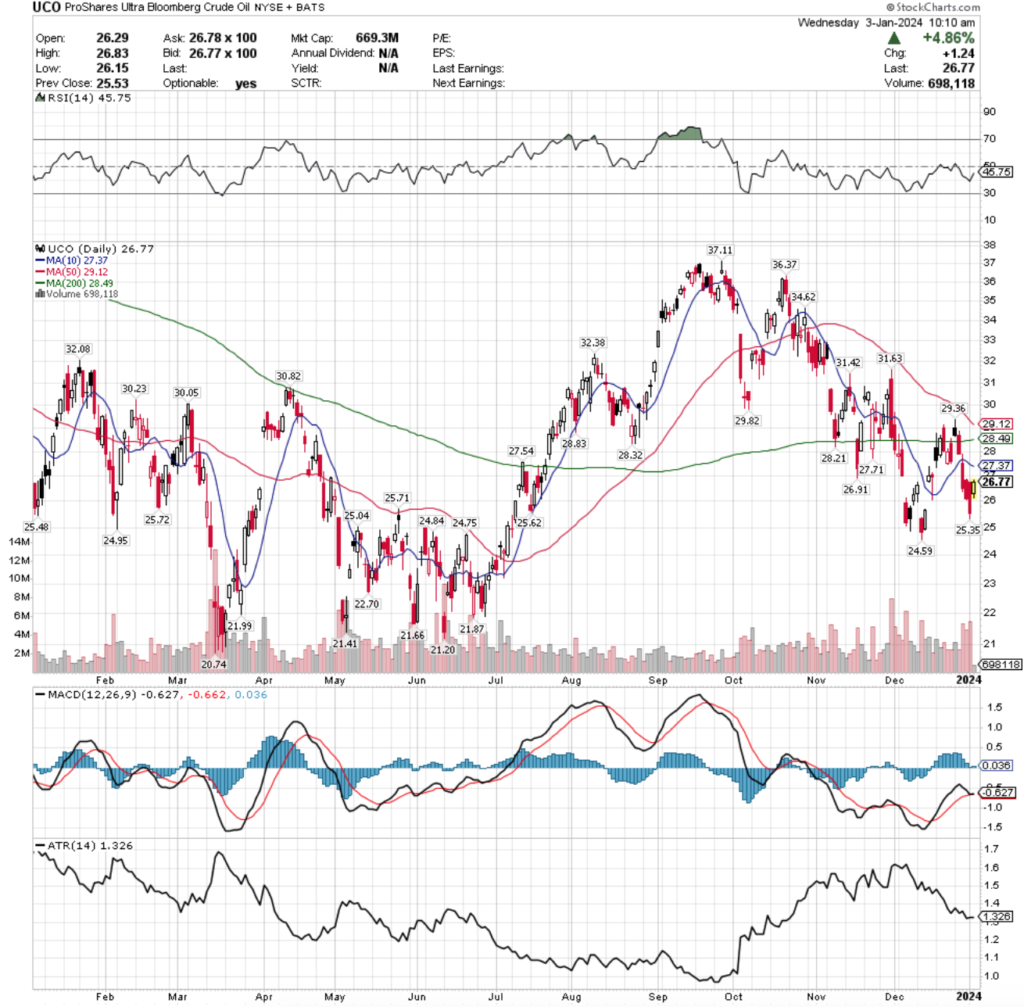
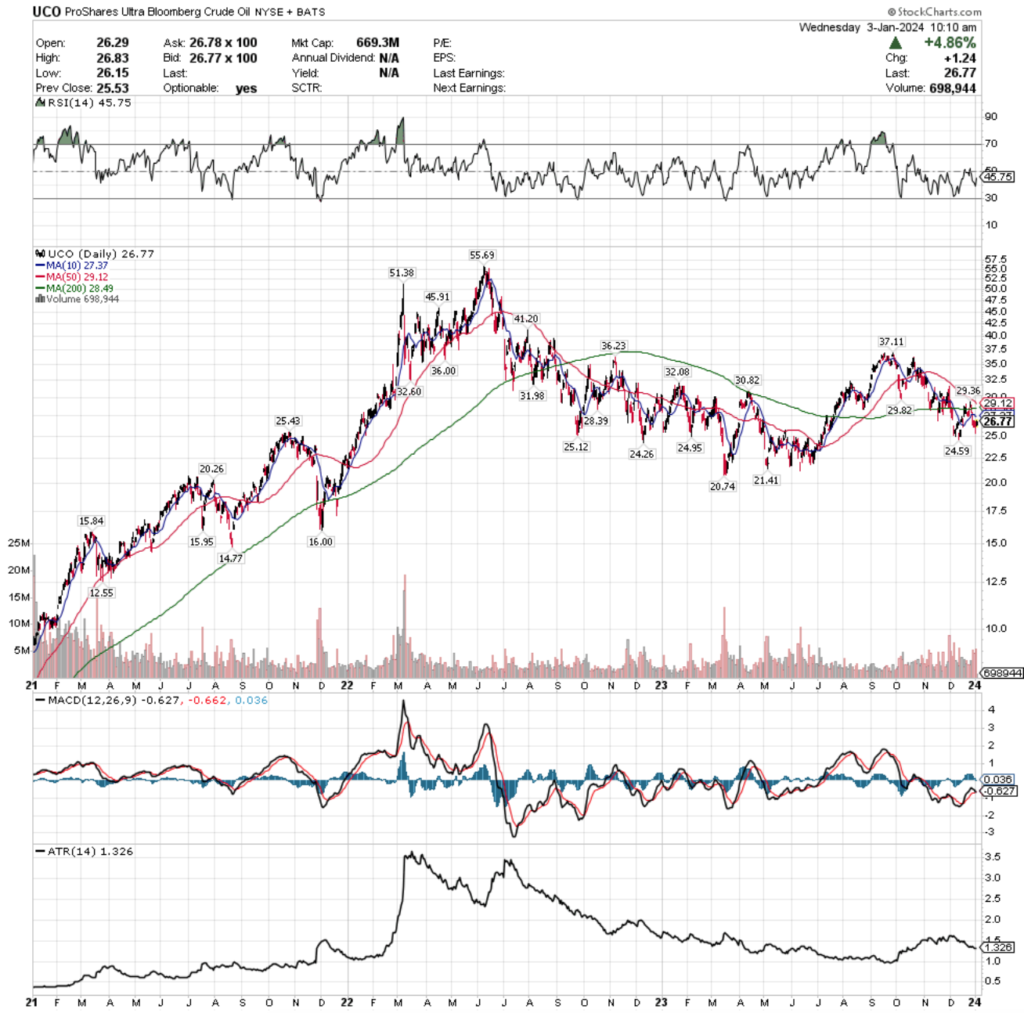
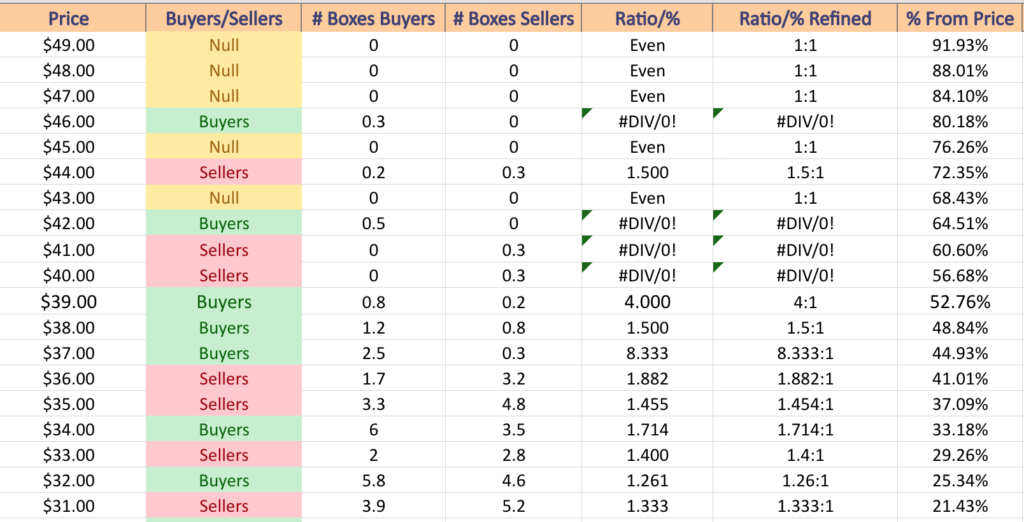
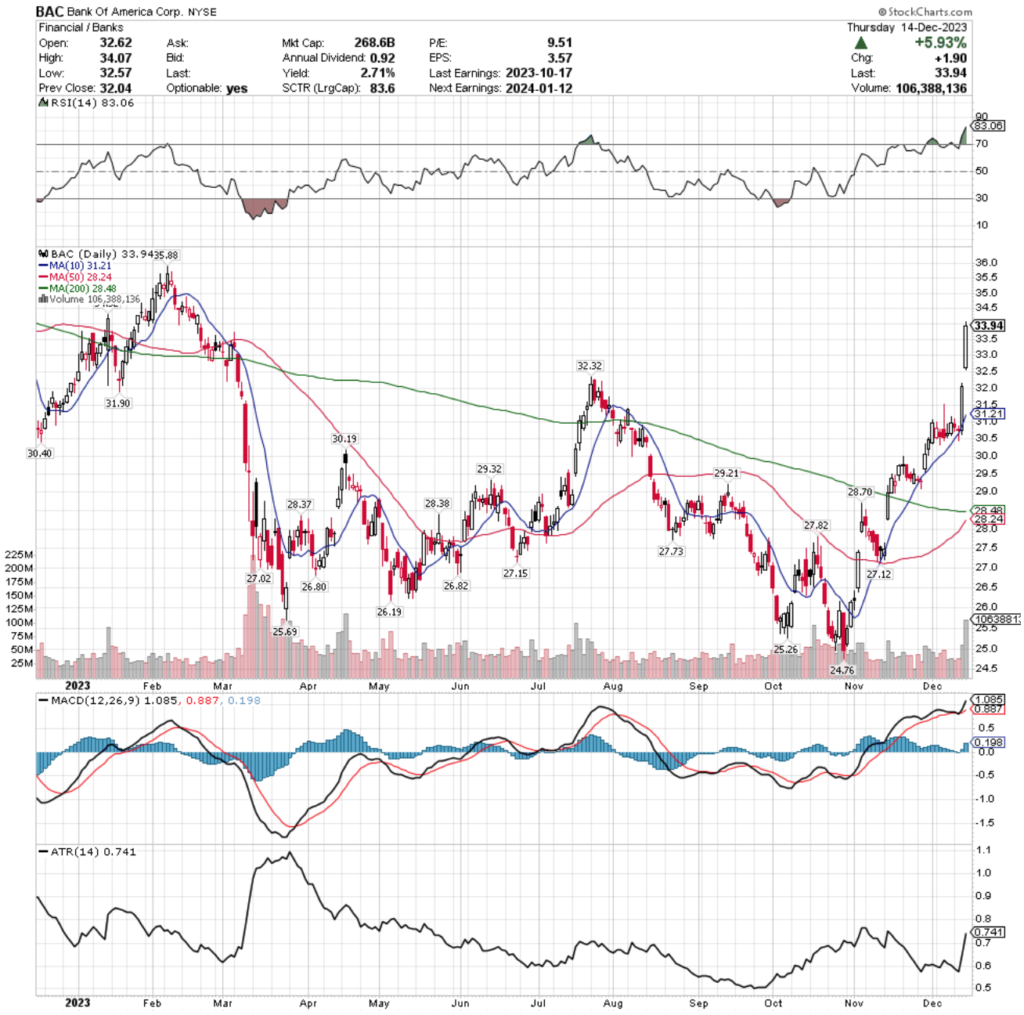
Price:Volume Sentiment Analysis For JETS, The U.S. Global Jets ETF

JETS, the U.S. Global Jets ETF has had a volatile year, climbing +17.81% from their 52-week low in September of 2022, but declining -22.67% from their 52-week high in July of 2023 (ex-distributions).

The ETF is composed of Southwest Airlines Co. (LUV, 9.98%), Delta Air Lines Inc. (DAL, 9.96%), United Airlines Holdings Inc. (UAL, 9.8%), American Airlines Group Inc. (AAL, 9.77%), Hawaiian Holdings Inc. (HA, 3.11%), Alaska Air Group Inc. (ALK, 3.07%) & more.

As broader market volatility heats up it’s worth checking in to see how buyers:sellers have interacted at the various prices that JETS has traded at in recent history (4-5 years) in order to better anticipate how they may behave in the near-future & to have an understanding of how strong support & resistance levels may be.

The Price:Volume analysis below seeks to display the volume at specific share-price levels from over the past one-to-two years & is intended to serve as a reference point for how investors viewed JETS ETF’s value at each level.

It also includes a list of moving averages, as well as support & resistance levels, which will be marked in bold.

Breaking Down The Technicals & Price:Volume Sentiment For JETS, The U.S. Global Jets ETF

JETS ETF - U.S. Global JETS ETF's Technical Performance Over The Past Year
JETS ETF – U.S. Global JETS ETF’s Technical Performance Over The Past Year

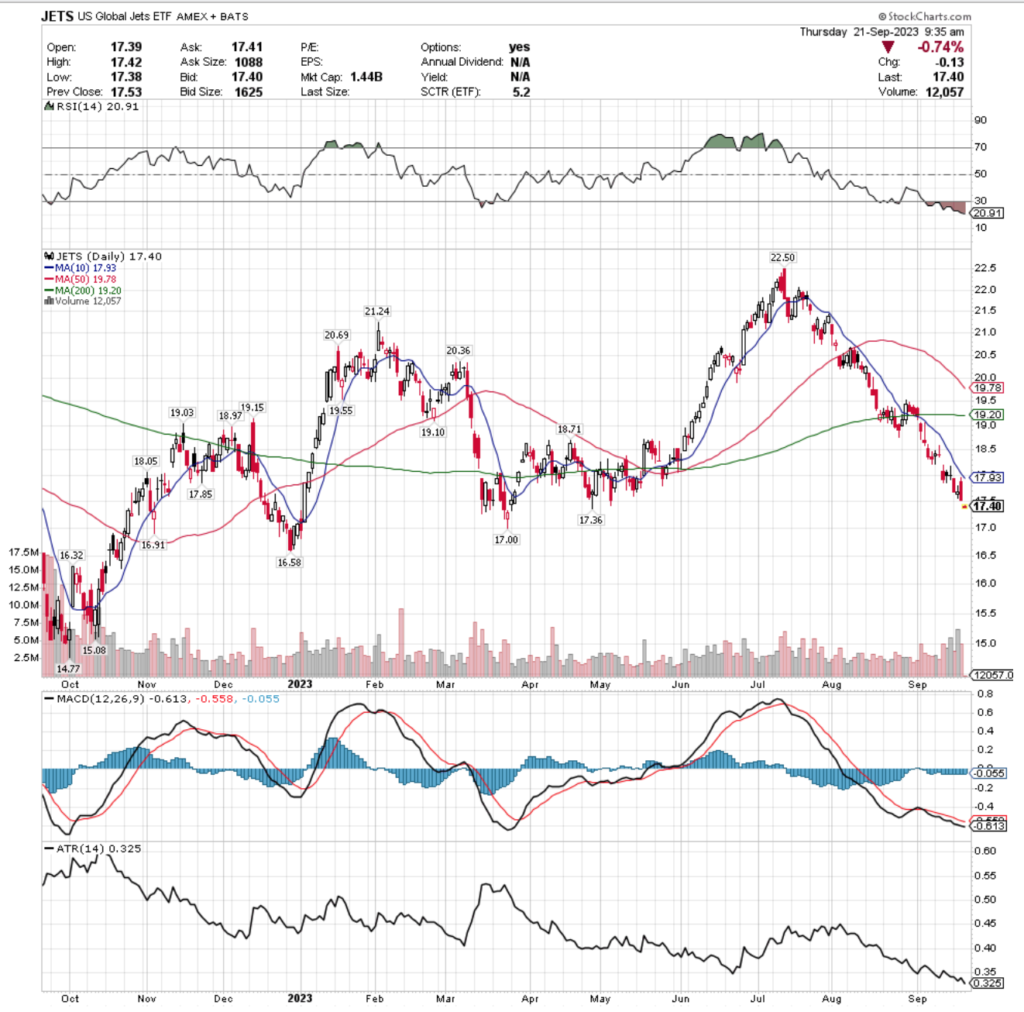
Their RSI is deeply oversold at 20.91, while their MACD is bearish but flattening out to attempt a bullish crossover in the coming week.

Unlike the major indexes & many of the other names that we have dug into this week, JETS has traded at +13.1% higher than average volume over the past week & a half compared to the year prior (4,314,025 vs. 3,814,177.29).

Sellers have dominated the battle since mid-July when they began a steep decline from their 52-week high, although 2 of the heaviest volume sessions in the past week & a half favored buyers.

JETS’s moving averages all are telling a foreboding message, with the 200 day moving average beginning to curl over bearishly & the 50 day moving average ready to make a death cross through it in the coming week.

The candlesticks of the past week & a half have been primarily bearish.

Last Monday the week kicked off with a spinning top signaling indecision among investors, followed by a gravestone doji on Tuesday which carries bearish implications.

Sure enough, Wednesday’s session was a gap down with a wide range & Thursday’s session opened higher than Wednesday’s, but it was barely able to break out above the prior day’s real body, tested the lows of it & ended up closing lower than it opened.

Friday resulted in another doji on higher than average volume within the past week & a half, but the mood was risk off as the close was narrowly lower than the open going into the weekend.

The decline continued on Monday, with the highest volume day of the past week & a half on a spinning top candlestick Tuesday.

Yesterday confirmed the indecision of the Tuesday when prices made a break upwards but were unable to match the resistance of the 10 DMA & the session closed out below the low of Tuesday.

Today appears to be following a similar track, as the price has declined & is sitting atop the lower Bollinger Band.

JETS’s Average True Range is moving away from its mean still, but after today’s session will take into account a larger price decline from the first week of September & we will likely see a brief consolidation range while indicators revert to their means before the decline continues.

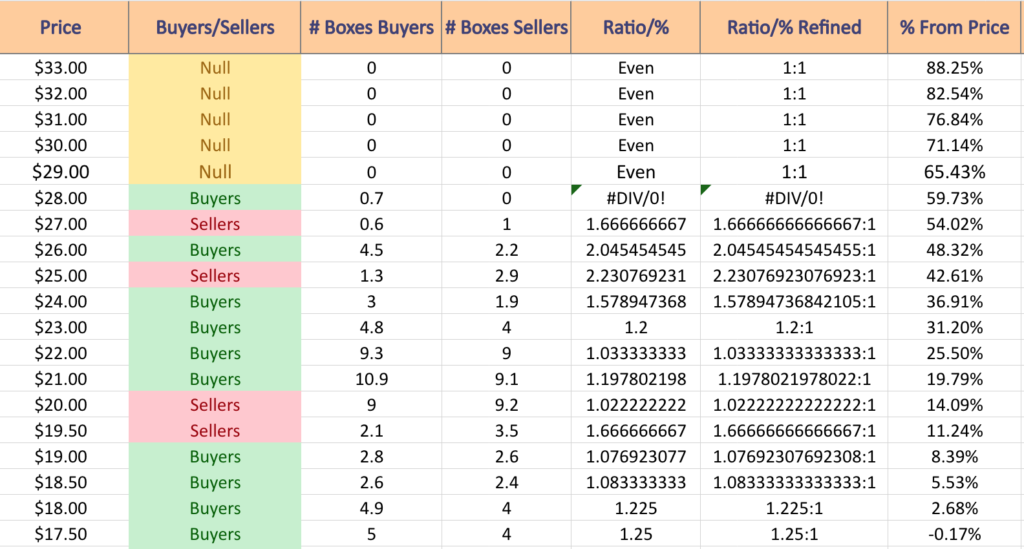
The bold prices on the image below denote the moving average levels just listed & the bold entries in the list form of the analysis under the images include other levels of support.

Each corresponding price level using a ratio of Buyers:Sellers (or Sellers:Buyers), NULL values denote that there was not enough data, so the ratio would’ve been 0:0.

Ratios with a 0 for the denominator/constant are denoted with an *, but are reported as is, as we are accounting for volume/sentiment.

JETS, U.S. Global JETS ETF's Resistance & Support Levels With Price:Volume Sentiment For The Past 4-5 Years
JETS, U.S. Global JETS ETF’s Resistance & Support Levels With Price:Volume Sentiment For The Past 4-5 Years
Price:Volume Sentiment For JETS, The U.S. Global Jets ETF Over The Past 4-5 Years

JETS, The U.S. Global Jets ETF’s Volume By Price Level Over The Past 4-5 Years

$33 – NULL – 0:0*; +88.25% From Current Price Level

$32 – NULL – 0:0*; +82.54% From Current Price Level

$31 – NULL – 0:0*; +76.84% From Current Price Level

$30 – NULL – 0:0*; +65.43% From Current Price Level

$29 – NULL – 0:0*; +65.43% From Current Price Level

$28 – Buyers – 0.7:0*; +59.73% From Current Price Level

$27 – Sellers – 1.67:1; +54.02% From Current Price Level

$26 – Buyers – 2.05:1; +48.32% From Current Price Level

$25 – Sellers – 2.23:1; +42.61% From Current Price Level

$24 – Buyers – 1.58:1; +36.91% From Current Price Level

$23 – Buyers – 1.2:1; +31.2% From Current Price Level

$22 – Buyers – 1.03:1; +25.5% From Current Price Level

$21 – Buyers – 1.2:1; +19.79% From Current Price Level

$20 – Sellers – 1.02:1; +14.09% From Current Price Level

$19.50 – Sellers – 1.67:1; +11.24% From Current Price Level – 50 Day Moving Average

$19 – Buyers – 1.08:1; +8.39% From Current Price Level – 200 Day Moving Average

$18.50 – Buyers – 1.08:1; +5.53% From Current Price Level

$18 – Buyers – 1.23:1; +2.68% From Current Price Level

$17.50 – Buyers – 1.25:1; -0.17% From Current Price Level – Current Price Level & 10 Day Moving Average

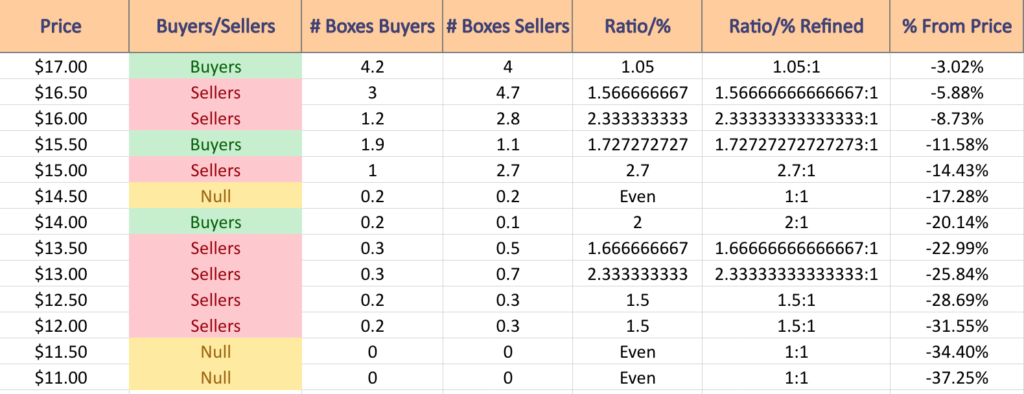
$17 – Buyers – 1.05:1; -3.02% From Current Price Level – Current Price Level

$16.50 – Sellers – 1.57:1; -5.88% From Current Price Level

$16 – Sellers – 2.33:1; -8.73% From Current Price Level

$15.50 – Buyers – 1.73:1; -11.58% From Current Price Level

$15 – Sellers – 2.7:1; -14.43% From Current Price Level

$14.50 – Even – 1:1; -17.28% From Current Price Level

$14 – Buyers – 2:1; -20.14% From Current Price Level

$13.50 – Sellers – 1.67:1; -22.99% From Current Price Level

$13 – Sellers – 2.33:1; -25.84% From Current Price Level

$12.50 – Sellers – 1.5:1; -28.69% From Current Price Level

$12 – Sellers – 1.5:1; -31.55% From Current Price Level

$11.50 – NULL – 0:0*; -34.4% From Current Price Level

$11 – NULL – 0:0*; -37.25% From Current Price Level

Tying It All Together

The list & image above paint the picture as to how investors & traders have behaved at various price levels that JETS has been at over the past four-to-five years.

It is not meant to serve as investment/trading advice, and is simply a way to visualize what investor/trader sentiment has been like at each of the price levels mentioned, as well as what it was at levels of support & resistance that are denoted in the image & list.

As always, do your own due diligence before making investing/trading decisions.

For more on the methodology on how the data was collected & put together, please refer to our original Price:Volume analysis.

*** I DO NOT OWN SHARES OR OPTIONS CONTRACT POSITIONS IN JETS AT THE TIME OF PUBLISHING THIS ARTICLE ***

Schlumberger Ltd. SLB Price:Volume Sentiment Analysis

Schlumberger Ltd. stock trades under the ticker SLB & has climbed +83.35% since their 52-week low in September of 2022 (ex-dividends), closely in-line with the advances of OIH who were featured in yesterday’s post.

SLB makes up ~20% of OIH’s total holdings & is also a component of IEZ (22.34%), XLE (4.54%), PXJ (5.02%), XES (4.2%), IYE (4.45%) RSPG (4.41%), DRLL (4.36%) & many other ETFs, hence the similar performance of the stock & the ETF.

As SLB currently sits -2.69% below their 52-week high, it’s worth taking a look into how market participants have behaved in recent history at each price level that they’ve traded at in order to gain insight into how they may behave in the near future.

This will serve as a reference for how strong support & resistance levels may be when they are approached again.

The Price:Volume analysis below seeks to display the volume at specific share-price levels from over the past one-to-two years & is intended to serve as a reference point for how investors viewed SLB stock’s value at each level.

It also includes a list of moving averages, as well as support & resistance levels, which will be marked in bold.

Breaking Down The Technicals & Price:Volume Sentiment For Schlumberger Ltd. SLB Stock

Schlumberger Ltd. SLB Stock's Technical Performance Over The Past Year
Schlumberger Ltd. SLB Stock’s Technical Performance Over The Past Year

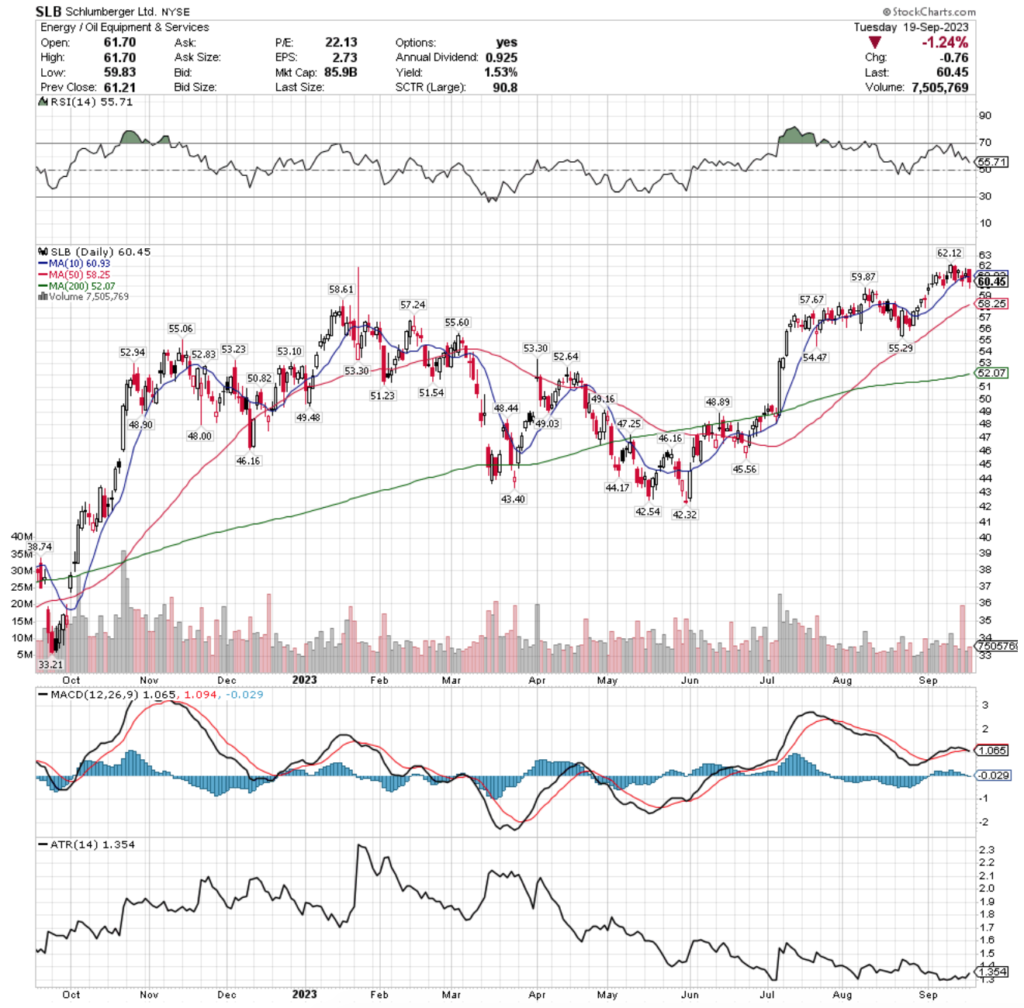
Their RSI is trending back towards neutral & currently sits at 55.71, with a MACD that is about to crossover bearishly in the coming 1-2 days.

SLB’s volumes over the past week & a half have been -6.65% below average compared to the year prior (9,960,342.86 vs. 10.670,062.95), indicating that investors have become hesitant at these high price levels to continue buying & are taking a break during this consolidation range.

One thing of note, Friday’s session had the highest volume in a risk off move into the weekend, where a spinning top candle was unable to break the resistance of the 10 day moving average.

There looks to be a bearish head & shoulders pattern forming that began forming in July/early August, where the head would be the 52-week high’s session.

The profit taking from that +12.35% run up to the high covered a much wider range of prices for the day’s session, but occurred on ~33% of the volume of the highest volume sell off day & the former session was supported by the 10 DMA, whereas the latter was unable to close above it.

This may serve as confirmation that we will see that pattern formation play out in the coming month if the 10 DMA continues to act as resistance in the coming days.

Monday’s session was another spinning top & while bullish, the price action for the day in terms of the open & the close were concentrated around the bottom of the candle, barely above the 10 DMA.

Yesterday’s session closed below the 10 DMA, with the lower shadow of the candle signaling that investors were even more bearish on the day, which looks likely to continue in the near-term.

Looking at their Average True Range (ATR, Bottom Pane of Chart), the ATR is reverting back to the mean as their price deflates, which signals that there is likely going to be more selling over the next couple of weeks before a new consolidation range is established.

With this in mind, when reading the chart & list below keep in mind the Buyer:Seller sentiment at each price level SLB trades at in the coming weeks to see if there are clues from their past 1-2 years’ of price data for how the markets will react, particularly around key support levels.

The bold prices on the image below denote the moving average levels just listed & the bold entries in the list form of the analysis under the images include other levels of support.

Each corresponding price level using a ratio of Buyers:Sellers (or Sellers:Buyers), NULL values denote that there was not enough data, so the ratio would’ve been 0:0.

Ratios with a 0 for the denominator/constant are denoted with an *, but are reported as is, as we are accounting for volume/sentiment.

Schlumberger Ltd. SLB Stock's Volume Sentiment At Each Price Level It's Covered Over The Past 1-2 Years
Schlumberger Ltd. SLB Stock’s Volume Sentiment At Each Price Level It’s Covered Over The Past 1-2 Years
Schlumberger Ltd. SLB Stock's Volume Sentiment At Each Price Level It's Covered Over The Past 1-2 Years
Schlumberger Ltd. SLB Stock’s Volume Sentiment At Each Price Level It’s Covered Over The Past 1-2 Years
Schlumberger Ltd. SLB Stock's Volume Sentiment At Each Price Level It's Covered Over The Past 1-2 Years
Schlumberger Ltd. SLB Stock’s Volume Sentiment At Each Price Level It’s Covered Over The Past 1-2 Years

Schlumberger Ltd. SLB Stock’s Volume Sentiment At Each Price Level Over The Past 1-2 Years

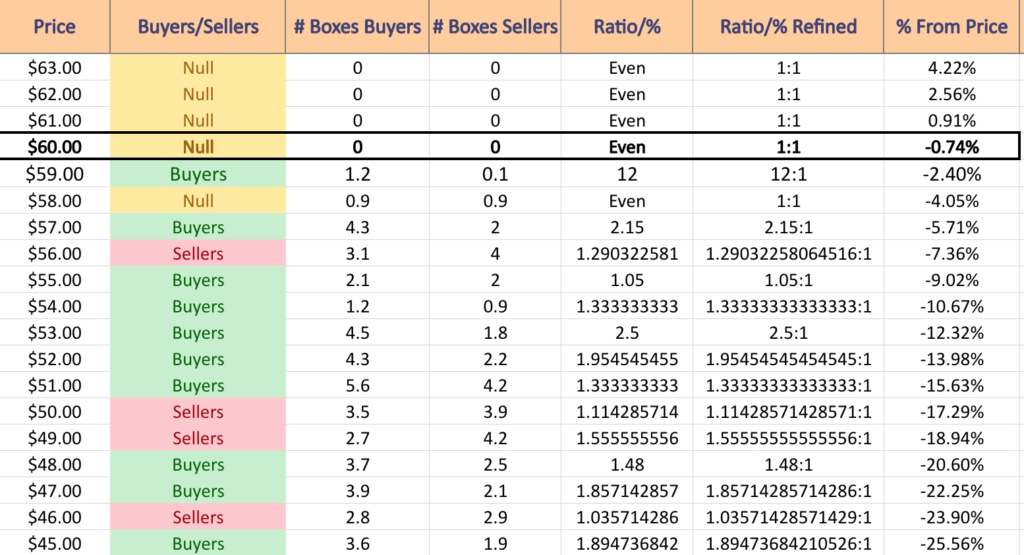
$63 – NULL – 0:0*; +4.22% From Current Price

$62 – NULL – 0:0*; +2.56% From Current Price

$61 – NULL – 0:0*; +0.91% From Current Price

$60 – NULL – 0:0*; -0.74% From Current Price – Current Price Level & 10 Day Moving Average

$59 – Buyers – 12:1; -2.4% From Current Price

$58 – NULL – 0:0*; -4.05% From Current Price – 50 Day Moving Average

$57 – Buyers – 2.15:1; -5.71% From Current Price

$56 – Sellers – 1.29:1; -7.36% From Current Price

$55 – Buyers – 1.05:1; -9.02% From Current Price

$54 – Buyers – 1.33:1; -10.67% From Current Price

$53 – Buyers – 2.5:1; -12.32% From Current Price

$52 – Buyers – 1.95:1; -13.98% From Current Price – 200 Day Moving Average

$51 – Buyers – 1.33:1; -15.63% From Current Price

$50 – Sellers – 1.11:1; -17.29% From Current Price

$49 – Sellers – 1.56:1; -18.94% From Current Price

$48 – Buyers – 1.48:1; -20.6% From Current Price

$47 – Buyers – 1.86:1; -22.25% From Current Price

$46 – Sellers – 1.04:1; -23.9% From Current Price

$45 – Buyers – 1.89:1; -25.56% From Current Price

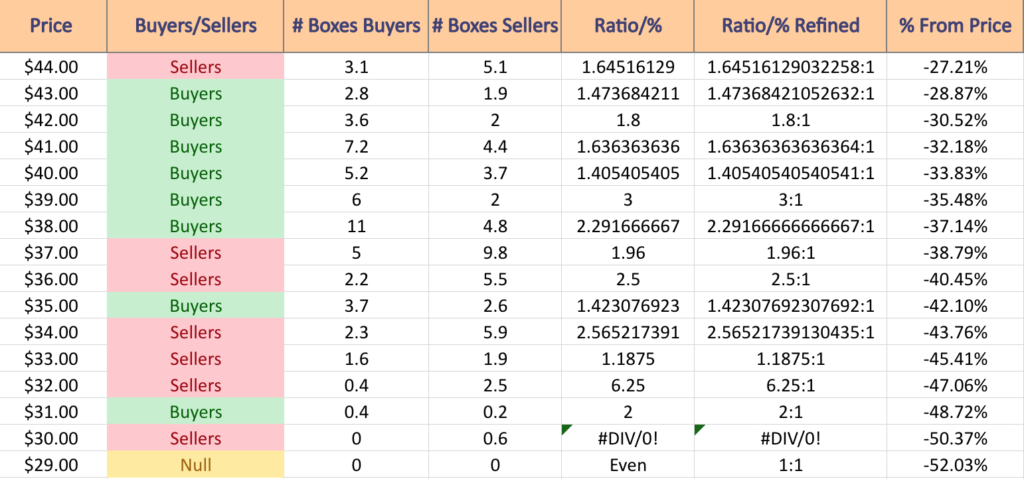
$44 – Sellers – 1.65:1; -27.21% From Current Price

$43 – Buyers – 1.47:1; -28.87% From Current Price

$42 – Buyers – 1.8:1; -30.52% From Current Price

$41 – Buyers – 1.64:1; -32.18% From Current Price

$40 – Buyers – 1.41:1; -33.83% From Current Price

$39 – Buyers – 3:1; -35.48% From Current Price

$38 – Buyers – 2.29:1; -37.14% From Current Price

$37 – Sellers – 1.96:1; -38.79% From Current Price

$36 – Sellers – 2.5:1; -40.45% From Current Price

$35 – Buyers – 1.42:1; -42.1% From Current Price

$34 – Sellers – 2.57:1; -43.76% From Current Price

$33 – Sellers – 1.19:1; -45.41% From Current Price

$32 – Sellers – 6.25:1; -47.06% From Current Price

$31 – Buyers – 2:1; 48.72% From Current Price

$30 – Sellers – 0.6:0*; -50.37% From Current Price

$29 – NULL – 0:0*; -52.03% From Current Price

Tying It All Together

The list & images above paint the picture as to how investors & traders have behaved at various price levels that SLB has been at over the past one-to-two years.

It is not meant to serve as investment/trading advice, and is simply a way to visualize what investor/trader sentiment has been like at each of the price levels mentioned, as well as what it was at levels of support & resistance that are denoted in the image & list.

As always, do your own due diligence before making investing/trading decisions.

For more on the methodology on how the data was collected & put together, please refer to our original Price:Volume analysis.

*** I DO NOT OWN SHARES OR OPTIONS CONTRACT POSITIONS IN SLB AT THE TIME OF PUBLISHING THIS ARTICLE ***
Price:Volume Sentiment Analysis For OIH, The VanEck Vectors Oil Services ETF

OIH, the VanEck Vectors Oil Services ETF has performed well over the past year, gaining +82.78% since their 52-week low in September of 2022 (ex-distributions).

Much of their success has been due to the strength of oil & oil services companies in Q4 2022 & into 2023.

Some of their largest holdings include Schlumberger Nv (SLB, 19.68%), Halliburton Co. (HAL, 11.47%), Baker Hughes Co. (BKR, 8.43%), Tenaris SA (TS, 5.04%), TechnipFMC PLC (FTI, 5%), Patterson-UTI Energy Inc. (PTEN, 4.73%) & more.

Their price is currently -1.48% below their 52-week high, making it an opportune time to check in & see what their volumes have been over the last 1-2 years at the price levels that they’ve traded at.

The Price:Volume analysis below seeks to display the volume at specific share-price levels from over the past one-to-two years & is intended to serve as a reference point for how investors viewed OIH ETF’s value at each level.

It also includes a list of moving averages, as well as support & resistance levels, which will be marked in bold.

Breaking Down The Technicals & Price:Volume Sentiment For OIH, The VanEck Vectors Oil Services ETF

OIH ETF - VanEck Vectors Oil Services ETF's Technical Performance Over The Past Year
OIH ETF – VanEck Vectors Oil Services ETF’s Technical Performance Over The Past Year

Their RSI is currently trending back towards neutral from oversold territory, but still sits relatively oversold at 63.76, as their MACD looks set for a bearish crossover in the coming days.

Trading volumes have declined -14.27% this past week compared to the average of the year prior’s volumes (602,360 vs. 702,596), as investors have adopted a wait & see approach with prices so close to their 52-week high.

The 10 day moving average will be a point of interest to keep an eye on, as it is the nearest level of support to the current share price & beginning to signal signs of weakness as it is curving over.

Last week kicked off with an up session on Monday, however the filled in candlestick body shows that the session closed lower than it opened, as enthusiasm waned during the day’s session.

Tuesday’s gap up set the stage for a rangebound rest of the week, with the last three sessions resulting in spinning top candlesticks, which signals uncertainty & hesitancy among market participants.

Technical indicators are signaling that it is time for a cool off for OIH’s price & the table & list below can be useful to see how market participants have behaved at each price level OIH traded at over the past 1-2 years.

While history will not repeat itself perfectly, it will often rhyme, making it worth having the insights below as you watch the price action for OIH in the near-future.

The bold prices on the image below denote the moving average levels just listed & the bold entries in the list form of the analysis under the images include other levels of support.

Each corresponding price level using a ratio of Buyers:Sellers (or Sellers:Buyers), NULL values denote that there was not enough data, so the ratio would’ve been 0:0.

Ratios with a 0 for the denominator/constant are denoted with an *, but are reported as is, as we are accounting for volume/sentiment.

OIH ETF's Price:Volume Sentiment At Support & Resistance Levels From A One Year Chart
OIH ETF’s Price:Volume Sentiment At Support & Resistance Levels From A One Year Chart
OIH ETF's Volume Sentiment At Each Price Level It's Traded At Over The Past 1-2 Years
OIH ETF’s Volume Sentiment At Each Price Level It’s Traded At Over The Past 1-2 Years
OIH ETF's Volume Sentiment At Each Price Level It's Traded At Over The Past 1-2 Years
OIH ETF’s Volume Sentiment At Each Price Level It’s Traded At Over The Past 1-2 Years

OIH, The VanEck Oil Services ETF’s Volume By Price Level Over The Past 1-2 Years

$368 – NULL – 0:0*; +2.58% From Current Price Level

$364 – NULL – 0:0*; +1.47% From Current Price Level

$360 – NULL – 0:0*; +0.35% From Current Price Level

$356 – NULL – 0:0*; -0.76% From Current Price Level – Current Price Block

$352 – NULL – 0:0*; -1.88% From Current Price Level – 10 Day Moving Average

$348 – Buyers – 2.3:0*; -2.99% From Current Price Level

$344 – Buyers – 3.33:1; -4.11% From Current Price Level

$340 – Buyers – 1.11:1; -5.22% From Current Price Level

$336 – Sellers – 1.14:1; -6.34% From Current Price Level – 50 Day Moving Average

$332 – Sellers – 2.56:1; -7.45% From Current Price Level

$328 – Buyer s- 1.73:1; -8.57% From Current Price Level

$324 – Buyers – 2.45:1; -9.68% From Current Price Level

$320 – Buyer s- 1.9:1; -10.8% From Current Price Level

$316 – Sellers – 2.68:1; -11.91% From Current Price Level

$312 – Buyers – 1.17:1; -13.03% From Current Price Level

$308 – Sellers – 1.53:1; -14.14% From Current Price Level

$304 – Buyers – 2.91:1; -15.26% From Current Price Level

$300 – Buyers – 2.5:1; -16.37% From Current Price Level – 200 Day Moving Average

$296 – Sellers – 2.4:1; -17.49% From Current Price Level

$292 – Sellers – 1.28:1; -18.6% From Current Price Level

$288 – Sellers – 1.87:1; -19.72% From Current Price Level

$284 – Sellers – 1.39:1; -20.83% From Current Price Level

$280 – Buyers – 1.2:1; -21.95% From Current Price Level

$276 – Buyers – 1.30:1; -23.06% From Current Price Level

$272 – Buyers – 3.23:1; -24.18% From Current Price Level

$268 – Sellers – 2.8:1; -25.29% From Current Price Level

$264 – Buyers – 1.89:1; -26.41% From Current Price Level

$260 – Buyers – 1.58:1; -27.52% From Current Price Level

$256 – Sellers – 1.73:1; -28.64% From Current Price Level

$252 – Buyers – 1.45:1; -29.75% From Current Price Level

$248 – Buyers – 4.5:1; -30.87% From Current Price Level

$244 – Sellers – 1.33:1; -31.98% From Current Price Level

$240 – Buyers – 1:0*; -33.1% From Current Price Level

$236 – Sellers – 2.8:0*; -34.21% From Current Price Level

$232 – NULL – 0:0*; -35.33% From Current Price Level

$228 – NULL – 0:0*; -36.44% From Current Price Level

Tying It All Together

The list & image above paint the picture as to how investors & traders have behaved at various price levels that OIH has been at over the past one-to-two years.

It is not meant to serve as investment/trading advice, and is simply a way to visualize what investor/trader sentiment has been like at each of the price levels mentioned, as well as what it was at levels of support & resistance that are denoted in the image & list.

As always, do your own due diligence before making investing/trading decisions.

For more on the methodology on how the data was collected & put together, please refer to our original Price:Volume analysis.

*** I DO NOT OWN SHARES OR OPTIONS CONTRACT POSITIONS IN OIH AT THE TIME OF PUBLISHING THIS ARTICLE ***
Price:Volume Sentiment Analysis For Marriott International, Inc. MAR Stock

Marriott International, Inc. stock trades under the ticker MAR & has had an excellent 2023, advancing +51.13% since their 52-week low in September of 2022.

They’ve declined -3.42% off of their 52-week high set in August of 2023, making it a great time to look at their current support levels & how strong investor sentiment was at each.

Given that there are only 2 support touch points between their current price & the next support zone, it will help market participants to understand how their price action moves in the coming days-to-weeks.

The Price:Volume analysis below seeks to display the volume at specific share-price levels from over the past one-to-two years & is intended to serve as a reference point for how investors viewed MAR stock’s value at each level.

It also includes a list of moving averages, as well as support & resistance levels, which will be marked in bold.

Marriott International, Inc. MAR Stock’s Price:Volume Sentiment Broken Down

Marriott International, Inc. MAR Stock’s Technical Performance Over The Past Year

Their RSI is on the overbought end of neutral at 57.13, with a MACD signaling bearish decline following some profit taking after they hit their 52-week high a couple of weeks ago.

Their trading volume over the past week & a half has been +15.11% above average compared to the year prior (2,217,112.5 vs. 1,926,009.96), confirming that investors were eager to take profits after the rally that led to the top that began back in June.

Their ATR is just below its average & trending lower, implying that there are more declines to come in the near future.

This is important to recognize, as their next support levels are $198.59 (-2.29%) & $191.78 (50-Day Moving Average; -5.64%) before they reach a support zone ~10% below their current price.

By understanding how market participants behaved at each price level that MAR stock has traded at over the past 1-2 years, it is possible to gauge how they might behave in the face of additional near-term declines.

The following note outlines support/resistance levels from the past year, while also breaking down the ratio of buyers:sellers (or sellers:buyers) at each price level by percentage that they’ve traded at in the past 1-2 years.

The bold prices on the image below denote the moving average levels just listed & the bold entries in the list form of the analysis under the images include other levels of support.

Each corresponding price level using a ratio of Buyers:Sellers (or Sellers:Buyers), NULL values denote that there was not enough data, so the ratio would’ve been 0:0.

Ratios with a 0 for the denominator/constant are denoted with an *, but are reported as is, as we are accounting for volume/sentiment.

Marriott International, Inc. MAR Stock’s Support & Resistance Levels Over The Past 1-2 Years With Price:Volume Level Sentiment

Marriott International, Inc. MAR Stock’s Volume By Price Level

$212 – NULL – 0:0*; +4.31% From Current Price Level

$208 – NULL – 0:0*; +2.34% From Current Price Level

$204 – NULL – 0:0*; +0.37% From Current Price Level – 10 Day Moving Average

$200 – NULL – 0:0*; -1.6% From Current Price Level

$198 – NULL – 0:0*; -2.58% From Current Price Level

$196 – NULL – 0:0*; -3.57% From Current Price Level

$194 – NULL – 0:0*; -4.55% From Current Price Level

$192 – NULL – 0:0*; -5.54% From Current Price Level

$190 – NULL – 0:0*; -6.52% From Current Price Level – 50 Day Moving Average

$188 – NULL – 0:0*; -7.5% From Current Price Level

$186 – NULL – 0:0*; -8.49% From Current Price Level

$184 – Buyers – 2.07:1; -9.47% From Current Price Level

$182 – Buyers – 1.1:0*; -10.46% From Current Price Level

$180 – Buyers – 2.75:1; -11.44% From Current Price Level

$178 – Buyers – 2.44:1; -12.42% From Current Price Level

$176 – Buyers – 1.44:1; -13.41% From Current Price Level

$174 – Sellers – 1.26:1; -14.39% From Current Price Level

$172 – Buyers – 1.2:1; -15.38% From Current Price Level

$170 – Sellers – 1.35:1; -16.36% From Current Price Level – 200 Day Moving Average

$168 – Sellers – 1.49:1; -17.34% From Current Price Level

$166 – Buyers – 1.09:1; -18.33% From Current Price Level

$164 – Buyers – 4.73:1; -19.31% From Current Price Level

$162 – Buyers – 1.39:1; -20.3% From Current Price Level

$160 – Buyers – 1.48:1; -21.28% From Current Price Level

$158 – Sellers – 1.43:1; -22.26% From Current Price Level

$156 – Sellers – 1.16:1; -23.25% From Current Price Level

$154 – Sellers – 1.23:1; -24.23% From Current Price Level

$152 – Buyers – 1.33:1; -25.22% From Current Price Level

$150 – Sellers – 1.42:1; -26.2% From Current Price Level

$148 – Sellers – 1.12:1; -27.18% From Current Price Level

$146 – Sellers – 1.17:1; -28.17% From Current Price Level

$144 – Sellers – 2.8:0*; -29.15% From Current Price Level

$142 – Buyers – 2.12:1; -30.14% From Current Price Level

$140 – Buyers – 2.09:1; -31.12% From Current Price Level

$138 – Sellers – 2.28:1; -32.1% From Current Price Level

$136 – Sellers – 1.37:1; -33.09% From Current Price Level

$134 – Sellers – 3.7:0*; -34.07% From Current Price Level

$132 – Sellers – 0.8:0*; -35.06% From Current Price Level

$130 – Sellers – 1.2:0*; -36.04% From Current Price Level

$128 – NULL – 0:0*; -37.02% From Current Price Level

Tying It All Together

The list & image above paint the picture as to how investors & traders have behaved at various price levels that MAR has been at over the past one-to-two years.

It is not meant to serve as investment/trading advice, and is simply a way to visualize what investor/trader sentiment has been like at each of the price levels mentioned, as well as what it was at levels of support & resistance that are denoted in the image & list.

As always, do your own due diligence before making investing/trading decisions.

For more on the methodology on how the data was collected & put together, please refer to our original Price:Volume analysis.

*** I DO NOT OWN SHARES OR OPTIONS CONTRACT POSITIONS IN MAR AT THE TIME OF PUBLISHING THIS ARTICLE ***

Price:Volume Sentiment Analysis For Palo Alto Networks Inc. PANW Stock

Palo Alto Networks Inc. stock trades under the ticker PANW & has advanced +77.4% from their 52-week low in January of 2023.

August has been an interesting month for them, kicking off the month with an -8% gap down, but gapping up +14.75% this past Monday.

While they’re shy of their 52-week high, it is worthwhile to examine their volume sentiment at each price level that they’ve traded at in the past 1-2 years in order to get a better understanding of how their shares may trade in the coming months.

It is particularly important as it may give insight into how they’ll trade as their price approaches the windows created by the two aforementioned gaps.

The Price:Volume analysis below seeks to display the volume at specific share-price levels from over the past two-to-three years & is intended to serve as a reference point for how investors viewed PANW stock’s value at each level.

It also includes a list of moving averages, as well as support & resistance levels, which will be marked in bold.

Palo Alto Networks Inc. PANW Stock’s Price:Volume Sentiment Broken Down

Palo Alto Networks Inc. PANW Stock’s Technical Performance Over The Past Year

Their RSI is currently neutral at 54.2 & their MACD is slightly bullish following Monday’s gap up session.

Their average true range is signaling that they will see a decline in the near-term, or at least some rangebound activity around their current price level.

Volumes over the past week & a half have been +51.82% higher than the average volume for the past year (7,307,033.51 vs. 4,812,866.01), signaling that investor sentiment was strong on last Friday & Monday of this week, which may lead to some profit taking in the near-term.

Looking in the windows created by the gap we can see that there are 2 support levels that are near the current price level, with the nearest support near the bottom of the gap getting help from the 10 day moving average in the coming week, which may help them in the event of decline.

Yesterday’s bearish engulfing candlestick is a cause for concern however & market participants would be wise to keep a close eye on PANW in the coming days-to-weeks.

The bold prices on the image below denote the moving average levels just listed & the bold entries in the list form of the analysis under the images include other levels of support.

Each corresponding price level using a ratio of Buyers:Sellers (or Sellers:Buyers), NULL values denote that there was not enough data, so the ratio would’ve been 0:0.

Ratios with a 0 for the denominator/constant are denoted with an *, but are reported as is, as we are accounting for volume/sentiment.

Palo Alto Networks Inc. PANW Stock’s Support & Resistance Levels Over The Past 1-2 Years With Price:Volume Level Sentiment

Palo Alto Networks Inc. PANW Stock’s Volume By Price Level

$260 – NULL – 0:0*; +10.85% From Current Price Level

$256 – Buyers – 0.8:0*; +9.14% From Current Price Level

$252 – Buyers – 1.5:1; +7.44% From Current Price Level

$248 – Buyers – 9.6:1; +5.73% From Current Price Level

$244 – Buyer s- 5.5:1; +4.02% From Current Price Level

$240 – Buyers – 1.46:1; +2.32% From Current Price Level

$236 – Buyers – 1.57:1; +0.61% From Current Price Level – 50 Day Moving Average

$232 – Sellers – 3.55:1; -1.09% From Current Price Level

$228 – Buyers – 1:0*; -2.8% From Current Price Level

$224 – Buyers – 2.78:1; -4.5% From Current Price Level

$220 – Buyers – 1.25:1; -6.21% From Current Price Level

$216 – Sellers – 1.29:1; -7.91% From Current Price Level – 10 Day Moving Average

$212 – Buyers – 1.26:1; -9.62% From Current Price Level

$208 – Buyers – 2.07:1; -11.32% From Current Price Level

$204 – Buyers 4.56:1; -123.03% From Current Price Level

$200 – Buyers – 2:1; -14.73% From Current Price Level

$198 – Buyer s- 2.5:0*; -15.59% From Current Price Level

$196 – Sellers – 1.13:1; -16.44% From Current Price Level

$194 – Buyers 2:1; -17.29% From Current Price Level

$192 – Buyers – 2.22:1; -18.14% From Current Price Level

$190 – Sellers – 1.07:1; -19% From Current Price Level – 200 Day Moving Average

$188 – Buyers – 1.91:1; -19.85% From Current Price Level

$186 – Sellers – 1.07:1; -20.7% From Current Price Level

$184 – Buyers 1.15:1; -21.56% From Current Price Level

$182 – Sellers – 1.73:1; -22.41% From Current Price Level

$180 – Buyers – 1.17:1; -23.26% From Current Price Level

$178 – Sellers – 1.14:1; -24.11% From Current Price Level

$176 – Buyers – 1.16:1; -24.97% From Current Price Level

$174 – Sellers – 1.5:1; -25.82% From Current Price Level

$172 – Sellers – 1.15:1; -26.67% From Current Price Level

$170 – Buyers – 1.12:1; -27.52% From Current Price Level

$168 – Sellers – 2.74:1; -28.38% From Current Price Level

$166 – Sellers – 1.16:1; -29.23% From Current Price Level

$164 – Sellers – 1.08:1; -30.08% From Current Price Level

$162 – Buyers – 5.64:1; -30.93% From Current Price Level

$160 – Sellers – 8.5:1; -31.79% From Current Price Level

$158 – Buyers – 2.08:1; -32.64% From Current Price Level

$156 – Sellers – 3.2:1; -33.49% From Current Price Level

$154 – Sellers – 2.18:1; -34.35% From Current Price Level

$152 – Sellers – 1:0*; -35.2% From Current Price Level

$150 – Buyers – 1.11:1; -36.05% From Current Price Level

$148 – Sellers – 2.78:1; -36.9% From Current Price Level

$146 – Buyers – 1.86:1; -37.76% From Current Price Level

$144 – Buyers – 1:0*; -38.61% From Current Price Level

$142 – Sellers – 2.7:1; -39.46% From Current Price Level

$140 – Sellers – 2.13:1; -40.31% From Current Price Level

$138 – Buyers – 1.13:1; -41.17% From Current Price Level

$136 – Sellers – 1.71:1; -42.02% From Current Price Level

$134 – Sellers – 2.88:1; -42.87% From Current Price Level

$132 – NULL – 0:0*; -43.72% From Current Price Level

Tying It All Together

The list & image above paint the picture as to how investors & traders have behaved at various price levels that PANW has been at over the past one-to-two years.

It is not meant to serve as investment/trading advice, and is simply a way to visualize what investor/trader sentiment has been like at each of the price levels mentioned, as well as what it was at levels of support & resistance that are denoted in the image & list.

As always, do your own due diligence before making investing/trading decisions.

For more on the methodology on how the data was collected & put together, please refer to our original Price:Volume analysis.

*** I DO NOT OWN SHARES OR OPTIONS CONTRACT POSITIONS IN PANW AT THE TIME OF PUBLISHING THIS ARTICLE ***
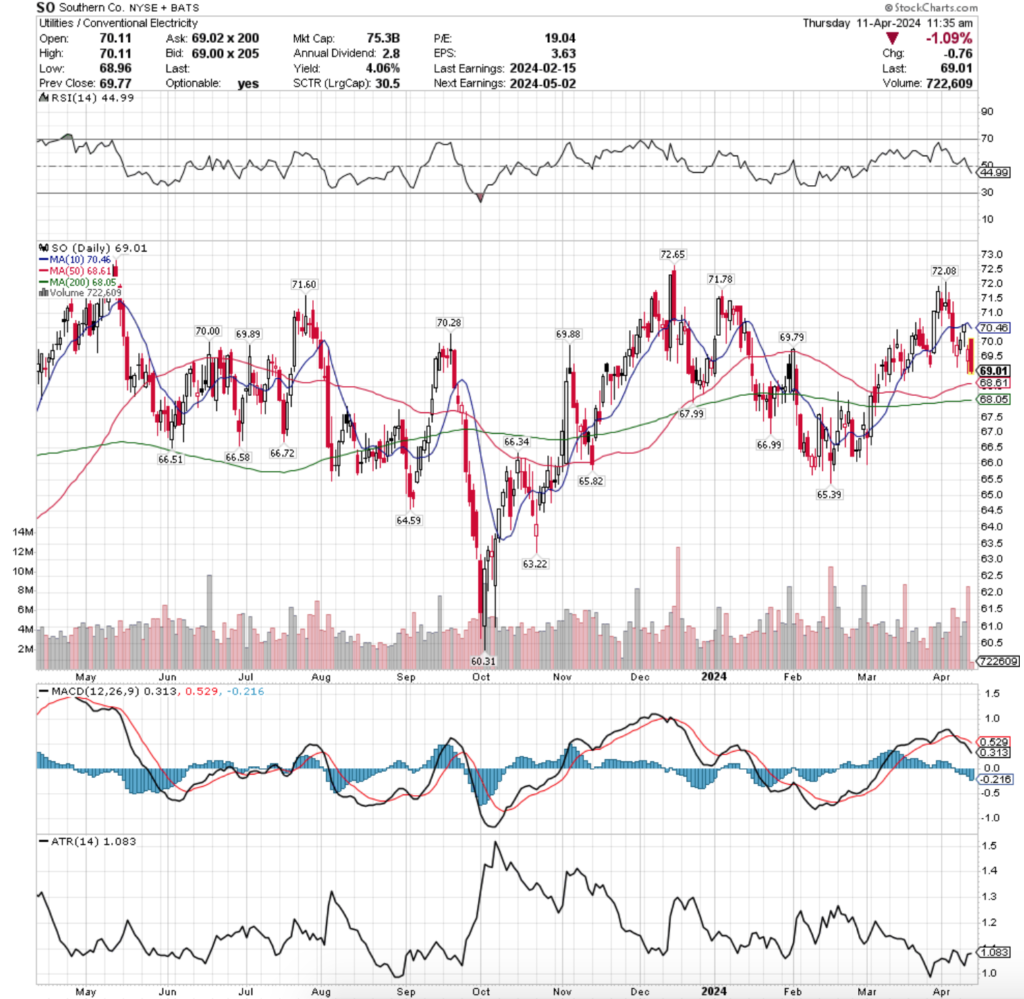

Price:Volume Sentiment Analysis For Akamai Technologies, Inc. AKAM Stock

Akamai Technologies, Inc. stock trades under the ticker AKAM & has advanced +43.92% since their 52-week low in March of 2023.

After making a fresh new 52-week high last week & seeing their oscillators it is time to check in with how their volume has been at each price level that they’ve traded at in recent history (past 1-2 years).

Given the +8.47% gap up they experienced last week having limited support within the window (with exception to their 10 day moving average & a couple of other touch-points towards the lower end of the window), it becomes even more important to understand how market participants have viewed their valuation at various price levels, as there is otherwise unstable footing at their recent price levels.

The Price:Volume analysis below seeks to display the volume at specific share-price levels from over the past two-to-three years & is intended to serve as a reference point for how investors viewed AKAM stock’s value at each level.

It also includes a list of moving averages, as well as support & resistance levels, which will be marked in bold.

Akamai Technologies, Inc. AKAM Stock’s Price:Volume Sentiment Broken Down

Akamai Technologies, Inc. AKAM Stock's Technical Performance Over The Past Year
Akamai Technologies, Inc. AKAM Stock’s Technical Performance Over The Past Year

As noted above, their oscillators are signaling impending declines with their RSI just returning from overbought levels at 67.61 & their MACD is beginning to curl over into a bearish reversal.

Their trading volumes over the past week & a half have increased by +90.59% compared to the past year’s average volume as market participants were eager to get involved in the gap up & have remained eager to take profits off of the table (2,938,294.5 vs. 1,541,687.92), which is flashing signals of an impending reversal in sentiment/a continuation of the past few days’ declines.

AKAM’s 50 day moving average is lagging their 10 day moving average by -6.4% & will likely not be able to provide extra support within the window unless they establish a temporary consolidation range in the meantime, leaving them limited support in the window, especially given that their second highest support level of the past 52-weeks will become less relevant by the end of the week as it is nearing 52-weeks old.

Their range for the gap-up day was very wide, but the real body of the candlestick for that day is a fraction of said range, followed by two bullish spinning tops that have upper wicks just slightly higher above being hanging man candles, indicating investors were becoming uncertain about their price level.

The declines began this week, with a dragonfly doji on Monday, followed by a decline Tuesday that was pumped up to have a higher close than open & Wednesday’s session’s real body indicates further declines on the horizon.

With all of these factors in mind, it becomes even more apparent that having an understanding of their price:volume sentiment is essential in the coming weeks.

The bold prices on the image below denote the moving average levels just listed & the bold entries in the list form of the analysis under the images include other levels of support.

Each corresponding price level using a ratio of Buyers:Sellers (or Sellers:Buyers), NULL values denote that there was not enough data, so the ratio would’ve been 0:0.

Ratios with a 0 for the denominator/constant are denoted with an *, but are reported as is, as we are accounting for volume/sentiment.

Akamai Technologies, Inc. AKAM Stock’s Support & Resistance Levels Over The Past 1-2 Years With Price:Volume Level Sentiment

Akamai Technologies, Inc. AKAM Stock’s Volume By Price Level

$124 – NULL – 0:0*; +21.32% From Current Price Level

$122 – NULL – 0:0*; +19.36% From Current Price Level

$120 – Buyers – 2.92:1; +17.41% From Current Price Level

$118 – Sellers – 1.64:1; +15.45% From Current Price Level

$116 – Buyers – 2.53:1; +13.49% From Current Price Level

$114 – Sellers – 1.15:1; +11.54% From Current Price Level

$112 – Buyers – 1.86:1; +9.58% From Current Price Level

$110 – Buyers – 3.08:1; +7.62% From Current Price Level

$108 – Buyers – 2.85:1; +5.66% From Current Price Level

$106 – Sellers – 1.2:0*; +3.71% From Current Price Level

$104 – Sellers – 3:1; +1.75% From Current Price Level

$102 – Sellers – 1.93:1; -0.21% From Current Price Level

$100 – Sellers – 1.4:1; -2.16% From Current Price Level

$99 – Sellers – 1.5:1; -3.14% From Current Price Level

$98 – Buyers – 1.84:1; -4.12% From Current Price Level – 10 Day Moving Average

$97 – Sellers – 1.17:1; -5.1% From Current Price Level

$96 – Buyers – 2.85:1; -6.08% From Current Price Level

$95 – Buyers – 1.36:1; -7.05% From Current Price Level

$94 – Buyers – 3.45:1; -8.03% From Current Price Level

$93 – Buyers – 2.28:1; -9.01% From Current Price Level – 50 Day Moving Average

$92 – Sellers – 1.25:1; -9.99% From Current Price Level

$91 – Sellers – 1.94:1; -10.97% From Current Price Level

$90 – Sellers – 1.6:1; -11.95% From Current Price Level

$89 – Buyers – 1.61:1; -12.92% From Current Price Level

$88 – Buyers – 1.21:1; -13.9% From Current Price Level

$87 – Sellers – 1.32:1; -14.88% From Current Price Level

$86 – Sellers – 2.05:1; -15.86% From Current Price Level – 200 Day Moving Average

$85 – Sellers – 1.02:1; -16.84% From Current Price Level

$84 – Sellers – 1.02:1; -17.82% From Current Price Level

$83 – Buyers – 2.03:1; -18.79% From Current Price Level

$82 – Sellers – 2.3:1; -19.77% From Current Price Level

$81 – Buyers – 2.5:1; -20.75% From Current Price Level

$80 – Sellers – 1.19:1; -21.73% From Current Price Level

$79 – Sellers – 2.43:1; -22.71% From Current Price Level

$78 – Sellers – 2.83:1; -23.69% From Current Price Level

$77 – Sellers – 3.75:1; -24.66% From Current Price Level

$76 – Buyers – 2.33:1; -25.64% From Current Price Level

$75 – Buyers – 3.64:1; -26.62% From Current Price Level

$74 – Sellers – 3:0*; -27.6% From Current Price Level

$73 – Buyers – 5:1; -28.58% From Current Price Level

$72 – Sellers – 1.83:1; -29.56% From Current Price Level

$71 – Buyers – 1.27:1; -30.54% From Current Price Level

$70 – NULL – 0:0*

Tying It All Together

The list & image above paint the picture as to how investors & traders have behaved at various price levels that AKAM has been at over the past one-to-two years.

It is not meant to serve as investment/trading advice, and is simply a way to visualize what investor/trader sentiment has been like at each of the price levels mentioned, as well as what it was at levels of support & resistance that are denoted in the image & list.

As always, do your own due diligence before making investing/trading decisions.

For more on the methodology on how the data was collected & put together, please refer to our original Price:Volume analysis.

*** I DO NOT OWN SHARES OR OPTIONS CONTRACT POSITIONS IN AKAM AT THE TIME OF PUBLISHING THIS ARTICLE ***
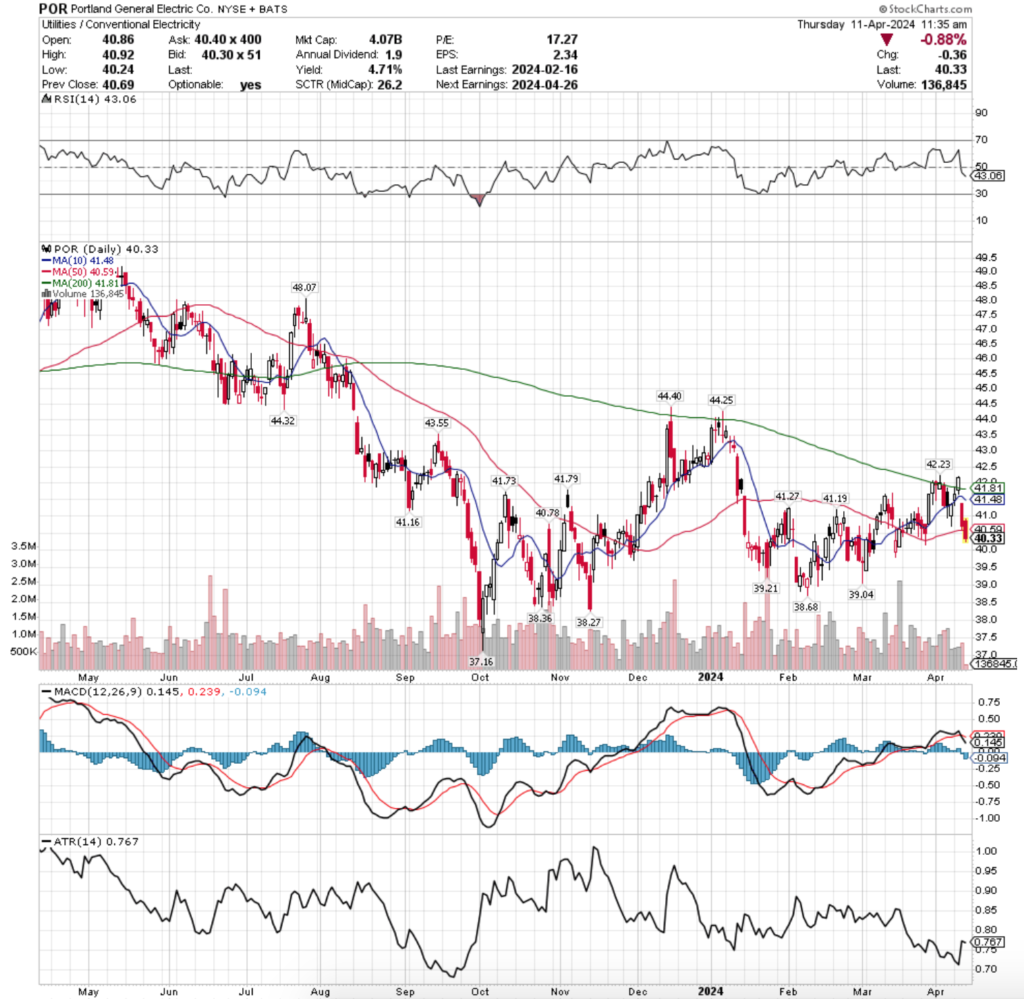

Price:Volume Sentiment Analysis For Eli Lilly & Co. LLY Stock

Eli Lilly & Co. stock trades under the ticker LLY & has had a remarkable past year, climbing 84.69% from their 52-week low in September of 2022 (ex-yields).

LLY has continued to climb higher after last week’s large gap up session & continues to establish new 52-week highs, making it an important time to check in & see how market participant sentiment has been at the various price levels they have traded at over the past one-to-two years.

By doing so, it will be easier to visualize what support levels may be stronger than others when LLY’s price corrects & people begin to take their profits down from the table.

The Price:Volume analysis below seeks to display the volume at specific share-price levels from over the past two-to-three years & is intended to serve as a reference point for how investors viewed LLY stock’s value at each level.

It also includes a list of moving averages, as well as support & resistance levels, which will be marked in bold.

Eli Lilly & Co. LLY Stock’s Price:Volume Sentiment Broken Down

Eli Lilly & Co. LLY Stock’s Technical Performance Over The Past Year

Their RSI is overbought following last week’s gap up session & their MACD is signaling very bullish & standing almost vertical.

One note on their RSI, earlier this year LLY traded from early April until almost the end of May with an RSI that was in overbought territory, however this was on steady day-over-day climbing & not due to a large gap up.

Last week’s volumes were 97.1% higher than the average volume for the past year (5,909,900 vs. 2,998,360), a signal of strength & conviction that confirms that 11.43% price gap up & continued strength.

It will be interesting to see what support levels look like by the time that the 10 day moving average comes closer to their share price, as the 10 DMA is currently about halfway through the gap traveling towards the price, while the 50 DMA still has yet to reach the window.

In the event of a correction in price that may pose a problem for market participants if the price is able to break below the 10 day moving average as there will not be support to stop the gap from filling.

Following Tuesday’s gap up, Wednesday continued the climb higher but ended on a spinning top, with Thursday’s inverted hammer sending the share price higher again on Friday & today.

Given everything mentioned above & that a 10% correction from the current price levels puts LLY at ~$484/share with only the 10 day moving average to act as support, it is important to have a breakdown of how they’ve traded at different price levels to see if that can provide clues to market behavior when there are no true support levels nearby.

The bold prices on the image below denote the moving average levels just listed & the bold entries in the list form of the analysis under the images include other levels of support.

Each corresponding price level using a ratio of Buyers:Sellers (or Sellers:Buyers), NULL values denote that there was not enough data, so the ratio would’ve been 0:0.

Ratios with a 0 for the denominator/constant are denoted with an *, but are reported as is, as we are accounting for volume/sentiment.

Eli Lilly & Co. LLY Stock’s Support & Resistance Levels Over The Past 1-2 Years With Price:Volume Level Sentiment

Eli Lilly & Co. LLY Stock’s Volume By Price Level

$540 – NULL – 0:0*; +2.22% From Current Price Level

$535 – NULL – 0:0*; +1.27% From Current Price Level

$530 – NULL – 0:0*; +0.33% From Current Price Level

$525 – Buyers – 1.8:0*; -0.62% From Current Price Level

$520 – Buyers – 5:0*; -1.57% From Current Price Level

$515 – NULL – 0:0*; -2.51% From Current Price Level

$510 – NULL – 0:0*; -3.46% From Current Price Level

$505 – NULL – 0:0*; -4.41% From Current Price Level

$500 – NULL – 0:0*; -5.35% From Current Price Level

$496 – NULL – 0:0*; -6.11% From Current Price Level

$492 – NULL – 0:0*; -6.87% From Current Price Level

$488 – NULL – 0:0*; -7.62% From Current Price Level

$484 – NULL – 0:0*; -8.38% From Current Price Level

$480 – NULL – 0:0*; -9.14% From Current Price Level – 10 Day Moving Average

$476 – NULL – 0:0*; -9.9% From Current Price Level

$472 – NULL – 0:0*; -10.65% From Current Price Level

$468 – Sellers – 1.1:0*; -11.41% From Current Price Level

$464 – Buyers – 2.8:0*; -12.17% From Current Price Level

$460 – Sellers – 2:1; -12.92% From Current Price Level

$456 – Buyers – 1.36:1; -13.68% From Current Price Level – 50 Day Moving Average

$452 – Buyer s- 1.31:1; -14.44% From Current Price Level

$448 – Buyers – 3.88:1; -15.2% From Current Price Level

$444 – Buyers – 1.07:1; -15.95% From Current Price Level

$440 – Buyers – 10:1; -16.71% From Current Price Level

$436 – Buyers – 1.48:1; -17.47% From Current Price Level

$432 – Sellers – 1.03:1; -18.23% From Current Price Level

$428 – Buyers – 5.3:0*; -18.98% From Current Price Level

$424 – Sellers – 1.39:1; -19.74% From Current Price Level

$420 – Sellers – 1.5:0*; -20.5% From Current Price Level

$416 – NULL – 0:0*; -21.25% From Current Price Level

$412 – NULL – 0:0*; -22.01% From Current Price Level

$408 – NULL – 0:0*; -22.77% From Current Price Level

$404 – Buyers – 1.3:0*; -23.53% From Current Price Level

$400 – Sellers – 1.2:0*; -24.28% From Current Price Level

$396 – NULL – 0:0*; -25.04% From Current Price Level

$392 – Buyers – 1.8:0*; -25.8% From Current Price Level

$388 – Buyers – 1.7:0*; -26.55% From Current Price Level

$384 – Buyers – 1.2:0*; -27.31% From Current Price Level – 200 Day Moving Average

$380 – Buyers – 1.67:1; -28.07% From Current Price Level

$376 – NULL – 0:0*; -28.83% From Current Price Level

$372 – Buyers – 1.47:1; -29.58% From Current Price Level

$368 – Buyers – 1.43:1; -30.34% From Current Price Level

$364 – Buyers – 2.2:1; -31.1% From Current Price Level

$360 – Buyers – 1.38:1; -31.85% From Current Price Level

$356 – Sellers – 1.08:1; -32.61% From Current Price Level

$352 – Sellers – 1.03:1; -33.37% From Current Price Level

$348 – Sellers – 1.03:1; -34.13% From Current Price Level

$344 – Sellers – 2.04:1; -34.88% From Current Price Level

$340 – Sellers – 1.26:1; -35.64% From Current Price Level

$336 – Buyers – 7.78:1; -36.4% From Current Price Level

$332 – Sellers – 1.43:1; -37.15% From Current Price Level

$328 – Buyers – 1.14:1; -37.91% From Current Price Level

$324 – Buyers – 1.29:1; -38.67% From Current Price Level

$320 – Buyers – 2.15:1; -39.43% From Current Price Level

$316 – Sellers – 1.11:1; -40.18% From Current Price Level

$312 – Sellers – 1.51:1; -40.94% From Current Price Level

$308 – Buyers – 2.5:1; -41.7% From Current Price Level

$304 – Sellers – 1.8:1; -42.45% From Current Price Level

$300 – Sellers – 1.41:1; -43.21% From Current Price Level

$296 – Sellers – 1.6:1; -43.97% From Current Price Level

$292 – Sellers – 1.4:1; -44.73% From Current Price Level

$288 – Buyers – 0.7:0*; -45.48% From Current Price Level

$284 – Sellers – 1.27:1; -46.24% From Current Price Level

$280 – NULL – 0:0*; -47% From Current Price Level

$276 – NULL – 0:0*; -47.75% From Current Price Level

Tying It All Together

The list & image above paint the picture as to how investors & traders have behaved at various price levels that LLY has been at over the past one-to-two years.

It is not meant to serve as investment/trading advice, and is simply a way to visualize what investor/trader sentiment has been like at each of the price levels mentioned, as well as what it was at levels of support & resistance that are denoted in the image & list.

As always, do your own due diligence before making investing/trading decisions.

For more on the methodology on how the data was collected & put together, please refer to our original Price:Volume analysis.

*** I DO NOT OWN SHARES OR OPTIONS CONTRACT POSITIONS IN LLY AT THE TIME OF PUBLISHING THIS ARTICLE ***
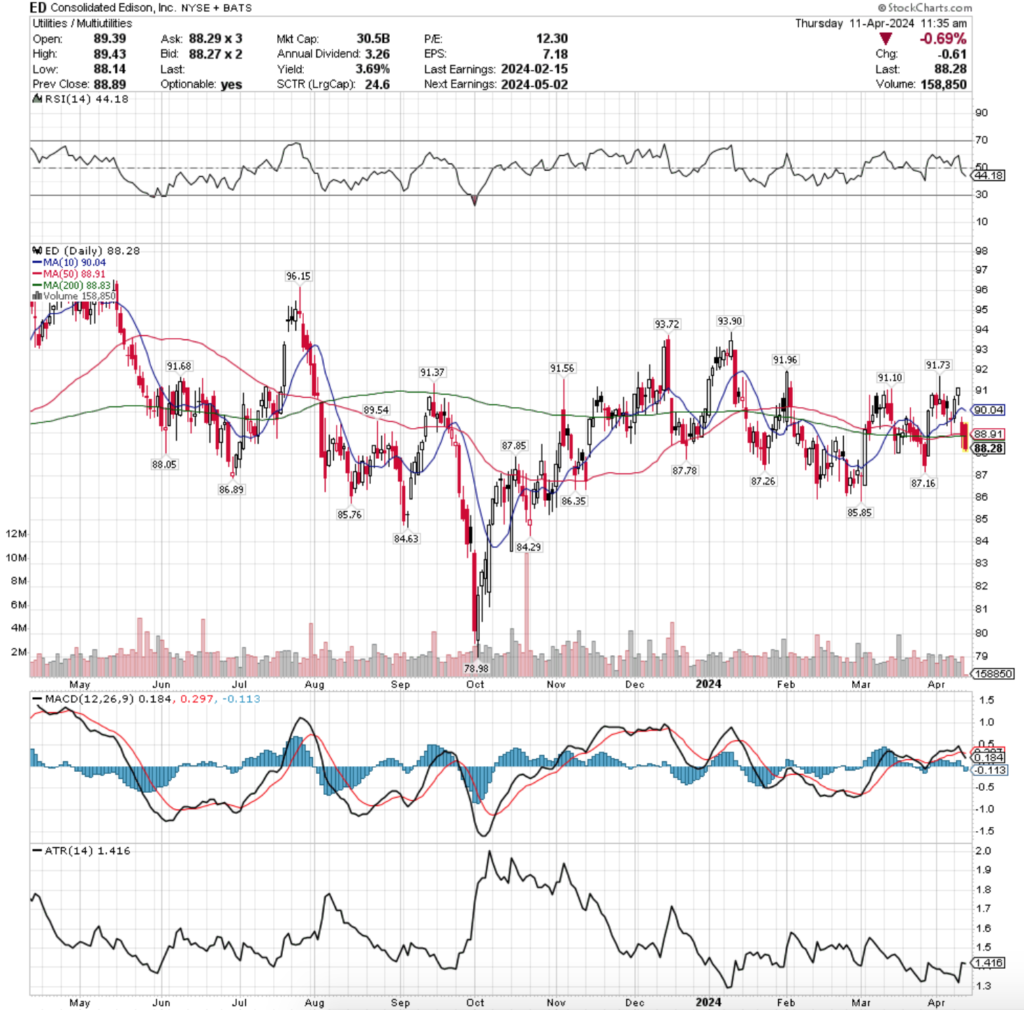
Price:Volume Sentiment Analysis For Booking Holdings Inc. BKNG Stock

Booking Holdings Inc. stock trades under the ticker BKNG & has steadily climbed +100.73% from their 52-week low in October of 2022.

Yesterday they closed at their 52-week high of $3,245.55/share & their oscillators are signaling that there is going to be an impending cool-down, which makes it imperative for market participants to have an understanding of how buyers & sellers behaved at different price points in recent history.

The Price:Volume analysis below seeks to display the volume at specific share-price levels from over the past two-to-three years & is intended to serve as a reference point for how investors viewed BKNG stock’s value at each level.

It also includes a list of moving averages, as well as support & resistance levels, which will be marked in bold.

Booking Holdings Inc. BKNG Stock’s Price:Volume Sentiment Broken Down

Booking Holdings Inc. BKNG Stock’s Technical Performance Over The Past Year

Their RSI is overbought at 73.22, with a bullish MACD following Friday’s gap up session.

Trading volumes over the past week (ex-today) have been +59.73% higher than the average volumes that they have traded at over the past year (546,160 vs. 341,934).

The largest concentration of the past week’s volume came on Friday’s gap up, followed by Thursday’s gap down that Friday’s session recovered from, with Monday’s bullish session having the third highest volume.

With that in mind, market participants should beware of near-term profit taking & be prepared for its impact on BKNG’s price, especially as yesterday’s session reached a 52-week high for the stock.

Last week featured two spinning top candlesticks during BKNG’s decline, with Friday’s candlestick resembling a hanging man, but its body is too long, which indicates a wide day’s trading range, as well as a wide spread between the open & close.

Investors should also note that on Friday, they gapped up, retraced much of the movement & still closed below where they opened for the day’s session, which indicates that there is still uncertainty about their proper valuation & investors are becoming nervous.

As BKNG is near its 52-week high, it is important to understand how market participants have behaved at the various price levels that they’ve traded at over the past 1-2 years, in order to better understand how support levels will hold up for them in the future.

The bold prices on the image below denote the moving average levels just listed & the bold entries in the list form of the analysis under the images include other levels of support.

Each corresponding price level using a ratio of Buyers:Sellers (or Sellers:Buyers), NULL values denote that there was not enough data, so the ratio would’ve been 0:0.

Ratios with a 0 for the denominator/constant are denoted with an *, but are reported as is, as we are accounting for volume/sentiment.

Booking Holdings Inc. BKNG Stock’s Support & Resistance Levels Over The Past 1-2 Years With Price:Volume Level Sentiment

Booking Holdings Inc. BKNG Stock’s Volume By Price Level

$3,250 – NULL – 0:0*, +0.14% From Current Price Level

$3,200 – NULL – 0:0*, -1.4% From Current Price Level

$3,150 – NULL – 0:0*, -2.94% From Current Price Level

$3,100 – NULL – 0:0*, -4.48% From Current Price Level

$3,050 – NULL – 0:0*, -6.03% From Current Price Level

$3,000 – Buyers – 2:0*, -7.57% From Current Price Level

$2,950 – Sellers – 1.11:1, -9.11% From Current Price Level – 10 Day Moving Average

$2,900 – Buyers – 1.4:1, -10.65% From Current Price Level

$2,850 – Sellers – 2.5:1, -12.19% From Current Price Level

$2,800 – Sellers – 1.83:1, -13.73% From Current Price Level

$2,750 – Buyers – 3.4:1, -15.27% From Current Price Level – 50 Day Moving Average

$2,700 – Buyers – 3.2:0*, -16.81% From Current Price Level

$2,650 – Buyers – 1.9:1, -18.35% From Current Price Level

$2,600 – Sellers – 1.58:1, -19.89% From Current Price Level

$2,550 – Sellers – 1.9:1, -21.43% From Current Price Level

$2,500 – Sellers – 1.46:1, -22.97% From Current Price Level

$2,490 – Sellers – 1.57:1, -23.28% From Current Price Level

$2,480 – Buyers – 1.14:1, -23.59% From Current Price Level

$2,470 – Buyers – 2.2:0*, -23.9% From Current Price Level

$2,460 – Buyers – 2:1, -24.2% From Current Price Level

$2,450 – Buyers – 2.1:0*, -24.51% From Current Price Level

$2,440 – Buyers – 2.1:0*, -24.82% From Current Price Level

$2,430 – Sellers – 1.06:1, -25.13% From Current Price Level

$2,420 – Sellers – 1.78:1, -25.44% From Current Price Level – 200 Day Moving Average

$2,410 – Sellers – 0.8:0*, -25.74% From Current Price Level

$2,400 – Buyers – 1:0*, -26.05% From Current Price Level

$2,390 – Sellers – 0.6:0*, -26.36% From Current Price Level

$2,380 – NULL – 0:0*, -26.67% From Current Price Level

$2,370 – NULL – 0:0*, -26.98% From Current Price Level

$2,360 – NULL – 0:0*. -27.29% From Current Price Level

$2,350 – NULL – 0:0*, -27.59% From Current Price Level

$2,340 – Sellers – 1.5:1, -27.9% From Current Price Level

$2,330 – Buyers – 0.7:0*, -28.21% From Current Price Level

$2,320 – NULL – 0:0*, -28.52% From Current Price Level

$2,310 – Buyers – 0.6:0*, -28.83% From Current Price Level

$2,300 – Buyers – 0.6:0*, -29.13% From Current Price Level

$2,290 – Sellers – 0.6:0*, -29.44% From Current Price Level

$2,280 – NULL – 0:0*, -29.75% From Current Price Level

$2,270 – NULL – 0:0*, -30.06% From Current Price Level

$2,260 – NULL – 0:0*, -30.37% From Current Price Level

$2,250 – Buyers – 0.6:0*, -30.67% From Current Price Level

$2,240 – NULL – 0:0*, -30.98% From Current Price Level

$2,230 – NULL – 0:0*, -31.29% From Current Price Level

$2,220 – Buyers – 1:0*, -31.6% From Current Price Level

$2,210 – NULL – 0:0*, -31.91% From Current Price Level

$2,200 – Buyers – 0.6:0*, -32.21% From Current Price Level

$2,190 – NULL – 0:0*, -32.52% From Current Price Level

$2,180 – NULL – 0:0*, -32.83% From Current Price Level

$2,170 – Buyers – 0.7:0*, -33.14% From Current Price Level

$2,160 – NULL – 0:0*, -33.45% From Current Price Level

$2,150 – NULL – 0:0*, -33.76% From Current Price Level

$2,140 – Buyers – 0.8:0*, -34.06% From Current Price Level

$2,130 – NULL – 0:0*, -34.37% From Current Price Level

$2,120 – NULL – 0:0*, -34.68% From Current Price Level

$2,110 – Buyers – 0.7:0*, -34.99% From Current Price Level

$2,100 – NULL – 0:0*, -35.3% From Current Price Level

$2,090 – NULL – 0:0*, -35.6% From Current Price Level

$2,080 – Buyers – 1.1:0*, -35.91% From Current Price Level

$2,070 – Buyers – 0.9:0*, -36.22% From Current Price Level

$2,060 – Sellers – 0.6:0*, 36.53% From Current Price Level

$2.050 – Sellers – 0.6:0*, -36.84% From Current Price Level

$2,040 – Sellers – 1.2:0*, -37.14% From Current Price Level

$2,030 – Buyers – 0.4:0*, -37.45% From Current Price Level

$2,020 – NULL – 0:0*, -37.76% From Current Price Level

$2,010 – Buyers – 3:0*, -38.07% From Current Price Level

$2,000 – Buyers – 1.57:1, -38.38% From Current Price Level

$1,990 – Buyers – 0.3:0*, -38.69% From Current Price Level

$1,980 – Buyers – 1:0*, -38.99% From Current Price Level

$1,970 – Buyers – 1.6:1, -39.3% From Current Price Level

$1,960 – Sellers – 1.5:1, -39.61% From Current Price Level

$1,950 – Sellers – 3:1, -39.92% From Current Price Level

$1,940 – Sellers – 1.07:1, -40.23% From Current Price Level

$1,930 – Sellers – 2.3:0*, -40.53% From Current Price Level

$1,920 – NULL – 0:0*, -40.84% From Current Price Level

$1,910 – Sellers – 0.5:0*, -41.15% From Current Price Level

$1,900 – NULL – 0:0*, -41.46% From Current Price Level

$1,890 – NULL – 0:0*, -41.77% From Current Price Level

$1,880 – NULL – 0:0*, -42.07% From Current Price Level

$1,870 – NULL – 0:0*, -42.38% From Current Price Level

$1,860 – Buyers – 0.7:0, -42.69% From Current Price Level

$1,850 – NULL – 0:0*, -43% From Current Price Level

$1,840 – NULL – 0:0*, -43.31% From Current Price Level

$1,830 – NULL – 0:0*, -43.62% From Current Price Level

Tying It All Together

The list & image above paint the picture as to how investors & traders have behaved at various price levels that BKNG has been at over the past one-to-two years.

It is not meant to serve as investment/trading advice, and is simply a way to visualize what investor/trader sentiment has been like at each of the price levels mentioned, as well as what it was at levels of support & resistance that are denoted in the image & list.

As always, do your own due diligence before making investing/trading decisions.

For more on the methodology on how the data was collected & put together, please refer to our original Price:Volume analysis.

*** I DO NOT OWN SHARES OR OPTIONS CONTRACT POSITIONS IN BKNG AT THE TIME OF PUBLISHING THIS ARTICLE ***
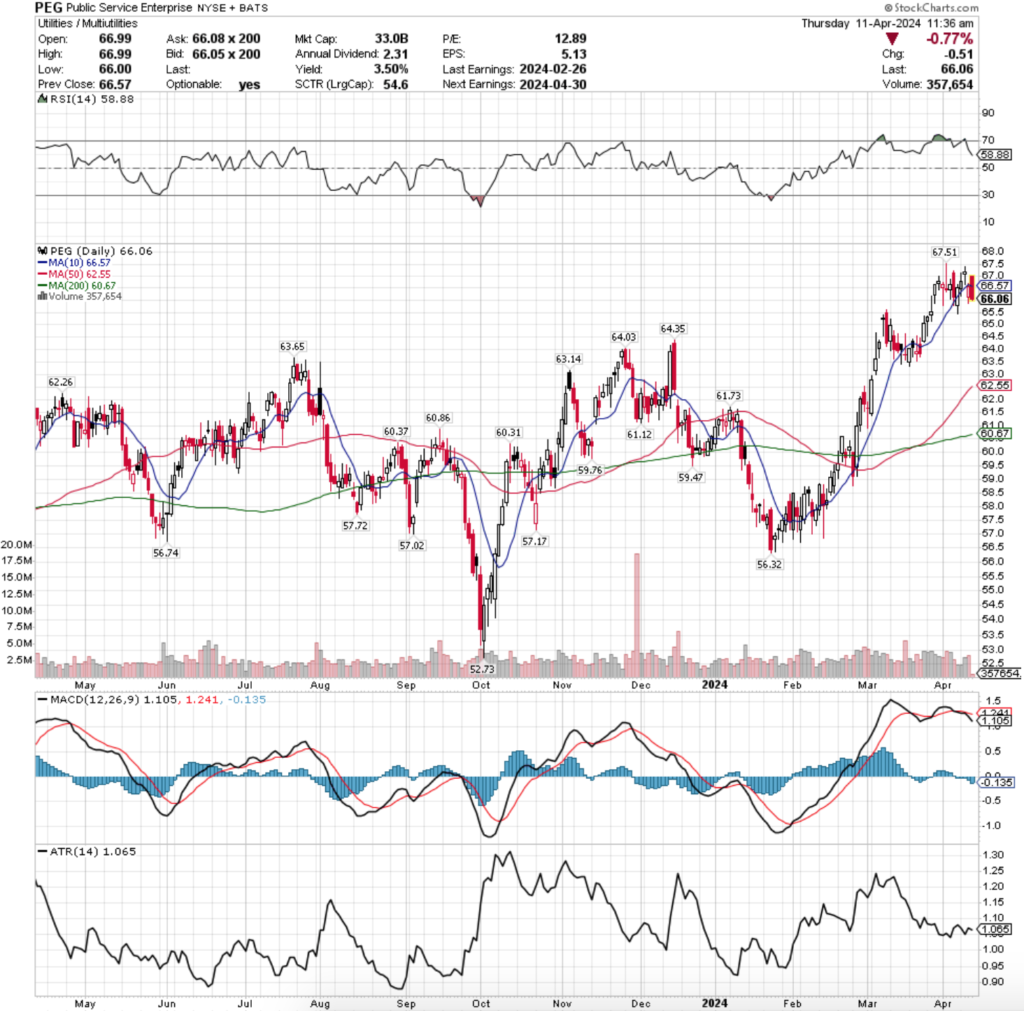
Price:Volume Sentiment Analysis For Carrier Global Corp. CARR Stock

Carrier Global Corp. stock trades under the ticker CARR & has had a strong past few months following a five month consolidation range that they traded in to kick off 2023.

Strength in the homebuilding & construction industries this year has helped to drive strength to CARR stock’s results in 2023.

They’ve just come off of a 52-week high that was achieved on 8/1, with their technical indicators & oscillators signaling that there is a cool-off period coming in the near-term, which makes it important to have an understanding of how the buyers & sellers have behaved at different price levels in recent history.

The Price:Volume analysis below seeks to display the volume at specific share-price levels from over the past two-to-three years & is intended to serve as a reference point for how investors viewed CARR stock’s value at each level.

It also includes a list of moving averages, as well as support & resistance levels, which will be marked in bold.

Carrier Global Corp. CARR Stock’s Price:Volume Sentiment Broken Down

Carrier Global Corp. CARR Stock’s Technical Performance Over The Past Year

As noted above, CARR reached their 52-week high about one week ago & has begun to consolidate ever since.

At the time of taking the screenshot above (9:52 am on 8/7/2023), their share price was being supported by their 10 day moving average, but is hovering 0.17% above the support level.

Their RSI has just declined from oversold territory, but is still close to the oversold level, currently at 66.5 & their MACD has just bearishly crossed over last week.

Trading volumes over the past week (ex-today’s) are 14% higher than the average volumes for the past year (5,481,540 vs. 4,803,044), as investors were eager to take profits after a strong run that was capped off by a gap up on July 28,2023.

The session where they claimed their 52-week high closed in a spinning top candlestick, which is a sign of uncertainty among market participants & foretold the performance that we have seen over the past week.

Further weakness has been signaled by the hanging men candlesticks on 8/2 & 8/4, and while today’s session isn’t halfway over, the current chart is signaling that today’s session will close in a bearish harami pattern, which indicates further trouble on the horizon.

Support levels near their current price over the past year are scarce for CARR, who has spent much of this year relatively rangebound, which occurred on very light volume compared to other recent sessions, which investors could infer the coming weakness from.

The nearest support beyond the 10 day moving average is currently the 50 day moving average, which is -13.05% below the current price at $50.10.

With so much space without stable footing, it is important to be able to understand how investors have behaved at each price level that they have traded at in recent history in order to understand where they may find footing for support, or how far they can potentially fall.

The volume data covers the past 2-3 years, so the chart below has been added to help visualize how the price has moved over that time period.

Carrier Global Corp. CARR Stock’s Technical Performance Over The Past 2-3 Years

The bold prices on the image below denote the moving average levels just listed & the bold entries in the list form of the analysis under the images include other levels of support.

Each corresponding price level using a ratio of Buyers:Sellers (or Sellers:Buyers), NULL values denote that there was not enough data, so the ratio would’ve been 0:0.

Ratios with a 0 for the denominator/constant are denoted with an *, but are reported as is, as we are accounting for volume/sentiment.

Carrier Global Corp. CARR Stock’s Support & Resistance Levels Over The Past 2-3 Years With Price:Volume Level Sentiment

Carrier Global Corp. CARR Stock’s Volume By Price Level

$61 – NULL – 0:0*, +5.87% From Current Price Level

$60 – NULL – 0:0*, +4.13% From Current Price Level

$59 – Buyers – 0.7:0*, +2.4% From Current Price Level

$58 – Even – 1:1, +0.66% From Current Price Level

$57 – Sellers – 0.5:0*, -1.08% From Current Price Level – 10 Day Moving Average

$56 – Buyers – 7.5:1, -2.81% From Current Price Level

$55 – Buyers – 1.46:1, -4.55% From Current Price Level

$54 – Buyers – 1.6:1, -6.28% From Current Price Level

$53 – Buyers – 1.05:1, -8.02% From Current Price Level

$52 – Even – 1:1, -9.75% From Current Price Level

$51 – Buyers – 3.17:1, -11.49% From Current Price Level

$50 – Sellers – 3.08:1, -13.22% From Current Price Level – 50 Day Moving Average

$49 – Buyers – 1.06:1, -14.96% From Current Price Level

$48 – Buyers – 3:1, -16.7% From Current Price Level

$47 – Buyers – 1.64:1, -18.43% From Current Price Level

$46 – Buyers – 1.47:1, -20.17% From Current Price Level

$45 – Buyers – 1.93:1, -21.9% From Current Price Level

$44 – Buyers – 1.22:1, -23.64% From Current Price Level – 200 Day Moving Average

$43 – Buyers – 1.45:1. -25.37% From Current Price Level

$42 – Sellers – 1.1:1, -27.11% From Current Price Level

$41 – Sellers – 1.01:1, -28.84% From Current Price Level

$40 – Sellers – 1.62:1, -30.58% From Current Price Level

$39 – Buyers – 1.34:1. -32.32% From Current Price Level

$38 – Sellers – 1.82:1, -34.05% From Current Price Level

$37 – Buyers – 1.07:1, -35.79% From Current Price Level

$36 – Buyers – 1.3:1, -37.52% From Current Price Level

$35 – Sellers – 1.31:1, -39.26% From Current Price Level

$34 – Sellers – 2.25:1, -40.99% From Current Price Level

$33 – Sellers – 2.38:1, -42.73% From Current Price Level

$32 – Buyers – 1.09:1, -44.46% From Current Price Level

$31 – Even – 1:1, -46.2% From Current Price Level

$30 – Buyers – 4:1, -47.93% From Current Price Level

$29 – Buyers – 6.43:1, -49.67% From Current Price Level

$28 – Buyers – 1.3:1, -51.41% From Current Price Level

$27 – Sellers – 2.8:1, -53.14% From Current Price Level

$26 – Buyers – 2.8:0*, -54.88% From Current Price Level

$25 – Sellers – 2.25:1, -56.61% From Current Price Level

$24 – Buyers – 0.5:0*, -58.35% From Current Price Level

$23 – Buyers – 1.82:1, -60.08% From Current Price Level

$22 – Sellers – 1.17:1, -61.82% From Current Price Level

$21 – Buyers – 4.36:1, -63.55% From Current Price Level

$20 – Sellers – 2.05:1, -65.29% From Current Price Level

$19.50 – Buyers – 2.3:0*, -66.16% From Current Price Level

$19 – Buyers – 0.6:0*, -67.03% From Current Price Level

$18.50 – Buyers – 2:1, -67.89% From Current Price Level

$18 – Sellers – 3:1, -68.76% From Current Price Level

$17.50 – Buyers – 3:1, -69.63% From Current Price Level

$17 – Sellers – 0.5:0*, -70.5% From Current Price Level

$16.50 – Buyers – 1:0*, -71.36% From Current Price Level

$16 – NULL – 0:0*, -72.23% From Current Price Level

$15.50 – Buyers – 1.93:1, -73.1% From Current Price Level

$15 – Sellers – 1.1:0*, -73.97% From Current Price Level

$14.50 – NULL – 0:0*, -74.84% From Current Price Level

$14 – NULL – 0:0*, -75.7% From Current Price Level

$13.50 – NULL – 0:0*, -76.57% From Current Price Level

$13 – NULL – 0:0*, -77.44% From Current Price Level

$12.50 – NULL – 0:0*, -78.31% From Current Price Level

$12 – NULL – 0:0*, -79.17% From Current Price Level

Tying It All Together

The list & image above paint the picture as to how investors & traders have behaved at various price levels that CARR has been at over the past two-to-three years.

It is not meant to serve as investment/trading advice, and is simply a way to visualize what investor/trader sentiment has been like at each of the price levels mentioned, as well as what it was at levels of support & resistance that are denoted in the image & list.

As always, do your own due diligence before making investing/trading decisions.

For more on the methodology on how the data was collected & put together, please refer to our original Price:Volume analysis.

*** I DO NOT OWN SHARES OR OPTIONS CONTRACT POSITIONS IN CARR AT THE TIME OF PUBLISHING THIS ARTICLE ***
Price:Volume Sentiment Level Analysis For Meta Platforms, Inc. META Stock

Meta Platforms, Inc. stock trades under the ticker META & has steadily climbed from their 52-week low in November of 2022 to reach their 52-week high last week.

A gap up in February & one in April of 2023 have provided much of the catalyst that has fueled this ascent.

Given that they are now just beneath a 52-week high, it is time to begin looking to see how strong their support levels are in order to get an idea as to how far they might fall in the event of a correction.

The Price:Volume analysis below seeks to display the volume at specific share-price levels from over the past one-to-two years & is intended to serve as a reference point for how investors viewed META stock’s value at each level.

It also includes a list of moving averages, as well as support & resistance levels, which will be marked in bold.

Meta Platforms, Inc. META Stock’s Price:Volume Sentiment Broken Down

Meta Platforms, Inc. META Stock's Technical Performance Over The Past Year
Meta Platforms, Inc. META Stock’s Technical Performance Over The Past Year

Their RSI is neutral at 49.74, with a bearish MACD after declining the past three days from their 52-week high.

Investors have begun to get skittish, with average trading volumes falling -17.83% over the past week (26,448,950 vs. 32,188,510), indicating indecisiveness on the part of market participants.

Last Thursday’s session saw the breakdown of the 10 day moving average as a support level, with the share price breaking through the 20 day moving average on Friday.

Yesterday’s spinning top candlestick indicates that there is further uncertainty in the near-term, as they approach the next two support levels, $276.57 (-5.16%) & $276.02 (50 Day Moving Average, -5.35%), making it important to understand how market participants have behaved at other price levels in recent history.

The volume data covers the past 1-2 years, so the chart below has been added to help visualize how the price has moved over that time period.

Meta Platforms, Inc. META Stock's Technical Performance Over The Past 1-2 Years
Meta Platforms, Inc. META Stock’s Technical Performance Over The Past 1-2 Years

The bold prices on the image below denote the moving average levels just listed & the bold entries in the list form of the analysis under the images include other levels of support.

Each corresponding price level using a ratio of Buyers:Sellers (or Sellers:Buyers), NULL values denote that there was not enough data, so the ratio would’ve been 0:0.

Ratios with a 0 for the denominator/constant are denoted with an *, but are reported as is, as we are accounting for volume/sentiment.

Meta Platforms, Inc. META Stock's Support & Resistance Levels Over The Past 1-2 Years With Price:Volume Level Sentiment
Meta Platforms, Inc. META Stock’s Support & Resistance Levels Over The Past 1-2 Years With Price:Volume Level Sentiment
Meta Platforms, Inc. META Stock's Price:Volume Level Sentiment Over The Past 1-2 years
Meta Platforms, Inc. META Stock’s Price:Volume Level Sentiment Over The Past 1-2 years
Meta Platforms, Inc. META Stock's Price:Volume Level Sentiment Over The Past 1-2 years
Meta Platforms, Inc. META Stock’s Price:Volume Level Sentiment Over The Past 1-2 years
Meta Platforms, Inc. META Stock's Price:Volume Level Sentiment Over The Past 1-2 years
Meta Platforms, Inc. META Stock’s Price:Volume Level Sentiment Over The Past 1-2 years

Meta Platforms, Inc. META Stock’s Volume By Price Level

$320 – NULL – 0:0*, +9.74% From Current Price

$316 – Buyers – 1.1:0*, +8.36% From Current Price (52-Week High)

$312 – Buyers – 2.6:0*, +76.99% From Current Price

$308 – Buyers – 2.82:1, +5.62% From Current Price (2 Year Chart)

$304 – NULL – 0:0*, +4.25% From Current Price – 10 Day Moving Average

$300 – Sellers – 1.2:0*, +2.88% From Current Price

$296 – Buyers – 2.3:0*,+1.51% From Current Price (2 Year Chart)

$292 – Buyers – 3.6:0*, +0.13% From Current Price

$288 – Sellers – 1.42:1, -1.24% From Current Price

$284 – Buyers – 1.91:1, -2.61% From Current Price

$280 – Sellers – 3.25:1, -3.98% From Current Price

$276 – Sellers – 1.2:0*, -5.35% From Current Price

$272 – Buyers – 3.2:0*, -6.72% From Current Price

$268 – Sellers – 1.12:1, -8.1% From Current Price

$264 – Buyers – 3.2:0*, -9.47% From Current Price

$260 – Buyers – 1.92:1, -10.84% From Current Price

$256 – NULL – 0:0*, -12.21% From Current Price

$252 – Buyers – 1.2:0*, -13.58% From Current Price

$248 – Buyers – 2.2:0*, -14.95% From Current Price

$244 – Sellers – 1.58:1, -16.33% From Current Price

$240 – Buyers – 4.6:0*, -17.7% From Current Price

$236 – Buyers – 1.31:1, -19.07% From Current Price

$232 – Sellers – 1.48:1, -20.44% From Current Price

$228 – NULL – 0:0*, -21.81% From Current Price

$224 – NULL – 0:0*, -23.19% From Current Price

$220 – Buyers – 2.2:0*, -24.56% From Current Price

$216 – Sellers – 1.08:1, -25.93% From Current Price

$212 – Sellers – 1.6:1, -27.3% From Current Price

$208 – Buyers – 3.67:1, -28.67% From Current Price

$204 – Buyers – 7.3:1, -30.04% From Current Price

$200 – Sellers – 1.06:1, -31.42% From Current Price

$198 – Sellers – 1.4:0*, -32.1% From Current Price

$196 – Buyers – 3.3:0*, -32.79% From Current Price

$194 – Sellers – 1.14:1. -33.47% From Current Price

$192 – NULL – 0:0*, -34.16% From Current Price

$188 – Buyers – 7.6:0*, -34.84% From Current Price

$186 – Sellers – 6:0*, -35.53% From Current Price

$184 – Sellers – 1.13:1, -36.22% From Current Price

$182 – Sellers – 1.9:0*, -36.9% From Current Price

$180 – Buyers – 2.58:1, -37.59% From Current Price

$178 – Buyers – 1.68:1, -38.27% From Current Price

$176 – Sellers – 4.2:0*, -39.65% From Current Price

$174 – Sellers – 1.13:1, -40.33% From Current Price

$172 – Sellers – 1.86:1, -41.02% From Current Price

$170 – Sellers – 2.1:0*, -41.7% From Current Price

$168 – NULL – 0:0*, -42.39% From Current Price

$166 – Sellers – 1.3:0*, -43.07% From Current Price

$164 – Buyers – 1.5:0*, -43.76% From Current Price

$162 – Buyers – 4.2:1, -44.45% From Current Price

$160 – Sellers – 3:1, -45.13% From Current Price

$158 – Sellers – 2:0*, -45.82% From Current Price

$156 – Sellers – 1:0*, -46.5% From Current Price

$154 – NULL – 0:0*, -47.19% From Current Price

$152 – Buyers – 1.27:1, -47.88% From Current Price

$150 – Sellers – 1.11:1, -48.56% From Current Price

$148 – Buyers – 1.63:1, -49.25% From Current Price

$146 – Sellers – 3.92:1, -49.93% From Current Price

$144 – NULL – 0:0*, -50.62% From Current Price

$142 – Buyers – 1.03:1, -51.3% From Current Price

$140 – Buyers – 1.14:1, -51.99% From Current Price

$138 – Buyers – 3.62:1, -52.68% From Current Price

$136 – Buyers – 1.71:1, -53.36% From Current Price

$134 – Sellers – 2.8:1, -54.05% From Current Price

$132 – Sellers – 1.27:1, -54.73% From Current Price

$130 – Sellers – 1.19:1, -55.42% From Current Price

$128 – Sellers – 11:0*, -56.11% From Current Price

$126 – Sellers – 2.47:1, -56.79% From Current Price

$124 – Buyers – 1.9:0*, -57.48% From Current Price

$122 – Buyers – 1.11:1, -58.16% From Current Price

$120 – Buyers – 8:0*, -58.85% From Current Price

$118 – Buyers – 7.3:0*, -59.53% From Current Price

$116 – Buyers – 1.03:1, -60.22% From Current Price

$114 – Sellers- 1.02:1, -60.91% From Current Price

$112 – Buyers – 1.93:1, -61.59% From Current Price

$110 – Buyers – 2.43:1, -62.28% From Current Price

$108 – Sellers – 1.83:1, -62.96% From Current Price

$106 – NULL – 0:0*, -63.65% From Current Price

$104 – NULL – 0:0*, -64.34% From Current Price

$102 – NULL – 0:0*, -65.02% From Current Price

$100 – Buyers – 5.3:0*, -65.71% From Current Price

$99 – Buyers – 4.9:0*, -66.05% From Current Price

$98 – NULL – 0:0*, -66.39% From Current Price

$97 – Sellers – 11.7:0*, -66.74% From Current Price

$96 – Buyers – 1.52:1, -67.08% From Current Price

$95 – Buyers – 5.6:0*, -67.42% From Current Price

$94 – NULL – 0:0*, -67.77% From Current Price

$93 – Sellers – 6.1:0*, -68.11% From Current Price

$92 – NULL – 0:0*. -68.45% From Current Price

$91 – NULL – 0:0*, -68.79% From Current Price

$90 – Sellers – 1.25:1, -69.14% From Current Price

$89 – Sellers – 3:0*, -69.48% From Current Price

$88 – NULL – 0:0*, -69.82% From Current Price

Tying It All Together

The list & image above paint the picture as to how investors & traders have behaved at various price levels that META has been at over the past one-to-two years.

It is not meant to serve as investment/trading advice, and is simply a way to visualize what investor/trader sentiment has been like at each of the price levels mentioned, as well as what it was at levels of support & resistance that are denoted in the image & list.

As always, do your own due diligence before making investing/trading decisions.

For more on the methodology on how the data was collected & put together, please refer to our original Price:Volume analysis.

*** I DO NOT OWN SHARES OR OPTIONS CONTRACT POSITIONS IN META AT THE TIME OF PUBLISHING THIS ARTICLE ***